Sigmoidal Gradients in the HPLC-Based Analysis of Biotherapeutic Products
LCGC North America
A systematic approach for formation of sigmoidal gradient for analysis of biopharmaceutical proteins has been reviewed and discussed together with two case studies. The first application involves HPLC separation of the various product related variants of a microbial expressed biotherapeutic, granulocyte colony stimulating factor (GCSF). The second case study involves separation of the charge heterogeneity related variants for a monoclonal antibody (mAb) biotherapeutic product. In all cases, it is observed that the use of sigmoidal gradient successfully reduces the analysis time significantly (from 70 minutes to 15 minutes for GCSF and from 40 minutes to 4 minutes for the mAb) while retaining the selectivity and the resolution.
This installment of “Biotechnology Today” reviews and discusses a systematic approach for the formation of sigmoidal gradients for the analysis of biopharmaceutical proteins together with two case studies. The first application involves high performance liquid chromatography (HPLC) separation of the various product-related variants of a microbial-expressed biotherapeutic, granulocyte colony stimulating factor (GCSF). The second case study involves separation of the charge heterogeneity related variants for a monoclonal antibody (mAb) biotherapeutic product. In both cases, the use of the sigmoidal gradient successfully reduced the analysis time significantly while retaining the selectivity and resolution.
Protein therapeutics, such as monoclonal antibodies (mAbs), enzymes, and toxins, hold significant promise for improving human health (1). Major concerns for this class of biotech therapeutics are the heterogeneities-such as glycosylation, deamidation, oxidation, and disulfide bond formation and free thiols-produced during expression, purification, and storage of the product. Accurate quantification of such heterogeneities requires a thorough characterization using multiple orthogonal, high-resolution analytical techniques before a manufacturer can receive regulatory approval to commercialize the product (2). Of the various tools that are part of this arsenal, high performance liquid chromatography (HPLC) remains the workhorse for analysis of biopharmaceutical proteins. The significant advantages that HPLC offers include reproducibility, high sample throughput because of autosampling capabilities, high resolution, easy quantitation, precision, and robustness (3). HPLC is used in various modes, but the most prominent are normal-phase, reversed-phase, ion-exchange, and size-exclusion modes. One must also choose whether to perform product elution in either the isocratic or the gradient mode. Further, the gradient can be implemented in linear or nonlinear shapes. Linear gradients can be easily converted into segmented linear gradients to reduce run time if peaks are distributed widely and nonuniformly. Hence, they are generally preferred because they are easy to implement. However, nonlinear gradients have several distinct advantages, including reduced separation time, improved sample resolution, and increased detection sensitivity (4–7).
A few studies exist in the literature that suggest the superiority of sigmoidal gradients with respect to achieving rapid, high-resolution separations. In 1994, Hendrix and Wei (8) demonstrated the use of sigmoidal gradients in the high-performance anion-exchange chromatography (HPAEC) analysis of Bemisia honeydew for resolving 30 different components and characterizing them with gas chromatography–mass spectrometry (GC–MS) and nuclear magnetic resonance (NMR) spectroscopy. The separation of carotenes from U. violacea using HPLC with a C18 reversed-phase column, eluted with a 2-propanol and aqueous acetonitrile sigmoidal gradient, has also been reported (9). Elution of hex C as a discrete peak has been achieved with a sigmoid gradient of sodium chloride in the phosphate buffer pH 7.3, in ion-exchange chromatography (10). In 1976, Stotzler and Duntze (11) used a sigmoidal gradient of n-propanol in pyridinium formate for isolation of α-factor, a mating hormone produced by the mating type cells of Saccharomyces cerevisiae, using acidic cation exchanger, Biorex 70. Glycolytic and gluconeogenic metabolites have been separated using a sigmoid salt gradient in the presence of borate (12).
Optimization of the gradient is likely to be the most important task when creating a rapid analytical method. If a sample contains many heterogeneous components, optimum separation is unlikely via isocratic elution. Method development of a gradient method requires optimization of its steepness, range, and shape. Although the topic of optimization of gradient shape in reversed-phase HPLC has been extensively covered in the literature (13–18), optimization of a sigmoidal shaped gradient has not received much attention. While several such applications have been reported in the literature, a systematic approach for development and use of concave and sigmoidal gradients has been published only recently (19–21). The approach was successfully demonstrated for performing rapid, cation exchange HPLC-based analysis of charge heterogeneity in mAb type products (19). Parameters including pH, shape of elution gradient, and length of the column were optimized, and the resulting method used a sigmoidal gradient with a run time of 4 min (the conventional method takes more than 40 min). The method was successfully evaluated for specificity, sensitivity, linearity, limit of detection, and limit of quantification. In another similar application, a sigmoidal gradient was successfully utilized to separate product-related variants of granulocyte colony stimulating factor (GCSF) via reversed-phase HPLC (20). As in the previous application, the time of analysis was successfully reduced from 70 min for the pertinent European Pharmacopoeia (EP) method to 15 min. In this column installment, we review this novel approach for the analysis of biotherapeutics.
Theory
In this section we briefly present the equations that govern gradient formation. The formation of sigmoidal gradient can be demonstrated using the following equations (19–21).
If t is the interval between change in gradient percentage, tf is the total number of intervals of gradient change, and T is the total time of the linear, concave-up, and concave-down gradient, then %B can be calculated as follows (16,17):

where B0 is the initial solvent composition and Bf is the mid- or end-level solvent composition. Further, at the time points, Tp(t)

C(t) is function of t given by:

for linear gradient or,

for concave down gradient or

for a concave-up gradient, where n is the number controlling the steepness (concavity) of gradient shape.
In most cases, either the concave-up or concave-down shape may yield satisfactory results. In cases where the sample contains a main component and other closely related variants, the gradient slope at the point of elution of the main component must be the shallowest. This can be achieved by applying a mixture of concave-down (equation 4) and concave-up gradients (equation 5). To make a smooth transition from concave down to concave-up mode, the parameter B0 of the concave-up shape can be made equal to Bf of the concave-down shape. This combination will result in formation of a sigmoidal gradient. This shape ensures that the shallowest slope is applied during elution of the main component and that steep slope is applied during elution of the other components that are eluted before or after the main component. Further, steepness for the first half or later half can be controlled independently by varying n.
Materials and Methods
Protein Samples
The therapeutic protein samples used in this study were that of recombinant human GCSF (E. coli derived) and mAb. The GCSF was generated in our laboratory using inclusion bodies donated from a major domestic biotech manufacturer, and the mAb was also donated by a major domestic biotech manufacturer.
Instrumentation
Analytical chromatography was performed using an Acquity H-Class UPLC system (Waters Corporation) equipped with a quaternary solvent pump, an autosampler, and a photodiode-array detector. Instrument control, data acquisition, and compilation of results for the Acquity system was performed using Empower-II software (Waters Corporation).
Columns
For GCSF
Three reversed-phase columns were examined in this study: a 250 mm × 4.6 mm, 5-μm C4 column from Phenomenex; a 250 mm × 4.6 mm, 3.5-μm X-bridge BEH300 column from Waters; and a 150 mm × 4.6 mm, 3.5-μm X-bridge BEH300 C4 column from Waters. The columns from Waters were operated at a flow rate of 0.8 mL/min whereas the one from Phenomenex was operated at 0.6 mL/min.
For mAb
Two strong ion-exchange columns were used in this study, namely a 250 mm × 4.6 mm, 5-µm MAbPac SCX-10, RS column and a 150 mm × 4.6 mm, 5-µm MAbPac SCX-10, RS column, both purchased from Dionex (now Thermo Fisher Scientific). The flow rates used for the first and second columns were 1.2 mL/min and 1.5 mL/min, respectively.
Mobile-Phase Preparation
For GCSF
HPLC-grade acetonitrile, methanol, isopropanol, trifluoroacetic acid, and Milli-Q water (EMD Millipore) used in the experiments were procured from Merck, India. The organic phases were prepared with appropriate mixing of 99.9% organic phase and 0.1% trifluoroacetic acid, filtered with a 0.22-µm nylon membrane filter, and degassed before usage.
For mAb
HPLC-grade sodium dihydrogen phosphate and disodium hydrogen phosphate used in the experiments were procured from Merck, India. Buffers were prepared by appropriate mixing of the respective salt and were filtered with a 0.22-µm nylon membrane filter and degassed before usage. The buffer combination consisted of 10 mM sodium phosphate (mobile-phase A) and 150 mM sodium phosphate (mobile-phase B). The percentages of mobile-phase B that were required for elution have been designated as %B.
Nomenclature of Peaks
For GCSF
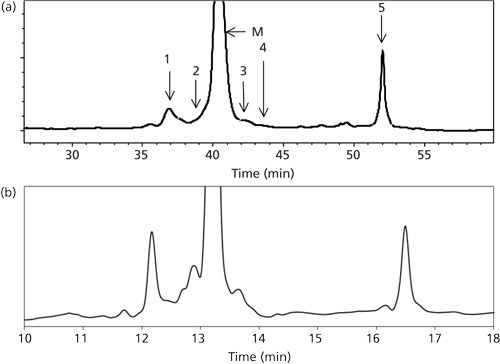
The reversed-phase HPLC chromatogram for GCSF had six distinct peaks, and these were named as 1 and 2 for oxidized species, M for native species, 3 and 4 for reduced species, and 5 for aggregates. Figure 1a shows a typical chromatogram and illustrates the location of each of these peaks.
For mAb
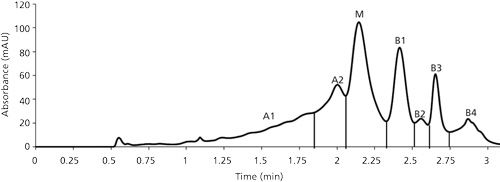
The cation-exchange HPLC chromatogram of mAb resulted in the formation of seven distinct peaks, namely A1, A2, M, B1, B2, B3, and B4. The peaks A1 and A2 are grouped as the acidic variants, peak M is the main peak, and peaks B1, B2, and so on are grouped as basic variants of the respective mAb. Figure 2 shows the cation-exchange HPLC chromatogram for the mAb along with the location of each peak.
Results and Discussion
Strategy
A sigmoidal gradient is the mixture of a concave-down gradient in the first half and a concave-up gradient in the second half. The reasoning behind the use of this gradient lies in the fact that it provides a flat (or shallow) gradient during elution of the main component and a steep gradient during the elution of the impurities. The use of such a shallow gradient during elution helps in a good resolution of the main peak, while a steep gradient before and after the main peak elution helps to elute impurities faster and makes the gradient shorter. The sigmoidal gradient is developed in three main steps. The first step involves optimization of the center point (Bf of concave-down shape = B0 of the concave-up shape). The second step involves optimization of the initial composition (B0 of concave down). Finally, the third step comprises optimization of the steepness factor n. The rationale of optimizing in this order is based on our previous assessment of the importance of each parameter. On finalizing B0, Bf, and n, the gradient step interval, flow rate, and length of column are optimized for shortening the method time. A more detailed procedure of optimization has been published previously (19,20).
Case Study 1: Reversed-Phase HPLC of GCSF
GCSF, also known as filgrastim, is a cytokine produced by macrophages, endothelial cells, monocytes, and fibroblasts (22). Oxidized and reduced variants of the GCSF are two of the most critical product-related impurities that are known to impact the safety and efficacy of the product (23). Reversed-phase HPLC is presently the primary analytical tool used for quantitation of these product-related variants in view of the differences in their hydrophobicity (24). The standard reversed-phase HPLC method, based on the EP, recommends the use of a C4 Phenomenex column, and consists of a segmented 55–99% gradient of acetonitrile-water with 0.1% trifluoroacetic acid as the ion-pair reagent at 60 °C. It has an analysis time of 70 min (25). Figure 1a illustrates a typical reversed-phase HPLC EP chromatogram for GCSF using this method. A close examination of the distribution of the oxidized, reduced, and aggregate peaks indicates that the peaks are not uniformly spaced, and this distribution provides an opportunity for the use of a nonlinear gradient as a possible approach to significantly reduce the time of analysis.
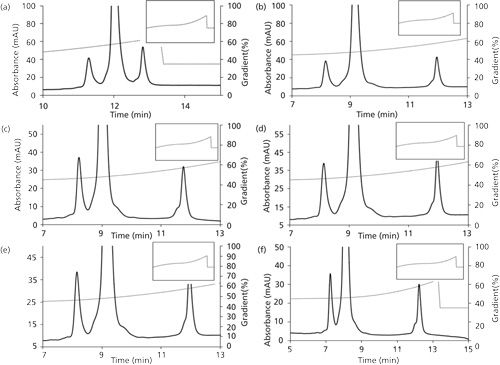
Figure 3 illustrates some of the results obtained from optimization studies that were performed for parameters Bf, B0, and n. A more detailed examination has been presented elsewhere (20). It is seen that all three parameters have a significant effect on the resolution of the separation. Based on the results, a Bf value of 45% (Figure 3b), a B0 value of 35% (Figure 3d), and an n value of 2 (Figure 3e) were selected as optimal conditions because they offer better resolution (20). Further, it can be seen in Figures 1a and 1b that the optimized method compares very well with the EP method with respect to resolution, though at a significantly reduced time of analysis.
In addition, the applicability of the proposed approach to a longer column (25 cm) was also examined, and it was demonstrated that the longer column offered higher resolution at higher product loading, albeit with a longer time of analysis (20).
Case Study 2: Cation-Exchange HPLC of mAb
Major parameters that are known to impact selectivity (for a given bead size and ligand chemistry) of charge variants in cation-exchange HPLC include pH of the mobile phase, salt species, and salt concentration (26). Furthermore, parameters that can impact method run time include the column length and gradient shape. To optimize such a system, a step-by-step approach, as discussed above, was followed. First, pH and salt concentration (parameters impacting selectivity) were optimized using a 15-cm ultrahigh-pressure liquid chromatography (UHPLC) column. A linear gradient of 30 min was used to determine the binding salt concentration for mAb. After the optimum selectivity had been determined, the gradient shape was optimized to reduce the method run time.
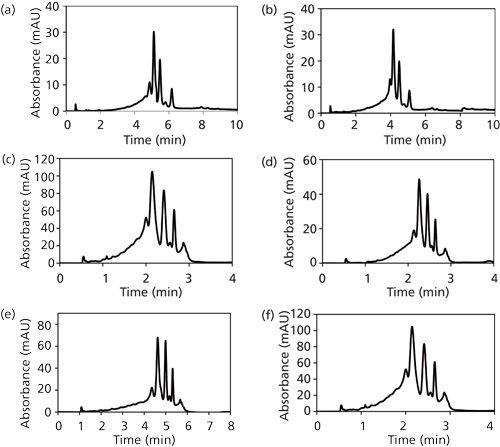
Figures 4a–4d show some of the results obtained from optimization studies that were performed for optimization of pH and salt species. These results show that both of these parameters have a significant effect on the resolution of the separation. Based on the results, a pH of 6.2 (Figure 4a) and phosphate salt (Figure 4c) were selected as optimal conditions.
The optimization of Bf, B0, and n for mAb has been demonstrated in our recently published work where the gradient parameters, B0 (concave down) and Bf (concave up), for a sigmoidal gradient were estimated to be 25% and 100%, respectively (19). The value of n was found to be 2.5 and Bf of the concave-down gradient (center point) was determined to be 40%.
The method was further validated for column length by demonstrating the applicability of the proposed approach to a longer column (25 cm). As expected, the higher bed height of 25 cm resulted in improvement in resolution for the mAb (Figure 4e). The optimal values for the initial and final salt composition (B0 and Bf) were found to remain unchanged.
Conclusions
This column installment reviewed a novel, recently published approach toward development of a sigmoidal gradient shape. The approach results in uniformly spaced peaks with a considerably shorter time of analysis. The sigmoidal gradient shape has been proposed for reversed-phase HPLC separation of GCSF product variants, as well as for cation-exchange HPLC separation of charge variants for a monoclonal antibody therapeutic. In both cases, the proposed approach resulted in a significant reduction in the time of analysis (from 70 min to 15 min for GCSF, and from 40 min to 4 min for the mAb), while retaining the selectivity and the resolution. The transferability of this method from smaller to longer columns or vice versa has also been demonstrated.
References
(1) A.S. De Groot and D.W. Scott, Trends Immunol.28(11), 482–490 (2007).
(2) I. Krull and A. Rathore, LCGC North Am.28(6), 454–468 (2010).
(3) V.S. Joshi and V. Kumar, LCGC North Am. 31(11), 948–953 (2013).
(4) J.W. Dolan and L.R. Snyder, Gradient Elution Chromatography in Encyclopedia of Analytical Chemistry, (John Wiley and Sons, Ltd., Hoboken, New Jersey, 2012), pp. 1–19. DOI: 10.1002/9780470027318.a5907.pub2/
(5) P. Jandera, J. Chromatogr. A 845(1), 133–144 (1999).
(6) P. Jandera and J. ChuráÄek, Adv. Chromatogr. 43, 1–108 (1985).
(7) A. Damtew, B. Sreedhar, and A. Seidel-Morgenstern, J. Chromatogr. A1216(28), 5355–5364 (2009).
(8) D.L. Hendrix and Y.A. Wei, Carbohydr. Res.253, 329–334 (1994).
(9) O.H. Will, M. Ruddat, E.D. Garber, and F.J. Kezdy, Current Microbiology10(2), 57–63 (1984).
(10) J.U. Ikonne, M.C. Rattazzi, and R.J. Desnick, Am. J. Hum. Biol.27(5), 639 (1975).
(11) D. Stötzler and W. Duntze, Eur. J. Biochem.65(1), 257–262 (1976).
(12) H.W. Hofer, Anal. Biochem.61(1), 54–61 (1974).
(13) M.A. Stadalius, H.S. Gold, and L.R. Snyder, J. Chromatogr. A296, 31–59 (1984).
(14) M.T. Hearn and B. Grego, J. Chromatogr. A255, 125–136 (1983).
(15) P.L. Zhu, L.R. Snyder, J.W. Dolan, N.M. Djordjevic, D.W. Hill, L.C. Sander, and T.J. Waeghe, J. Chromatogr. A756(1), 21–39 (1996).
(16) Y. Shan and A. Seidel-Morgenstern, J. Chromatogr. A1093(1), 47–58 (2005).
(17) P. Jandera, Z. KuÄerová, and J. Urban, J. Chromatogr. A1218(49), 8874-8889 (2011).
(18) A. Tarafder, L. Aumann, T. Müller-Späth, and M. Morbidelli, J. Chromatogr. A1167(1), 42–53 (2007).
(19) V. Joshi, V. Kumar, and A.S. Rathore, J. Chromatogr. A1406, 175–185, (2015).
(20) V.S. Joshi, V. Kumar, and A.S. Rathore, J. Chromatogr. Sci.53(3), 417–423, (2015).
(21) A.S. Rathore, V. Kumar, V.S. Joshi, and I.S. Krull, LCGC North Am.32(9), 736–740 (2014).
(22) I. Petit, M. Szyper-Kravitz, A. Nagler, M. Lahav, A. Peled, L. Habler, T. Ponomaryov, R.S. Taichman., F.A. Seisdedos, N. Fuji, J. Sandbank, D. Zipori, and T. Lapidot, Nature Immunology3(7), 687–694 (2002).
(23) A.S. Rathore and R. Bhambure, Anal. Bioanal. Chem.406(26), 6569–6576 (2014).
(24) H.S. Lu, C.L. Clogston, L.O. Narhi, L.A. Merewether, W.R. Pearl, and T.C. Boone, J. Biol. Chem.267(13), 8770–8777 (1992).
(25) European Pharmacopoeia Monograph 7 (EDQM Council of Europe, Strasbourg, France, 2010), pp. 2015–2018.
(26) M. Talebi, A. Nordborg, A. Gaspar, N.A. Lacher, Q. Wang, X.Z. He, P.R. Haddad, and E.F. Hilder, J. Chromatogr. A.1317, 148–154 (2013).

Varsha S. Joshiis a postdoctoral fellow with the Department of Chemical Engineering at the Indian Institute of Technology Delhi.
Ira S. Krull

is a Professor Emeritus with the Department of Chemistry and Chemical Biology at Northeastern University in Boston, Massachusetts, and a member of LCGC’s editorial advisory board.

Anurag S. Rathore is a professor in the Department of Chemical Engineering at the Indian Institute of Technology in Delhi, India.
Separating Impurities from Oligonucleotides Using Supercritical Fluid Chromatography
February 21st 2025Supercritical fluid chromatography (SFC) has been optimized for the analysis of 5-, 10-, 15-, and 18-mer oligonucleotides (ONs) and evaluated for its effectiveness in separating impurities from ONs.


