Analyzing Trace Levels of Carbon Tetrachloride in a Drug Substance by Headspace GC with Flame Ionization Detection
LCGC North America
A simple and accurate method for determining trace level of carcinogenic solvent carbon tetra chloride (CCl4) in Flunixin Meglumine, a drug substance which is white crystalline powder was developed by Gas chromatography .The method was observed to be robust and complete analytical method validation was performed and meets the requirements as per ICH guidelines. The method possesses the lowest detection level when compared with other methods currently available. The LOQ achieved by this method was 0.8 ppm and calibration curves were linear, R >0.998.In general, for analysis of halogenated compounds electron capture detector (ECD) were mostly used and in this proposed method flame ionization detector (FID) with internal standard was used. The method was implemented for various Active pharmaceutical ingredients (API) successfully.
A simple and accurate method for determining trace levels of the carcinogenic solvent carbon tetrachloride (CCl4) in flunixin meglumine, a white crystalline powder drug substance, was developed using gas chromatography (GC). The method was observed to be robust, and complete analytical method validation was performed and met the requirements as per International Conference on Harmonization (ICH) guidelines. The method provides a lower detection level than other currently available methods. The limit of quantification (LOQ) achieved by this method was 0.8 ppm and calibration curves were linear, with R > 0.998. In general, for the analysis of halogenated compounds, electron capture detection (ECD) has mostly been used, and in this proposed method flame ionization detection (FID) with an internal standard was used. The method was implemented successfully for various active pharmaceutical ingredients (APIs).
In pharmaceuticals, residual solvents are defined as organic volatile chemicals that are used or produced in the manufacture of drug substances. The residual solvents are not completely removed by practical manufacturing techniques. The use of appropriate solvents in manufacturing is done to increase the purity of the product, yield, crystal form, and solubility. These solvents in the products or substances do not provide therapeutic benefit, and they should be removed to the greatest extent possible to meet the specifications (1).
The objective of this method is to use the widely used flame ionization detection (FID) with the lowest possible detection limit and an internal standard to have consistent results.
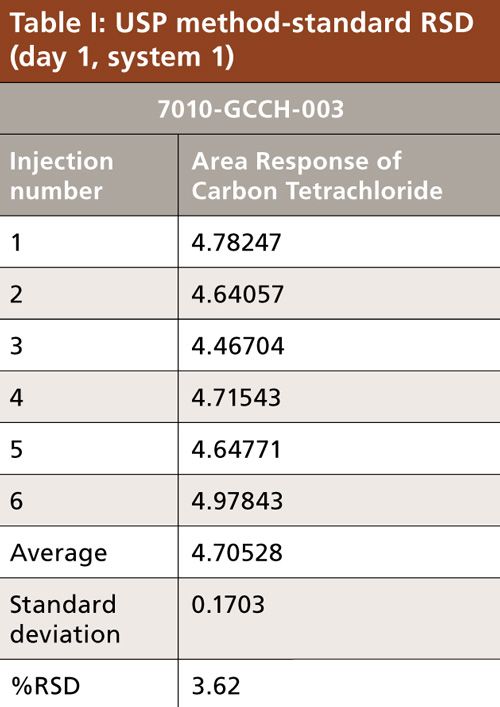
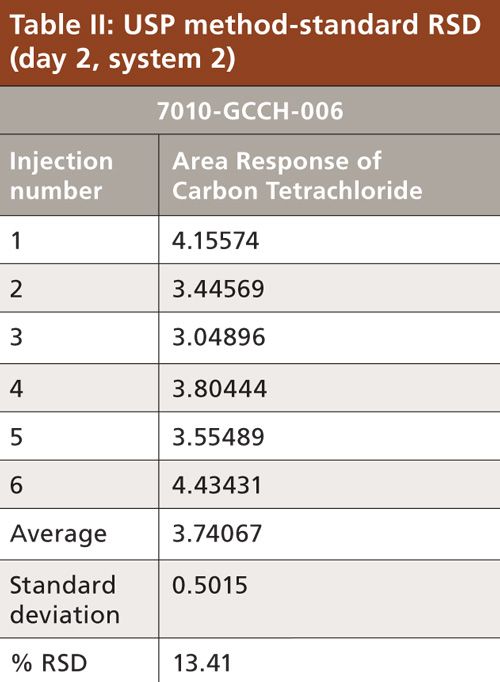
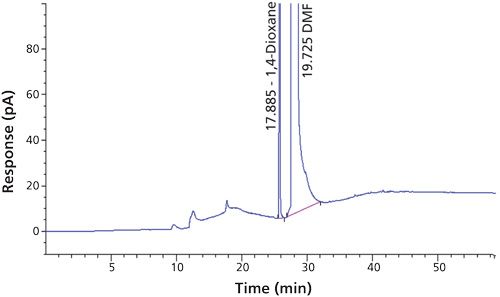
Carbon tetrachloride (CCl4) is one of the most potent hepatotoxins (toxic to the liver) and is categorized as a Class 1 solvent by the United States Pharmacopeia (USP). These Class 1 solvents should be avoided in manufacturing because they are known human carcinogens and environmental hazards. Therefore, it is essential to ensure that the residual solvents in pharmaceuticals are controlled and remain below the acceptable levels given in regulatory standards such as the International Conference on Harmonization (ICH) (2) and USP (1). The available method in the USP monograph has a quantification level of 4 ppm. That method often encounters pharmaceuticals that exceed the limit of basic system suitability, and sometimes there are no reproducible sample results. Also, there is a great deal of interference from other compounds that are eluted close to the carbon tetrachloride peak. The relative standard deviations (RSD) of the standard were inconsistent when using the USP method. The typical chromatograms and those RSD data obtained with two different systems and different days through USP methods were observed with a higher level of RSD (see Figures 1 and 2 and Tables I and II).
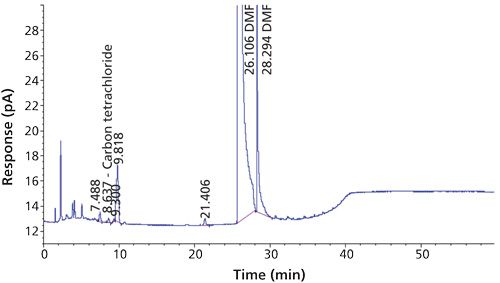
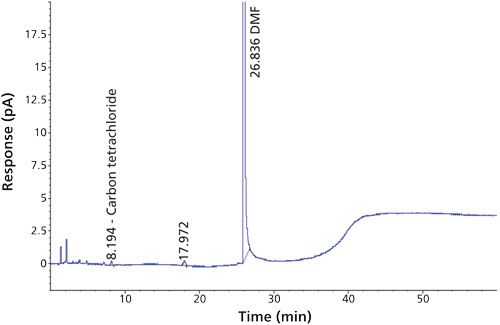
The USP method used 1 mL of sample and 5 mL of water (total volume of 6 mL in a 20-mL headspace vial) and the proposed method used 1 mL of internal standard and 1 mL of dimethyl formamide (total volume of 2 mL in a 20-mL headspace vial), thus increasing the vapor-phase level in the headspace, which increases the response. In the USP method there is no internal standard, but the proposed method used the internal standard 1,4-dioxane, which critically helps the area of reproducibility.
The split ratio given in USP is 1:3 while the proposed method is 1:1, which increases the area response and helps when the concentration is less. In this method, the temperature was increased; thereby vaporization increased and hence response also increased. The run time for this analysis is 30 min while the USP method has a 60-min run time.
The new method was developed with quantification level of 1.1 ppm using headspace gas chromatography (GC) coupled with FID. Patrian and colleagues (3) have developed the method for the determination of carbon tetrachloride in folpet (a protective leaf pesticide) formulations by headspace GC–mass spectrometry (MS). There was no clear information on detection level, such as limit of quantitation (LOQ) and limit of detection (LOD). In the headspace GC–MS technique, the response is increased by the trapping of moisture, but in the proposed method the same response is achieved by using modified instrument conditions and columns. In routine analysis, headspace GC–MS is not feasible as compared to headspace GC–FID (3). The proposed method when compared to the USP method uses a more polar column, modified temperature, headspace conditions, and an internal standard, which resulted in better repeatability and detectability. Fliszar and colleagues (4) have developed a method for the analysis of organic volatile impurities in pharmaceutical excipients by static headspace capillary GC–MS.
Nahid and colleagues (5) have developed the method for determination of carbon tetrachloride in drug product by GC coupled with electron capture detection (ECD), which has a detection level of 2 ppm (5). Much research has been carried out on organic volatile impurities (6–10), but it is not cost effective with lower detection limits. There was not much focus on Class 1 solvents-that is, the lowest detection limits for determining chloroform, benzene, and carbon tetrachloride were not found. The advantage of the headspace technique compared to neat injection includes introducing only volatile components of an aliquot into the column and thereby increasing the lifetime and performance of the column as well as the instrument (11). Headspace sampling is essentially a separation technique in which volatile material may be extracted from a heavier sample matrix and injected into a gas chromatograph for analysis. With valve-loop injection, after the equilibration time is complete, a sampling needle is inserted through the vial septum and the sample vial is pressurized to provide a final pressure of 1.5–2.0 atm.
Material and MethodChemicals and Reagents
Dimethyl formamide (GC grade purity 99.9%), 1,4-dioxane (analytical grade purity 99.8%), and carbon tetrachloride (GC grade 99.9%) were purchased from Merck. Dimethyl sulfoxide (GC grade purity 99.9%) was purchased from Spectrochem and n-butyl acetate (GC grade purity 99.7%) was purchased from Merck.
Instrumentation
A model 7694E headspace gas chromatograph (Agilent Technologies) with a flame ionization detector, Chemstation software, and a 50 m × 0.53 mm, 5-µm df DB-01 column was used.
Method Development
Both dimethyl sulfoxide and dimethyl formamide were considered for use as a diluent while the method was being developed. Poor resolution and repeatability were obtained with dimethyl sulfoxide, so dimethyl formamide was chosen as the diluent. Dimethyl formamide is commonly used for water-insoluble samples because of its solubilizing properties and higher boiling point (8). Similarly, we considered n-butyl acetate and 1,4-dioxane for use as the internal standard, and 1,4-dioxane was found to have better resolution. Nitrogen was used as the carrier gas. The oven temperature was initially maintained at 45 °C for 3 min and increased to 75 °C at the rate of 4 °C/min and held for 0.0 min. Again, the oven temperature was increased to 250 °C at the rate of 20 °C/min and held for 15 min. The inlet temperature was 250 °C, and the detector temperature was 280 °C. The carrier gas flow was 1.5 mL/min, and the split ratio was 1:1. Injection volume was 1 mL. The headspace incubation temperature was 130 °C, and the transfer line loop temperature was 170 °C. The elevated temperature in this method facilitated the vaporization increase and thereby increased the response level. The headspace vial equilibration time was 45 min, and the GC cycle time was 48 min. Headspace GC has become the preferred technique because it offers a distinct advantage over neat injection. In headspace analysis, a liquid or solid sample is placed in a sealed vial, which is then thermostated until a thermodynamic equilibrium between the sample and gas phase is reached (4).
Solution Preparation
Dimethyl formamide was used as diluent. The carbon tetrachloride standard was prepared at a concentration level of 0.01 mg/mL. Then, 5 g of flunixin meglumine sample was weighed into the headspace vial and 2 mL of diluent was added. An internal standard with a concentration of 0.1 mg/mL was added. The resolution obtained between carbon tetrachloride and 1,4-dioxane was Rs > 4. With this column and chromatographic conditions, we were able to detect the carbon tetrachloride with a very good response; this method was validated with various parameters. The internal standard method should compensate for variation and inaccuracies in the volume of the aliquot delivered into the chromatograph and hence provide a higher level of accuracy (12).
Result and Discussion
Method Validation
Complete analytical method validation was performed as per ICH guidelines (13) and the USP monograph (1).
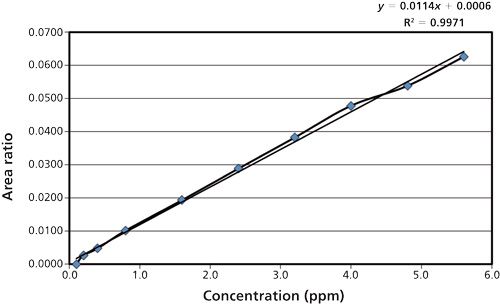
The following parameters have been considered for analytical method validation for the quantification of carbon tetrachloride in flunixin meglumine by GC: system suitability, specificity, linearity, limit of detection (LOD) and limit of quantification (LOQ), accuracy, precision, system precision, method precision, and range. The limit of carbon tetrachloride is 4 ppm. Solutions containing carbon tetrachloride were prepared at concentrations equivalent to 2% to 140% of the specified limit. Each solution was injected in duplicate. The area ratio of carbon tetrachloride to 1,4-dioxane internal standard was calculated for each chromatogram. The mean area ratio was calculated. The concentration of carbon tetrachloride (parts per million) on the x-axis was plotted against the mean area ratio on the y-axis. Correlation coefficients and regression coefficients (R2) were calculated between concentrations in parts per million on the x-axis against the mean area ratio for carbon tetrachloride on the y-axis. The aliquot solution of carbon tetrachloride was injected in six replicates. The percent relative standard deviation (% RSD) was calculated between the area response of carbon tetrachloride and 1,4-dioxane for six replicate injections.
Specificity and System Suitability
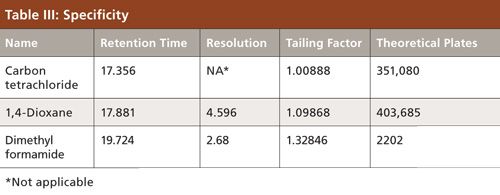
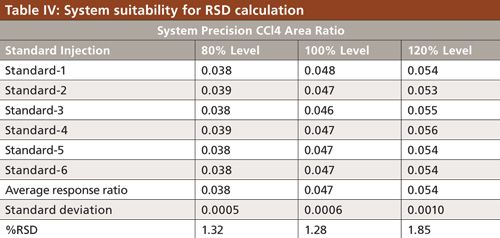
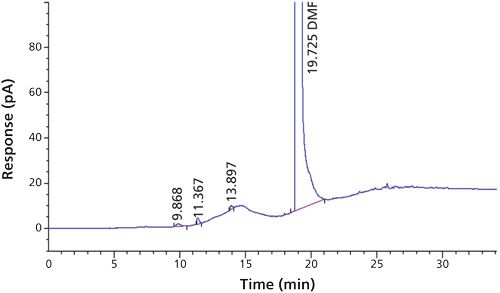
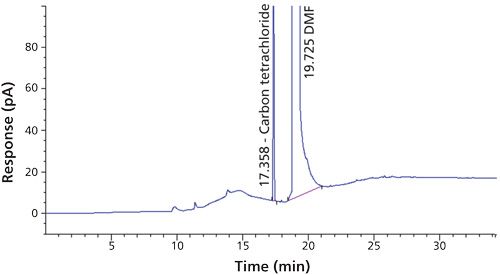
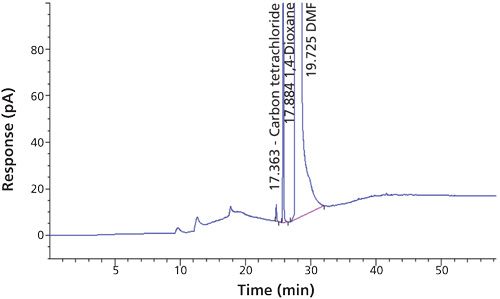
To verify that the analytical system was working properly and yielding accurate and precise results, the system suitability parameters were set. Specificity is the ability of analytical method to unequivocally assess the analyte in the presence of specified impurities that may be expected to be present. To identify the retention time of carbon tetrachloride, the internal standards 1,4-dioxane and dimethyl formamide were injected (Figures 3 to 6). The carbon tetrachloride standard solution was injected six times and the %RSD was calculated. The resolution Rs between the solvents was >2.0 and %RSD was <5.0% for the carbon tetrachloride standard solution (Tables III and IV).
Precision
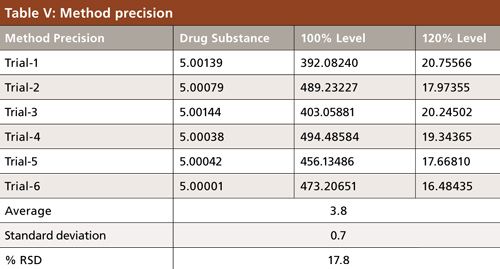
The precision of an analytical method is the degree of agreement among individual test results when the method is applied repeatedly to multiple sampling of a homogeneous solution. For system precision, the carbon tetrachloride standard solution was injected six times (Table V). To determine the method precision, the drug substance was injected six times and calculated. The sample contained no carbon tetrachloride, and then was spiked with the carbon tetrachloride solution at 100% level and the %RSD was observed to be 17.8%.
Flunixin meglumine was weighed accurately at about 5.0 g in six separate headspace vials, and each vial was spiked with 4.067 ppm of carbon tetrachloride standard solution and then injected. Next, the %RSD was recorded for method precision study at the 100% level and was estimated to be 17.8% (Table V).
Linearity
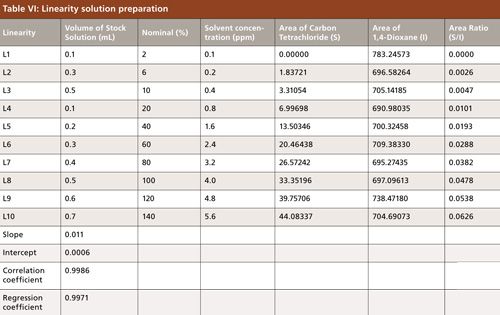
The linearity of an analytical method is its ability to elicit test results that are directly, or by a well-defined mathematical transformation, proportional to the concentration of analyte in samples within a given range. The linearity solution was prepared as shown in Table VI; for the calibration curve, the correlation coefficient and regression coefficient (R2) both are >0.995, and for the specified concentration (100%) results from six replicates, a %RSD < 20.0 was obtained (Figure 7). A sample of carbon tetrachloride was weighed accurately at about 50.2 mg and diluted to 40.1 ppm. From this solution, further stock solution dilutions were made at various concentration levels (Table VI).
LOD and LOQ
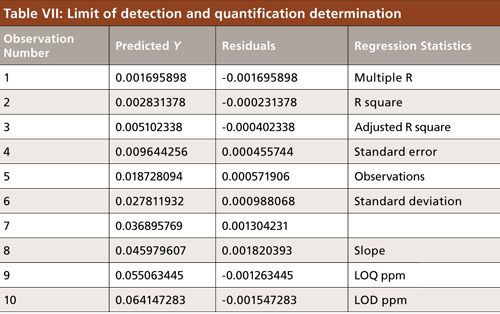
The LOD is the lowest amount of analyte in a sample that can be detected. The LOQ is the lowest amount of analyte in a sample that can be quantitated with acceptable accuracy and precision. The LOD was calculated from the linearity curve and was based on the standard deviation of the response and the slope method LOD and LOQ achieved (Table VII). The detection level was determined based on standard deviation of the blank and the slope of the calibration curve as defined in the ICH guideline.
LOQ Precision and Accuracy
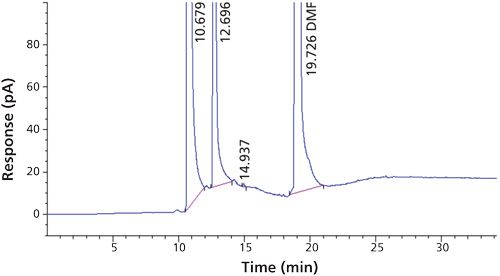
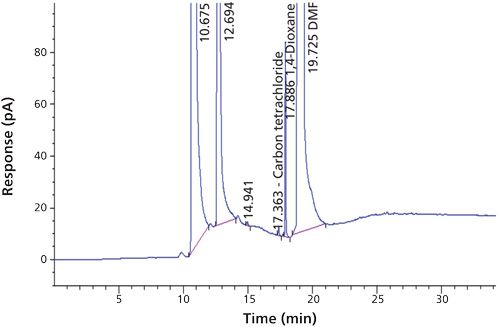
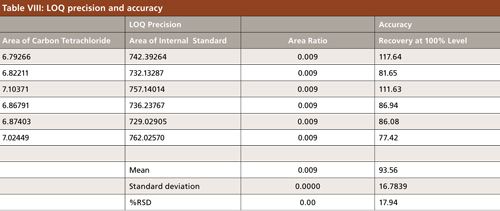
The accuracy of an analytical method is the closeness of test results obtained by the method to the true value. The drug substance was analyzed as per the proposed method. The sample of flunixin meglumine was spiked with a specific limit (100% level) of carbon tetrachloride solution and injected in six replicates (Figures 8 and 9). The recovery of carbon tetrachloride was calculated from the spiked flunixin meglumine sample area. The LOQ (0.4 ppm) solution was injected in six replicates for LOQ precision (Table VIII).
Conclusion
This article describes a specific and accurate estimation with critical validation parameters for a method for determining trace levels of carbon tetrachloride. A nonpolar capillary (coating material 100% dimethylpolysiloxane) and optimized headspace conditions were used to determine low levels of carbon tetrachloride in the sample. It was also observed that the introduction of the 1,4-dioxane as an internal standard response modifier in the solution reduced the %RSD without altering the selectivity. We intend to apply the method to other drug substances in the future.
Acknowledgments
The authors wish to acknowledge Sequent Research Limited for analytical support.
References
(1) United States Pharmacopeia 34 -National Formulary 29 (United States Pharmacopeial Convention, Rockville, MD, 2011).
(2) International Conference on Harmonization, ICH Q3C (R5): Guideline for Residual solvents (ICH, Geneva, Switzerland, 1997).
(3) B. Patrian, T. Poiger, and M.D. Müller, Agroscope Changins -Wädenswil Research Station ACW, CH-8820 Wädenswil. Carbon Tetrachloride in Folpet Formulations by Headspace GC–MS.
(4) K. Fliszar, J.M. Wiggins, C.M. Pignoli, G.P. Martin, and Z. Li, J. Chromatogr. A1027, 83–91 (2004).
(5) N.Ameri, C. Parsons, and S. Hashemi, “Quantitative Determination of Residual Carbon Tetrachloride in a Drug Product by GC-ECD,” presented at the AAPS Annual Scientific Meetings & Exposition, Irvine, California.
(6) A.R. Raghani, J. Pharm. Biomed. Anal. 29, 505 (2002).
(7) Z. Li, Y.H. Han, and G.P. Martin, J. Pharm. Biomed. Anal.28, 673 (2002)
(8) C.C. Camarasu, Chromatographia56, (Suppl.), S137 (2002).
(9) T.K. Natishan and Y. Wu, J. Chromatogr. A800, 275 (1998).
(10) K.J. Dennis, P.A. Josephs, and J. Dokladalva, Pharmacopeial Forum18, 2964 (1992).
(11) B. Koilb and L.S. Ettre, Static Headspace Chromatography, Theory and Practice, 2nd Edition (John Wiley & Sons, Hoboken, New Jersey, 2006), pp. 4–6.
(12) C. Roberson, Anal. Chem. 50, 2145–2146 (1978).
(13) International Conference on Harmonization, ICH Q2B (R1): Guideline Validation of Analytical Procedure Text and Methodology (ICH, Geneva, Switzerland, 1997).
S. Natarajan is in research and development at Bharathiar University in Coimbatore, India.
B.K. Kempegowda is with Maharani’s science college for women in Mysuru, India. Direct correspondence to: sv.natarajan@yahoo.com

Determining the Link Between Prenatal Cannabis Use and Symptoms of Depression Using LC–MS/MS
April 16th 2025Researchers investigating the relationship between cannabis use during pregnancy and depressive symptoms—and whether continued use beyond the first trimester or higher levels of use were linked to increased symptoms—used liquid chromatography–tandem mass spectrometry (LC–MS/MS) to confirm the presence of 11-nor-9-carboxy-delta-9-tetrahydrocannabinol (THC-COOH) in urine samples.
Common Challenges in Nitrosamine Analysis: An LCGC International Peer Exchange
April 15th 2025A recent roundtable discussion featuring Aloka Srinivasan of Raaha, Mayank Bhanti of the United States Pharmacopeia (USP), and Amber Burch of Purisys discussed the challenges surrounding nitrosamine analysis in pharmaceuticals.
Identifying PFAS in Alligator Plasma with LC–IMS-HRMS
April 15th 2025A combination of liquid chromatography ion mobility spectrometry, and high-resolution mass spectrometry (LC–IMS-HRMS) for non-targeted analysis (NTA) was used to detect and identify per- and polyfluoroalkyl substances (PFAS) in alligator plasma.


