Sensitive, Rapid Estimation of Moxidectin in Cattle Hair by LC–MS-MS
Special Issues
Validation of this rapid bioanalytical method for the determination of moxidectin in cattle hair demonstrated that the method is accurate, reliable, and reproducible.
Moxidectin formulations help reduce hair loss and irritation because of parasite worms in animals. The estimation of moxidectin in hair is important to evaluate therapeutic levels, distribution, and accumulation. The estimation is also useful to evaluate harm to birds when they eat animal hair. Hence, moxidectin estimation is required for pharmacokinetic as well as environmental exposure studies. The objective of the present work is to develop a rapid, selective method for the estimation of moxidectin in cattle hair by liquid chromatography–tandem mass spectrometry (LC–MS-MS).
Moxidectin is a semisynthetic derivative of nemadectin which is produced by fermentation of Streptomyces cyano-griseus. The molecular formula for moxidectin is C37H53NO8 and its molecular weight is 639.819 g/mol. The chemical structure of moxidectin is presented is Figure 1. Moxidectin is an anthelmintic drug that kills parasitic worms (helminths), and is used for the prevention and control of heartworm and intestinal worms. It can be found in treatments prescribed for animals such as dogs, cats, horses, cattle, and sheep. Application methods for moxidectin vary by treatment, and include oral, topical, and injectable solutions (1). Moxidectin is also used in products to treat horses for large and small strongyles, encysted cyathostomes, ascarids, pinworms, hair worms, largemouth stomach worms, and horse stomach bots (2). Moxidectin is not expected to have an adverse effect on hair-eating birds. In one day, hair-eating birds would have to consume many times their weight in cattle hair with moxidectin residues to be exposed to potentially toxic levels of moxidectin (3). Moxidectin 10% long-acting formulations are injected subcutaneously, at a concentration of 0.5 mL/50 kg body weight. Moxidectin is absorbed following subcutaneous injection with maximum blood concentrations being achieved 24–48 h post injection. The drug is distributed throughout the body tissues including hair, but because of its lipophilicity it is concentrated mainly in the fat. Moxidectin undergoes limited biotransformation by hydroxylation in the body. The only significant route of excretion is via the feces.
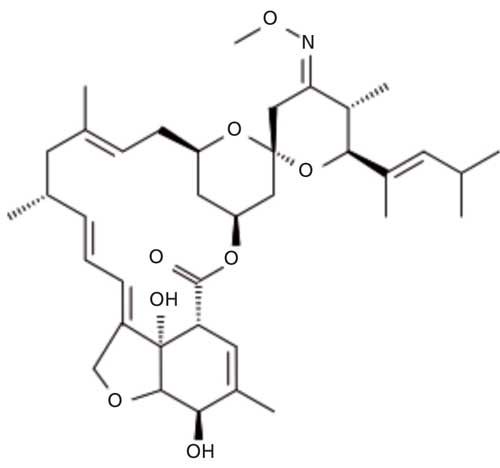
Figure 1: Moxidectin chemical structure.
Moxidectin formulations help to reduce hair loss and irritation because of parasite worms in animals. So the estimation of moxidectin in hair is important to evaluate therapeutic levels, distribution, and accumulation. The estimation is also useful to evaluate harm to birds when they eat animal hair. Hence, moxidectin estimation is required for pharmacokinetic as well as environmental exposure studies.
Moxidectin is used extensively for animals to treat parasitic worms, and many manufacturers are creating moxidectin formulations. Formulators should evaluate the pharmacokinetic properties of moxidectin in plasma as their primary objective and the distribution and accumulation of moxidectin in body tissues including hair as a secondary objective. The primary objective, evaluation of the pharmacokinetic properties, will provide the bioavailability of the formulation whereas the secondary objective will explain how the drug is distributed and its accumulation status.
Many methods are available for the determination of moxidectin in plasma (4–8). These methods seem so simple because the industry has hands-on-experience for the determination of drugs in plasma by liquid chromatography–tandem mass spectrometry (LC–MS-MS) and the methods do not require special reagents, in general. Hair analysis, on the other hand, is not a primary focus except in forensics or environmental studies in which analysts use traditional instrumentation such as ultraviolet (UV) spectroscopy, colorimetry, and gas chromatography (GC). Method development for hair analysis involves many challenges, including endogenous interferences, high matrix effects, complex processing steps like hair weighting, hair cutting to micrometer-size pieces, digestion with special reagents, incubation, selection of extraction solvents, as well as preparation of calibrators and controls. The work described in this article is the first ever bioanalytical method for the determination of moxidectin in cattle hair. The first challenge in this work is the selection of a matrix for the preparation of calibration curve standards and quality control samples; because direct hair cannot be used as the matrix, one should opt for surrogate procedures. Therefore, required equivalent spiking solutions were added to preweighed blank hair, then methanol was added for sonication, followed by evaporation to dryness. The second challenge was the selection of a buffer concentration and volume for the digestion of the hair samples; extensive work was conducted to optimize Sorenson’s buffer concentration and the volume per sample used. The third challenge was the selection of the temperature for incubation, and the last challenge was the selection of an extraction solvent. The incubator time and temperature were optimized for greater recovery and the extraction solvent was optimized to reduce interferences without losing recovery.
We successfully achieved our target method by overcoming all challenges one by one. In the current study, we report a method for the estimation of moxidectin in hair by LC–MS-MS which is selective and rapid. This method facilitates fast analysis. The method can be applied to hair analysis for the evaluation of moxidectin concentration levels in hair.
Experimental
Material
Working standards were obtained from VerGo Pharma Research Labs. Purified water was from taken from an in-house Milli-Q gradient water purification system (EMD Millipore). Methanol, methyl tert-butyl ether (MTBE), ammonium formate, dibasic sodium phosphate, and monobasic potassium phosphate were purchased from Rankem. Blank cattle matrix was supplied by RLS.
Stock Solutions, Calibration Curve Solutions, and Quality Control Spiking Solutions
Two 1-mg/mL stock solutions for moxidectin and one for oxcarbazepine were prepared by accurately weighting working standards on a microbalance. The standards were dissolved in methanol and stored at refrigerator maintained at 2–8 °C. A solution of 80% methanol in water was used as further diluent. Calibration curve standard spiking solutions were prepared in the range of 2.560–107.145 ng/mL using diluent along with four quality control levels at the lower limit of quantification quality control (LLOQQC), lower quality control (LQC), middle quality control (MQC), and high quality control (HQC). Spiking solutions were stored in a refrigerator for long-term storage.
Preparation of Final Standards
The screened blank cattle hair was weighed and spiked with the required spiking solution prepared in diluent. The spiking was performed in weighted blank hair to get final calibration curve standard concentrations of 0.026 to 1.071 ng/mg, LLOQQC of 0.028 ng/mg, LQC of 0.076 ng/mg, MQC of 0.444 ng/mg, and HQC of 0.766 ng/mg. Then 0.250 mL of methanol was added for proper vortexing of the content. The content was vortexed for 5.0 min and sonicated for 5 min, centrifuged at 4000 rpm for 10 min at 5.00 °C, and evaporated for approximately 20 min at 40.0 °C until dryness. Dried samples were stored at -70 °C until analysis.
Sample Processing
The sample processing steps are described in Table I.
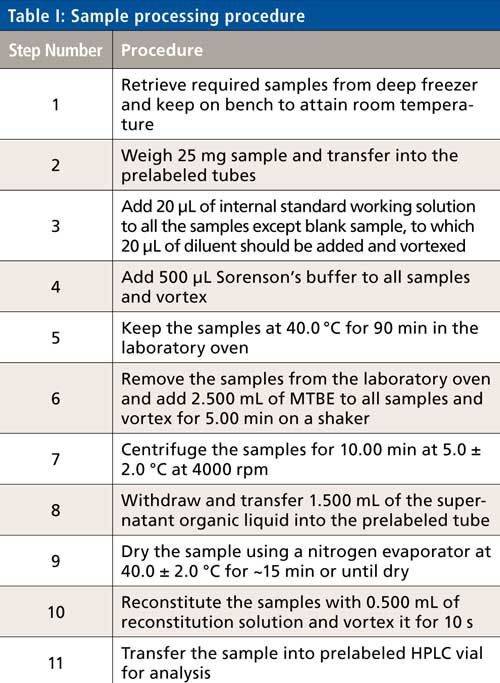
LC–MS Conditions
The LC conditions are described in Table II. A gradient chart is presented in Figure 2. The mass spectrometer conditions are described in Table III.
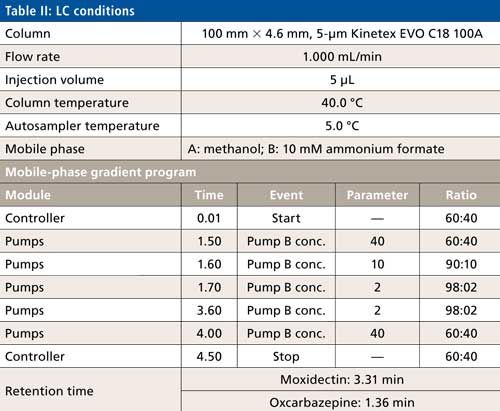

Figure 2: Gradient chart.

Results and Discussion
Selectivity of the Method
The selectivity of the method was evaluated using six hair blanks of individual cattle. Blank and LLOQ were processed from each hair lot. Interferences at analyte and internal standard retention times were compared with that of respective LLOQs. No significant endogenous interferences were observed at the retention times of either the analyte or internal standard. Interference is acceptable up to 20% of LLOQ area for analytes and 5% for the internal standard. Blank sample and LLOQ sample chromatograms are presented in Figures 3 and 4.
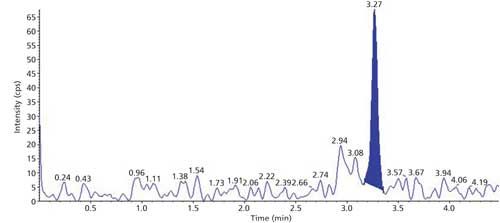
Figure 3: Sample chromatogram of blank.
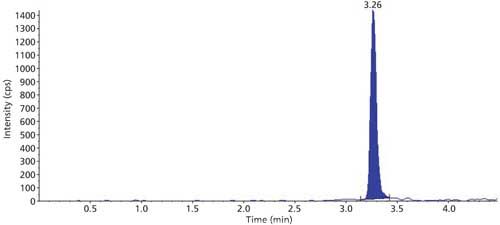
Figure 4: Sample chromatogram of LLOQ.
Internal Standard Normalized Matrix Factor
The internal standard matrix factor was evaluated for the method by calculating the ratio of analyte and internal standard response at LQC and HQC levels. The internal standard normalized matrix factor was found between 0.85 to 1.15 and %CV for the internal standard matrix factor was 5.4 at LQC and 6.7 at HQC levels. Six post-extraction blank samples for each LQC and HQC were spiked with respective QC level spiking solution (mixture of analyte and internal standard); these samples were analyzed along with equivalent aqueous samples. The experiment is considered acceptable when the %CV for the internal standard normalized matrix factor is less than 15%.
Linearity
The linearity of the calibration curve was evaluated using three calibration curve sets (eight standards) on two different days. Automatic integrations were conducted on Analyst 1.6.2 software for linear regression using 1/x2 weighting factor; back calculations were done using the formula in equation 1:

where x is an unknown sample concentration, y is the area ratio of analyte versus the internal standard, m is the slope of the curve, and c is the intercept of the curve. The correlation coefficient, r2, was calculated for each curve and found more than 0.98 regression value each time. A sample calibration curve is presented in Figure 5.
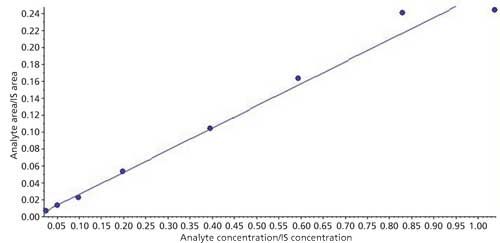
Figure 5: Sample calibration curve.
Precision and Accuracy
Intra- and interday precision and accuracy were evaluated using four levels (LLOQ, LQC, MQC, and HQC) of quality control samples covering the calibration curve range. The six replicates of each QC level sample were processed under a fresh calibration curve. Ruggedness of the method was tested for analyst and analytical column change. Interday precision ranged from 0.9% to 11.7% whereas interday accuracy found to be between 90.7% to 105.5%. Calibration curve standard or quality control samples are acceptable when the %nominal is within ±15% to the nominal concentration except LLOQ where it is ±20%. Precision is accepted when the %CV is less than 15% for all standards and samples except LLOQ where it is ±20%. A calibration curve is accepted when 75% of a standard meeting the acceptance criteria including LLOQ and ULOQ, no two consecutive standards are excluded, and r2 is greater than 0.98.

Stability of Analyte
The six LQC and six HQC samples are subjected to different storage and processing conditions including three freeze-thaw cycles for hair samples, 6 h at ambient temperature for hair samples, 1 h at 40 °C for processed samples, 2 h at ambient temperature for processed samples, and 24 h at 5 °C for reconstituted samples. Samples were processed and analyzed under a newly prepared calibration curve prepared from freshly prepared stock solution. Back-calculated quality control values were used to calculate %nominal for each level and were found to be within acceptable limits. Stability will be acceptable when the %nominal is found to be ±15% to the nominal concentrations.
Conclusion
A rapid, selective method for the estimation of moxidectin in cattle hair by LC–MS-MS using oxcarbazepine as an internal standard has been developed and validated. Hair samples were subjected to liquid-liquid extraction using Sorenson’s buffer followed by MTBE. Multiple reaction monitoring (MRM) detection in positive mode at unit resolution was opted and separation was achieved on a C18 column with a methanol–10 mM ammonium formate mobile-phase gradient. The calibration curve for the range 0.026–1.000 ng/mg was linear with regression greater than 0.98. The method was selective for analytes and internal standards from any endogenous interferences. The matrix factor was found to be between 0.85 and 1.15 for all tested blank lots. Other validation parameters revealed that the method is reliable, reproducible, and accurate. Stability evaluation proved that moxidectin is stable for different storage and processing conditions. The method was applied to estimate moxidectin in six cattle hair samples.
References
- https://en.wikipedia.org/wiki/Moxidectin, accessed on April 19, 2016.
- Moxidectin question and answers for pet owners by Bayer health care posted on www.Moxidectinfacts.com, accessed on April 19, 2016.
- Environmental assessment - Cydectin Moxidectin 0.5% pour-on for cattle, June 1997, Z154314.
- J. Dupuy, J.F. Sutra, and M. Alvineirie, Veterinary Parasitology147(3–4), 252–257 (2007). DOI: 10.1016/j.vetpar.2007.05.002.
- M. Alvinerie, J.F. Sutra, M. Badri, and P. Galtier, J. Chromatogr B Biomed. Appl. 674(1), 119–124 (1995).
- M. Alvinerie, E. Escudero, J.F. Sutra, C. Eeckhoutte, and P. Galtier, Vet. Res.29(2), 113–118 (1998).
- D.C. Hughes, K. Fraser, C.M. Miller, and D.M. Leathwick, Proceedings of the New Zealand Society of Animal Production73, 180–182 (2013).
- Determination of Ivermectin, Doramectin, and Moxidectin by HPLC, United States Department of Agriculture, http://www.fsis.usda.gov/wps/wcm/connect/87680e50-d76b-407b-9d94-d2ecc37b3cd0/CLG_AVR_04.pdf?MOD=AJPERES.
- A. Lifschitz, G. Virkel, F. Imperiale, J.F. Sutra, P. Galtier, C. Lanusse, and M. Alvinerie, J. Vet. Pharmacol. Ther.22(4), 266–273 (1999).
- J. Sallovitz, A. Lifschitz, F. Imperiale, A. Pis, G. Virkel and C. Lanusse, The Veterinary Journal164, 47–53 (2002).
P. Sambasivarao, Raman Batheja, N. Subbarao, S. Ashma, K. Ashwini, and M. Mupeksha are with the bioanalytical department at VerGo Clinicals in Corlim, India. Direct correspondence to: samba.sivarao@vergopharma.com

New Study Reviews Chromatography Methods for Flavonoid Analysis
April 21st 2025Flavonoids are widely used metabolites that carry out various functions in different industries, such as food and cosmetics. Detecting, separating, and quantifying them in fruit species can be a complicated process.
University of Rouen-Normandy Scientists Explore Eco-Friendly Sampling Approach for GC-HRMS
April 17th 2025Root exudates—substances secreted by living plant roots—are challenging to sample, as they are typically extracted using artificial devices and can vary widely in both quantity and composition across plant species.
Common Challenges in Nitrosamine Analysis: An LCGC International Peer Exchange
April 15th 2025A recent roundtable discussion featuring Aloka Srinivasan of Raaha, Mayank Bhanti of the United States Pharmacopeia (USP), and Amber Burch of Purisys discussed the challenges surrounding nitrosamine analysis in pharmaceuticals.


