Screening and Characterizing Colloidal Interactions for Optimal Biotherapeutic Formulations
Colloidal interactions arising from surface-exposed moieties on therapeutic proteins, monoclonal antibodies, antibody–drug conjugates, and other biopharmaceuticals lie at the heart of drug product stability. Therefore, it is not surprising that much effort has been devoted to finding effective means to characterize these interactions and to rapidly screen drug candidates and formulations for optimal colloidal properties. The most common techniques for performing these analyses are based on analytical light scattering, in its two primary flavours: static light scattering (SLS) and dynamic light scattering (DLS). Recent advances in light scattering instrumentation, analytical methods, and algorithms provide developers of biologics with powerful tools to perform these studies.
Photo Credit: VikaSuh/Shutterstock.com

Daniel Some, Wyatt Technology Corp., Santa Barbara, California, USA
Colloidal interactions arising from surface-exposed moieties on therapeutic proteins, monoclonal antibodies, antibody–drug conjugates, and other biopharmaceuticals lie at the heart of drug product stability. Therefore, it is not surprising that much effort has been devoted to finding effective means to characterize these interactions and to rapidly screen drug candidates and formulations for optimal colloidal properties. The most common techniques for performing these analyses are based on analytical light scattering, in its two primary flavours: static light scattering (SLS) and dynamic light scattering (DLS). Recent advances in light scattering instrumentation, analytical methods, and algorithms provide developers of biologics with powerful tools to perform these studies.
Binding screens are commonly performed in the discovery stage to ensure that candidate molecules interact functionally with their target, but these are not sufficient to ensure a viable drug product. In addition to being efficacious, the final product must be stable and robust, suitable for the desired mode of delivery, and possessing appropriate critical quality attributes (CQAs). The earlier these additional properties can be confirmed, the faster the route to market and the less time, effort, and funds are spent pursuing developmental dead ends.
Light scattering addresses these needs in several formats:
- Low-volume multi-angle light scattering coupled to ultrahighâperformance sizeâexclusion chromatography (UHPâSECâMALS) for characterization of monomers, fragments, and aggregates to determine absolute molar mass, size, and degree of glycosylation or conjugation to PEG or polysaccharide (1). Only a few micrograms of material are needed so this technique is suitable for the earliest stages. The high resolution of UHP-SEC-MALS compared with standard HP-SEC-MALS means that it is preferable for use in late stages as well;
- Low-volume, high-throughput dynamic and static light scattering (HT-DLS/SLS) in 384 or 1536-microwell plates (2) to screen multiple candidate and formulation buffers for aggregation, colloidal stability, and thermal stability;
- Moderate-volume, high-throughput DLS/SLS in 96-well plates that permit sampling of material to other techniques, such as microflow imaging or SEC;
- Composition-gradient multi-angle light scattering (CG-MALS) to characterize a variety of colloidal interactions, such as protein–excipient interactions, interactions between co-solutes such as antigens in a multi-valent vaccine or monoclonal antibodies (mAbs) in a cocktail, and high concentration protein–protein interactions typical of late-stage formulations for subcutaneous or ocular delivery (3).
Here we will focus on the latter three types of measurements and in particular on the measurement of colloidal stability in early and late stages.
Who Needs Colloidal Stability?
Multiple pathways are believed to lead to aggregation, typically including some form of partial denaturation, reversible nucleation, condensation into irreversible small aggregates, and continued growth to form large aggregates. Regardless of the specific mechanism and pathway, there is no getting around the fact that in order to aggregate, two or more monomers must approach each other to within less than one nanometer. When attractive intermolecular forces dominate repulsive forces, the probability of this close approach becomes high and short-range processes that lead to covalent or non-covalent binding can take place. On the other hand, if repulsive forces dominate, the probability of close approach becomes low and binding cannot occur. Analysis of colloidal stability quantifies the degree of attraction or repulsion in order to evaluate molecules in formulation buffers and help predict shelf life and long-term stability.
One of the key benefits of colloidal stability measurements using light scattering is the ability to perform the analysis under conditions identical to those of the final product: the molecules are in solution, in the precisely desired formulation buffers and storage temperature. By contrast, conformational stability analyses are performed either via thermal denaturation, and therefore at elevated temperatures relative to storage conditions, or via chemical denaturation, and therefore not in actual formulation buffer. Other types of analyses may immobilize the molecule on a surface, again not truly representing the final product. Light scattering measurements meet the need for truly representative conditions.
Light scattering offers another benefit: the ability to characterize material at the high concentrations typical of mAbs formulated for subcutaneous or ocular injection, often above 50–100 mg/mL. High-concentration protein–protein interactions determined by CG-MALS not only help to predict long-term stability, but are also useful in understanding the causes behind high solution viscosity that adversely impacts injectability.
HT-DLS/SLS: Orthogonal Screens
SLS, A2: A primary thermodynamic measure of colloidal stability is the second virial coefficient, A2 or B22, which describes the net effect of two-body molecular interactions as mediated by the solvent. These include excluded-volume repulsion, charge–charge repulsion, and attraction from inhomogeneous charge distributions, hydrophobic patches, dipoles, salt bridges, and other moieties on the molecule’s surface. When the only interaction present is a result of volume exclusion (the inability of two bodies to occupy the same space), the molecule is neither stable nor unstable and the value of A2 is simply A2exc = 4V/M2 where V is the molecular hydrodynamic volume and M the molar mass. Additional repulsion increases the value of A2 while additional attraction reduces the value relative to this baseline, becoming negative for sufficiently strong net attraction.
SLS quantifies A2 through the concentration dependence of the scattered light. At relatively dilute concentrations (in the range of 1–10 mg/mL for proteins in most buffers) the net effect of these interactions is described by a first-order approximation:
R = K* Mc⁄(1 + 2A2Mc) = K* M* c [1]
where R is the reduced Rayleigh ratio (a measure of the light scattering intensity), K* a constant related to the system’s optical properties, c the solute concentration in mass per unit volume, and M* = M/(1 + 2A2Mc) the effective molar mass. At higher concentrations, additional virial coefficients must be included as coefficients of powers of c (the denominator becomes 1 + 2A2Mc + 3A3Mc2+…) and the analysis is more complex than in the lower concentration range.
Traditionally the determination of A2 by SLS has required either copious amounts of protein (tens of mg per experiment), or inconvenient, labour-intensive measurement in microcuvettes. By using a microplate reader that performs both DLS and SLS, A2 measurements can be fully automated with small quantities of sample-as little as 4 µL per concentration in a 1536-well plate, for a total of 220 µg in a series covering 1, 2, 3, up to 10 mg/mL.
Figure 1 shows a 384-well plate heat map of the M* values measured for two mAbs, each in six formulations under a series of 10 concentrations with two replicates each. The lower part of the figure presents the plots of M* versus c used to determine A2 for each combination of mAb or formulation, indicating different degrees of repulsion for each buffer and mAb. The entire analysis took about 1 h and was fully automated. With high-throughput SLS, it is feasible to screen hundreds of candidate or formulation combinations each day for colloidal stability, for a comprehensive study of optimal, product-worthy molecules and conditions.
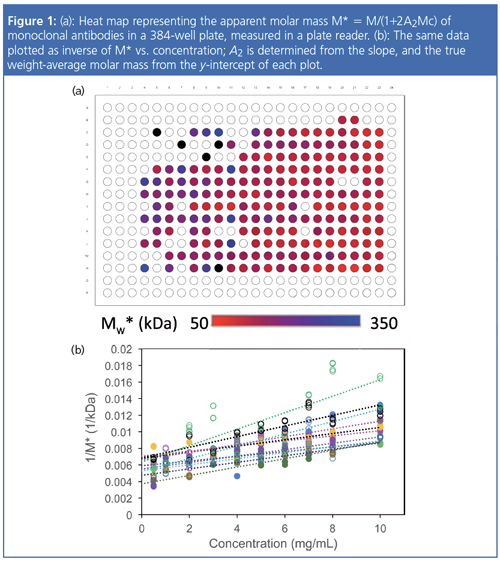
DLS, kD: Prior to the launch of the DLS/SLS plate reader, SLS was not available in a plate reader format but DLS was, so a screening tool for colloidal stability based on DLS was sought. There is another firstâorder interaction quantifier, comparable to A2, that can be performed by DLS in microwell plates: kD. Just as A2 is the first concentration coefficient of SLS, the diffusion interaction parameter kD is the first concentration coefficient of DLS: D = D0(1 + kDc) where D is the diffusion coefficient measured by DLS and D0 is the value of D in the limit of infinite dilution. Alternatively, the results may be presented as Rh* = Rh/(1 + kDc) where Rh is the true hydrodynamic radius and Rh* the apparent hydrodynamic radius. At higher concentrations, additional terms (coefficients of c2, c3) are needed to fully describe the interactions.
Simple theoretical considerations relate kD to A2 by kD = 2A2M-ν-ζ1 where ν is the specific molecular volume and ζ1 the first concentration coefficient of friction (4). A more detailed analysis shows that, in close approximation, the relationship for mAbs is actually kD = A2M-6.3 g/mL (5), in excellent agreement with empirical results (6). Hence, at least for mAbs, the low-volume, highâthroughput DLS measurement of kD is a reasonable proxy for SLS measurements of A2. As it is measured by a different optical technique, kD analysis by DLS is orthogonal to A2 by SLS.
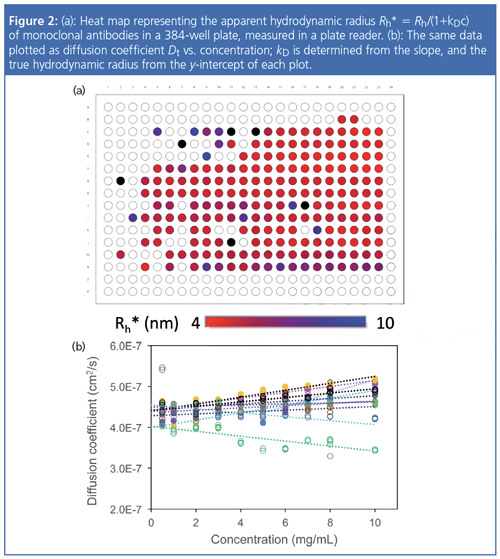
Figure 2 shows a plate heat map of the Rh* values measured for the same conditions as Figure 1 and the plots of D versus c used in the determination of kD. Most of the buffers exhibited positive (repulsive) colloidal interactions, though one did have a negative kD value indicative of attractive interactions. The samples were actually measured simultaneously by SLS and DLS, producing orthogonal measures of colloidal stability in a single run.
CG-MALS, Please Concentrate: Static light scattering is one of very few techniques appropriate for use with highly concentrated proteins. DLS is inappropriate because the interplay of thermodynamic and hydrodynamic effects makes the diffusion coefficients not amenable to interpretation. Analysis of concentrated proteins with CGâMALS (3) goes beyond simple first-order, or even second-order, virial coefficients, and because it utilizes a MALS detector with a high-quality flow cell, it provides light scattering data quality exceeding that of a plate reader. The obverse side of that coin is the need for sample quantities that may not be available in early stages of development. Hence CG-MALS is appropriate for inâdepth characterization of colloidal stability in late-stage formulations, and for analysis of interactions more complex than those that are typically described by second virial coefficients.
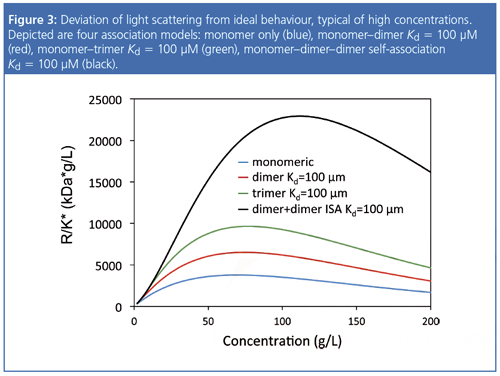
As concentrations increase above 10–20 mg/mL, various weak, attractive interactions that are not apparent at lower concentrations may dominate protein behaviour. Figure 3 presents the effect of the interplay of simultaneous attractive and repulsive interactions on SLS data for several interaction models. The effect on concentration-dependent light scattering is not described well by mathematics, which simplistically assumes a monomer with virial coefficient adjustments. Rather, it is best to treat the system as one that associates reversibly to form oligomers or small clusters, while still subject to intermolecular repulsion because of the excludedâvolume effect (7). The outcome of such an analysis provides i) the most appropriate association model (for example, monomer–dimer association, monomer–dimer–hexamer association, or even indefinite selfâassociation of monomers, dimers, trimers, etc.); ii) equilibrium dissociation constants Kd for each complex that forms; and iii) an effective virial coefficient that, in this analysis, is used to quantify only the repulsive interactions.
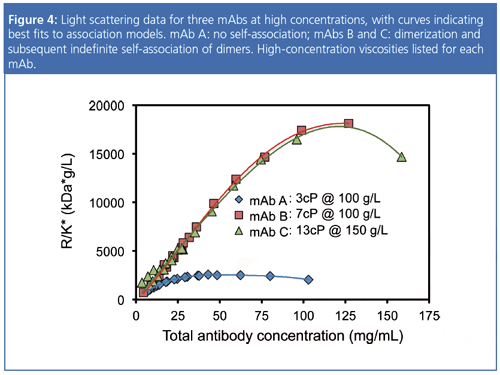
An example of CG-MALS analysis for three mAbs at concentrations up to 150 mg/mL is shown in Figure 4. MAb A exhibits no selfâassociation; the data are best fit by a model including only net repulsion, of a degree greater than the purely excludedâvolume repulsion, suggesting additional electrostatic repulsion. Monoclonal antibodies B and C exhibit weak dimerization (Kd ~ 300–400 µM) accompanied by progressive or indefinite self-association of dimers (Kd ~ 130–180 µM) in addition to a repulsive term of the magnitude expected for excludedâvolume interactions alone. These reversible protein–protein associations correlate well to viscosity values listed in the legend of Figure 4, indicating that the colloidal interactions are responsible for the viscous behaviour as well as long-term aggregation.
Experimental
Plate-based SLS and DLS measurements were performed in the DynaPro Plate Reader III (Wyatt Technology) with Greiner glassâbottom 384-well plates. Samples were capped with oil or the plate was sealed using Nunc sealing tape (Thermo Scientific). Data were collected and analyzed with Dynamics 7.7 software (Wyatt Technology). Samples were kindly provided by Amgen.
CG-MALS measurements were performed using the Calypso II compositionâgradient system connected to a DAWN HELEOS II MALS detector and Optilab T-rEX High Concentration differential refractometer, and the data acquired and analyzed with Calypso 2.1 software (all from Wyatt Technology). Several of the highestâconcentration samples were too viscous to pump through the detectors and so were measured in the MALS detector in microcuvettes. Samples were kindly provided by MedImmune LLC.
Conclusions
Whether in low-volume, high-throughput screening mode or low-throughput, in-depth characterization mode, light scattering plays a key role in the development of stable and well-formulated biotherapeutics. Analysis of colloidal stability by DLS and SLS in the screening stage is beneficial to predict longâterm stability and eliminate candidates or formulations with poor stability prognoses, while in stages of advanced development CG-MALS affords rare insight into reversible associations responsible for viscosity as well as aggregation.
References
- D. Some, The Column12(21), 2–7 (2016).
- D. Some, The Column13(9), 22–27 (2017).
- D. Some and S. Kenrick (2012), in Protein Interactions, J. Cai, Ed. (InTech, 2012), pp. 401–426.
- I. Teraoka, Polymer Solutions: An Introduction to Physical Properties (John Wiley & Sons, New York, NY, USA, 2002).
- D. Roberts et al., Mol. Pharm.11, 2475−2489 (2014).
- T. Menzen and W. Friess, J. Pharm. Sci.103, 445–455 (2014).
- D. Some, J. Pollastrini, and S. Cao, J. Pharm. Sci. 105(8), 2310–2318 (2016).
Daniel Some is Principal Scientist at Wyatt Technology Corporation, where he has spent the last 13 years in various roles including R&D, software development, product management, and marketing. Some was previously involved in the development of lightâscattering-based patterned wafer inspection tools for the semiconductor industry.
E-mail:dsome@wyatt.comWebsite: www.wyatt.com

Polysorbate Quantification and Degradation Analysis via LC and Charged Aerosol Detection
April 9th 2025Scientists from ThermoFisher Scientific published a review article in the Journal of Chromatography A that provided an overview of HPLC analysis using charged aerosol detection can help with polysorbate quantification.
Removing Double-Stranded RNA Impurities Using Chromatography
April 8th 2025Researchers from Agency for Science, Technology and Research in Singapore recently published a review article exploring how chromatography can be used to remove double-stranded RNA impurities during mRNA therapeutics production.


