Screening Acid-Base Constants by Capillary Electrophoresis
LCGC Europe
The acid-base constants of the most frequently used antianginals (diltiazem, nadolol, propranolol and verapamil) were determined using capillary zone electrophoresis (CZE). This method is based on measuring the electrophoretic mobility of the solute as a function of pH. The buffer employed was composed of borate-phosphate buffered across the pH range of 3.0–11.2. The acid-base constants were determined by performing linear and non-linear regression on the data obtained. The results were compared with those reported in literature and with those obtained by a spectrophotometric method. After comparison of the values, no significant differences were observed between the three acid-base constants.
The acid-base constants of the most frequently used antianginals (diltiazem, nadolol, propranolol and verapamil) were determined using capillary zone electrophoresis (CZE). This method is based on measuring the electrophoretic mobility of the solute as a function of pH. The buffer employed was composed of borate-phosphate buffered across the pH range of 3.0–11.2. The acid-base constants were determined by performing linear and non-linear regression on the data obtained. The results were compared with those reported in literature and with those obtained by a spectrophotometric method. After comparison of the values, no significant differences were observed between the three acid-base constants.
The acid-base constant is a fundamental chemical property of weak acids and bases and is pivotal in the prediction of the migration order of solutes in capillary zone electrophoresis (CZE).1,2 It also plays a key role in understanding certain chemical phenomena such as biological uptake, biological activity, biological transport and the binding of these molecules to environmental matrices. Depending on the compounds, potentiometric,3 dual-phase potentiometric,4 spectrophotometric5–7 and spectral gradient analysis titrations8 are the most common methods for pKa measurements.
Recently, CZE was introduced as a method for the convenient and precise determination of aqueous acid-base constants.5–18 This method is based on the measurement of the electrophoretic mobility of the solute as a function of the pH buffer.
The experimental data or mobility curve are then adjusted to a mobility equation describing the solute migration behaviour pH range that is under consideration. Different modalities of CE were used, such as pressure-assisted capillary electrophoresis (PACE) with ultraviolet (UV) detection13 and mass spectrometry (MS),18 or non-aqueous capillary electrophoresis (NACE).19–21
Compared with other techniques, CZE requires only small amounts of sample at low solute concentration, therefore impurities do not disturb the measurements and it is not necessary to maintain the exact solute concentration, but migration times must be known.
Diltiazem, nadolol, propranolol and verapamil are antianginal agents.22,23 In this work, we show that the acid-base constants of these antianginals can be easily determined using the CZE technique with DAD detection to obtain mobilities and spectroscopic data. This paper describes different methodology approaches and compares the results obtained for antianginals and other compounds. Finally, the different techniques reported in the chemical literature are compared.
Methodology Approaches
Potentiometric titration: This is a useful technique for water-soluble pure compounds that can be titrated with an acid or base and monitored with a pH electrode. After titration, pKa is calculated from the change in the shape of the curve obtained. This method requires solutions that contain compounds at a 10-4 M concentration and each titration takes around 30 min.
Dual-phase potentiometric titration: This is appropriate for pure hydrophobic compounds and is based on a direct titration with the absence of octanol, followed by back titration with acid in the presence of octanol. The concentration and time requirements are similar to those in the potentiometric titration.
Spectrophotometric titration: This is useful for a wide range of compounds including those with impurities that do not interfere with the spectrophotometric or diode array measurements. It requires solutions with concentrations of less than 10–6 M, and similarly, the time that each titration lasts is around 30 min. After titration, the pKa value is calculated by applying the first derivative of the absorbance against the time plot which improves the accuracy of the pKa value obtained.
Spectral gradient analysis titration: This uses two buffers or more to obtain a pH linear gradient (pH 3–11). pKa values are determined when a diode array spectrum changes and when a constant flow of the sample is infused into the pH gradient. This is a rapid titration technique that is easily automated.
Capillary Electrophoresis Method
CE titration: This is useful for the pKa determination of compounds and is based on the measurements of the effective mobilities at different pH values. After titration, some mathematical treatments are applied to the mobility/pH data pairs to obtain the pKa.
CE instrumentation: In our laboratory, for CE pKa determination, runs of the compounds are performed with a Beckman P/ACE System MDQ (Beckman Instruments Inc., Fullerton, California, USA) equipped with a DAD. The polyimide coating of the capillary is partially removed by burning at the point of detection and the uncovered portion of the capillary is aligned on the 85 detector block.
A PC connected to the instrument through Beckman 32 karat software is used 86 for instrumental control and acquisition of chromatographic data. The electrophoretic runs were performed at 25 ± 0.2 °C.The fused silica capillaries (50 μm i.d., 375 μm o.d.) were from Polymicro Technologies (Phoenix, Arizona, USA). The length of the capillaries used was 40.2 cm. The capillary was conditioned initially by flushing 0.1 M NaOH for 15 min, followed by 15 min water and 15 min buffer.
Before every injection the capillary was rinsed with water for 2 min and another 3 min with electrolyte solution to ensure a consistent electroosmotic flow. All injections were performed in hydrodynamic mode (1 psi, 10 s). The capillary was operated at 20 kV and the detection wavelength was 214 nm. The UV spectra in the maxima of the electrophoretic peaks were monitored from 190–600 nm with an on-line DAD for analysis in the absorbance technique. Three replicate injections were performed for each antianginal agent and average electrophoretic mobilities were used in the calculation of acid-base constants.
Reagents and apparatus: Diltiazem, nadolol, propranolol, verapamil and acetone were from Sigma (St. Louis, Missouri, USA). Stock solutions containing 100 μg/mL of each compound were prepared in distilled water. The solutions were diluted to 10 μg/mL to obtain the electrophoretic data. Buffer solutions of 25 mM were prepared with phosphoric acid, sodium dihydrogenphosphate, disodium hydrogenphosphate, trisodium phosphate, boric acid and triethylamine (Sigma-Aldrich). Sodium hydroxide (99% purity, Merck, Darmstadt, Germany) was used to prepare the capillary. All solutions were filtered into the autosampler vials through 0.45 μm nylon membranes 12 mm in diameter. Measurements of pH were performed with a Crison GLP 22 (Barcelona, Spain), equipped with a combined Ag/AgCl/glass electrode. The sonification unit was from Selecta (Barcelona, Spain). Distilled-deionized water Milli-Q (Millipore, Billerica, Massachusetts, USA) was used throughout.
Mathematical Treatment of the CE Data
The acid-base constants (pKa) of diltiazem, nadolol, propranolol and verapamil in aqueous medium were reported in the literature22 and are shown in Table 4. The CE data can be mathematically treated to obtain the pKa values: by linear regression and non-linear regression, and, finally, the spectrophotometric data obtained with the DAD detector of the CE instrument can also be treated.
CE pKa determination using a linear regression: Standard solutions containing 10 μg/mL of each antianginal were injected in triplicate and monitored at a wavelength of
214 nm. Electroosmotic flow was determined from the migration time of acetone, which was considered to be neutral throughout the entire sequence of buffers used in the determination of pK values. Electrophoretic mobilities were calculated as the difference between the apparent mobility, tapp, of each antianginal and the mobility of the neutral marker, teof using Equation 1.

where Ld is the distance in cm from the injection point to the detector, Lt is the capillary length also in cm, V is the applied voltage in volts and tapp and teof are the migration time, expressed in seconds, of the analyte and the neutral marker, respectively. The antianginal agents (Figure 1) are basic compounds and their acid-base dissociation constant, Ka, is defined as:

where (H+ ), (BH+ ) and (B) are the activities of protons, protonated and neutral base, respectively, [BH+ ] and [B] are the concentrations of protonated and neutral forms and γBH+ is the activity coefficient of ionized species. The activity coefficient of the neutral species is assumed to be 1.
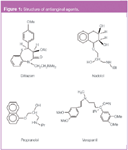
Figure 1
To study the influence of pH on the electrophoretic behaviour of substances, pH, acid-base constants and electrophoretic mobility, μe, could be related. The relationships are based on the principle that a solute has its maximum electrophoretic mobility when it is fully ionized (μe = μBH+), has no mobility in its neutral form and has an intermediate mobility in the pH region surrounding its acid-base constants (see Equation 3):

where (%BH+) and μBH+ are the molar fraction and the electrophoretic mobility of the fully protonated species, respectively.
Moreover, as:

then:

According to Equation 2:

Equation 5 can be rearranged to give:

Finally, replacing with Equation 6, Equation 7 becomes:

Activity coefficient, γBH+ was calculated from Davies's theory according to Equation 9:

where Z is the valence of the ion, I is the buffer ionic strength, α is the ion size parameter, generally assumed to be 5 Å, and C is the molarity of the ion.
CE pKa determination using a non-linear regression: The value of the acid-base constants was also determined by fitting a sigmoidal curve, represented by Equation 11, in a plot of electrophoretic mobility versus pH.

CE pKa determination using spectrophotometric data: The CZE–DAD method, similar to conventional spectrophotometry, is based on the neutral and ionic species having different spectra. Equation 11 can be rewritten by using the absorbances. Absorbance data were recorded and then processed using a non-linear fit on the basis of Equation 12:

where ABH+ and AB represent the absorbances of the protonized and deprotonized forms of the antianginals, respectively; and A is the absorbance at a certain pH of the buffer. Both ABH+ and AB are also determined by the regression.
Choice of Experimental Conditions
Choice of electroosmotic marker: Acetone, methanol and mesityl oxide, depending on the studied compounds, can be tested as electroosmotic flow (EOF) marker substances. The best results (high absorbance and symmetrical peaks) were obtained using acetone. In this instance the pH values and calculated teof are given for solutions containing 5% of acetone as marker (Table 1). The relative standard deviation (RSD) of teof was less than 1% in all conditions (acidic, neutral or alkaline).

Table 1: Electroosmotic mobility (μeof 10â5cm2Vâ1sâ1) as a function of electrolyte pH.
Choice of buffer pH range and concentration: To measure the acid-base constant values of the four antianginal agents, a mixture containing phosphate and borate buffer was chosen because a wide pH range, between 3.0 and 11.2, can be achieved. The determination of acid-base constants depends on the ionic strength of the background electrolytes. For this reason, the ionic strength must be constant throughout the buffer series. The stability of the ionic strength prevents changes in viscosity from occurring between the different pH buffers used, thus improving the stability of the electroosmotic mobilities. To keep the ionic strength constant, the contribution of NaOH or HCl to the ionic strength must be minimized, and different amounts of triethylamine were added to adjust the pH.
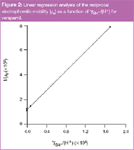
Figure 2
Contrarily, high concentrations of buffers may exceed the capillary thermostatting capability of the system, and diluted buffers reduce the effect of Joule heating. Dilute electrolyte solutions are desirable to reduce activity corrections, temperature gradients and differences in viscosity. However, it is important for solutions to have sufficient buffer capacity to maintain a fixed pH in the presence of the sample. Thus, a concentration of 25 mM was chosen. To verify the thermostatting capacity of the system the linearity of the plot of current versus voltage (from 5 to 25 kV) was tested at a different pH. In all instances Ohm's law is fulfilled and regression coefficients are greater than 0.998.

Table 2: Linear regression parameters.
CE pKa Determination of Antianginals
By linear regression: For precise determination of the values of acid-base constants, the linear regression analysis of the data according to Equation 8 was used. An example with verapamil is given in Figure 2. The correlation coefficient values, r, for the linear fit was greater than 0.999, except for diltiazem (0.964) and the linear regression parameters for all the compounds are given in Table 2. The electrophoretic mobilities (μBH+calc) calculated from Equation 8, such as the inverse of intercept, confirmed this linear analysis (Table 3). Indeed, the values obtained are not significantly different from the experimental electrophoretic mobilities (μBH+exp) determined from Equation 1 when injecting the samples at pH 3.0. The only exception was diltiazem, which is the antianginal that has the biggest difference, with an experimental mobility of 10.49 compared with the calculated value of 3.78. The values of the acid-base constants calculated from the slope (Ka) are given in Table 4.

Table 3: Electrophoretic mobilities (μBH+): experimental and as calculated by the two different methods.
By non-linear regression: Electrophoretic mobilities can also be plotted against pH activity of the buffer and non-linear regression analysis was then performed on the data. Figure 3 shows the best fits of the non-linear regression for diltiazem, nadolol, propranolol and verapamil. This figure also shows the electrophoretic mobility of the fully protonated species for each antianginal, μBH+. The lowest electrophoretic mobility is presented by verapamil, in accordance with its structure, the biggest of the four compounds.

Table 4: pKa values.
Conversely, the electrophoretic mobilities for nadolol and propranolol are similar, like their structures, and, therefore, it is to be expected that their acid-base constants will also be similar. The acid-base constants can be graphically determined at the inflexion point of the sigmoidal curve. The non-linear regression was performed using SPSS software, and the values of the acid-base constants and μBH+ were determined and are shown in Table 3 and 4.
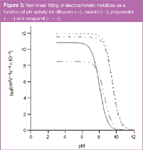
Figure 3
By spectrophotometric DAD data: The acid-base constants were also calculated using the spectrophotometric method, with the absorbance obtained using a DAD. In this situation, the absorbance data were plotted against pH, and the non-linear regression was fitted using Equation 12 (Figure 4). The values of the acid-base constants obtained are shown in Table 4.
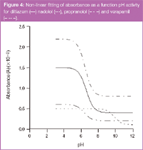
Figure 4
Comparison of the methods: For the antianginals, three methods were used to determine the acid-base constants of four antianginal agents — by relating electrophoretic mobilities with pH (linear and non-linear) and by relating absorbance with pH. With regard to the mobilities, two fits were studied, namely, a linear and a non-linear regression. Comparing the results with those reported in the literature it is possible to predict that the acid-base constants obtained by the CE procedure are closer to real values than those obtained with absorbance data (Table 4).
With the CE–DAD method, the value of the acid-base constant for nadolol was higher than the tabulated one, while for the other three compounds it was lower. The worst result was obtained for propranolol with a difference of 3.03 units.
On the contrary, for the CE method using a linear equation, the worst result was for diltiazem (9.47 and 7.70 the calculated and tabulated acid-base constant, respectively), which was also the one with the worst regression coefficient. Nevertheless, this difference was lower using the non-linear fit, with a value of 7.99. Thus, a study of the results obtained for the antianginals shows that non-linear regression gives better outcomes than when linear regression is used.
Other CE pKa Determinations
The literature provides more examples of pKa determination using CE and other techniques. Wan et al.23,24 proposed PACE combined with a short-end injection system for pKa determination. The RSD (%) obtained for benzoic acid, ibuprofen and lidocaine were 0.45, 0.51 and 1.77, respectively. Foulon et al.25 worked with N-imidazole derivatives by means of computer calculations, CE and spectroscopy, and showed a good correlation between the three data. In some instances, however, the calculated value exceeded the other two values by 1 pKa unit.

In addition, the pKa of azo-dyes were determined by both CE and the spectrophotometric methods by Perez-Urquiza et al.26 The results showed that the pKa values obtained by the CE–DAD method for these compounds are closer to the reference values than those obtained only with the CE mobilities. The pKa values of isoflavones were determined by McLeod et al.27 through the non-linear regression of mobilities-pH plots, and they concluded that the use of internal markers is very important for these compounds. The two pKa values of xanthones were determined by Wu et al.28 by the CE and CE–DAD methods. No significant differences were noted. The results obtained in non-aqueous media using CE, after the corresponding corrections, were pKa values which were also closer to those reported in the literature.
Comparing the pKa Determination Techniques
The disadvantages of potentiometric titrations are that they require several milligrams of compounds, a considerable length of time and the use of aqueous media. Dual-phase potentiometric titrations can be applied to non-aqueous media but show the same disadvantages as the potentiometric technique.
Spectrophotometric titrations are time-consuming and more expensive compared with the two previous techniques. The time-related problem disappears if the method is automated and this is why the spectral gradient analysis method is the most useful pKa determination technique in laboratories: sample consumption is reduced, the sample throughput only takes a few minutes, usually 5 min. The limitation is that the presence of a chromophore is needed. The four techniques do not prove useful if the sample is not pure.
In comparison with the previous pKa determination techniques, we find that CE is automated, sample consumption is reduced and, because the data obtained are mobilities, a wide variety of detectors can be used. Furthermore, the impurities in the sample do not interfere. Finally, CE throughput is high because several peaks or substances (usually, more than 10 per minute) are easily obtained.
Conclusions
This article shows that the values of the acid-base constants can be easily determined by CE. An example is presented for diltiazem, nadolol, propranolol and verapamil. The pKa values can help to explain the CE migration characteristics of these compounds and aid in predicting the migration order of similar compounds. This study also demonstrates the usefulness of CE in determining acid-base constants.
CE determinations use very small amounts of sample, compared with potentiometry and spectroscopy, where a fresh amount of sample has to be used at each pH value. As only the migration time is needed for CE, the exact concentration of the compound does not need to be known. In this study, both the linear (Equation 8) and non-linear (Equation 11) fits were used to calculate values of acid-base constants, and the two results were then compared using UV spectra collected by on-line DAD. Finally, the acid-base constants obtained using CE agreed well with the values reported in literature.
Acknowledgments:
This work was supported by the Fundació Bancaixa project P1 1B2006–12. Devasish Bose is also grateful to Bancaixa for her grant.
Maria-Elisa Capella-Peiró PhD works in analytical chemistry at the Universitat Jaume I. She works in the Química Bioanalítica (Bioanalytical Chemistry) group and is a specialist in the use of optimization techniques in capillary electrophoresis and liquid chromatography.
Devasish Bose PhD is a team leader at University of Saugour in the field of toxicology applying capillary electrophoresis and liquid chromatography techniques in the development of analytical methods. He obtained his PhD in 1998 and won several grants for work at Universitat Jaume I.
Manuel Font-Rubert obtained his chemistry degree from the Universitat Jaume I and is a third year PhD student working on the development of capillary electrophoresis methods and applications as a part of his thesis.
Josep Esteve-Romero is professor in Bioanalytical Chemistry and director of the Química Bioanalítica group at Universitat Jaume I. The group use capillary electrophoresis and liquid chromatography techniques for the determination of drugs of abuse, monitorization drugs and other compounds in collaboration with hospital laboratories.
References
1. S.F.Y. Li, Capillary Electrophoresis: principles, practise and applications, Journal of Chromatography Library, 52, Elsevier, Netherlands (1992).
2. P. Janoš, J. Chromatogr. A, 1037, 15–28 (2004).
3. M. Matoga et al., J. Chromatogr. A, 984, 253–260 (2003).
4. P. Barták et al., Anal. Chim. Acta, 421, 221–229 (2000).
5. M. Pérez-Urquiza and J.L. Beltrán, J. Chromatogr. A, 917, 331–336 (2001).
6. X. Wu et al., J. Chromatogr. A, 1061, 217–223 (2004).
7. J.S. Esteve Romero, G. Ramis Ramos and M.C. García Alvarez-Coque, Journal of Colloid 347 and Interface Science, 141, 44–49 (1991).
8. L.B. Pfendt, T.J. Janjic and G.V. Popovic, Analyst, 120, 2145–2151(1995).
9. C. Foluon et al., J. Chromatogr. A, 1035, 131–136 (2004).
10. J. Barbosa, D. Barrón and E. Jiménez-Lozano, J. Chromatogr. A, 839, 183–192 (1999).
11. S.D. Mendonsa and R.J. Hurtubise, J. Chromatogr. A, 841, 239–247 (1999).
12. H. Wan et al., Rapid Commun. Mass Spectrom., 17, 2639–2648 (2003).
13. A.L. Simplício et al., J. Chromatogr. A, 1045, 233–238 (2004).
14. S.M.C. Buckenmaier, D.V. McCalley and M.R. Euerby, J. Chromatogr. A, 1004, 71–79 (2003).
15. C.E. Lin et al., J. Chromatogr. A, 1051, 283–290 (2004).
16. S.K. Poole et al., J. Chromatogr. A, 1037, 362 445–454 (2004).
17. G.S. McLeod and M.J. Shepherd, Phytochemical Analysis, 11, 322–326 (2000).
18. H. Wan et al., Rapid Commun. Mass Spectrom., 17, 2639–2648 (2003).
19. A. Psurek and G.K.E. Scriba, Electrophoresis, 24, 765–773 (2003).
20. J. Muzikar et al., Anal. Chem., 74, 428–433 (2002).
21. M.D. Cantu, S. Hillebrand and E. Carrilho, J. Chromatogr. A, 1068, 99–105 (2005).
22. American Hospital Formulary Service 98, Drug Information, American Society of Health-System Pharmacists, Bethesda, Maryland, USA (1988).
23. J.E.F. Reynolds, Martindale, The Extra Pharmacopoeia, 30th ed.,The Pharmaceutical Press, London, UK (1993).
22. C. Hansch, in R G. Sammes and J.B. Taylor (Eds.), Comprehensive Medicinal Chemistry, 6, Pergamon Press, Oxford, UK (1990).
23. C. Foulon et al., J. Chromatogr. A, 1035, 131–136 (2004)

New TRC Facility Accelerates Innovation and Delivery
April 25th 2025We’ve expanded our capabilities with a state-of-the-art, 200,000 sq ft TRC facility in Toronto, completed in 2024 and staffed by over 100 PhD- and MSc-level scientists. This investment enables the development of more innovative compounds, a broader catalogue and custom offering, and streamlined operations for faster delivery. • Our extensive range of over 100,000 high-quality research chemicals—including APIs, metabolites, and impurities in both native and stable isotope-labelled forms—provides essential tools for uncovering molecular disease mechanisms and exploring new opportunities for therapeutic intervention.
New Guide: Characterising Impurity Standards – What Defines “Good Enough?”
April 25th 2025Impurity reference standards (IRSs) are essential for accurately identifying and quantifying impurities in pharmaceutical development and manufacturing. Yet, with limited regulatory guidance on how much characterisation is truly required for different applications, selecting the right standard can be challenging. To help, LGC has developed a new interactive multimedia guide, packed with expert insights to support your decision-making and give you greater confidence when choosing the right IRS for your specific needs.

.png&w=3840&q=75)

.png&w=3840&q=75)


.png&w=3840&q=75)


.png&w=3840&q=75)


