Rules of Thumb for Reversed-Phase LC: What’s In Your Chromatographic Mind?
A critical part of troubleshooting is understanding how the system should behave so that irregular behavior can be spotted. The more rules we know, the easier troubleshooting becomes. Learning these six rules is a great place to start.
A handful of approximate rules about the behavior of reversed-phase liquid chromatography can facilitate more efficient work, both during method development and in troubleshooting problems that arise with LC systems.
As with other fields of analytical science, such as spectroscopy and mass spectrometry, professionals practicing chromatography carry a lot of information and knowledge in their minds that facilitates problem solving in their daily work. I think this is most evident in method development activities for chromatography. For example, knowing the general retention behavior of a carboxylic acid-containing analyte in reversed-phase liquid chromatography (LC) enables the method developer to make the quick decision to decrease the mobile phase pH if they observe that the retention of this analyte is too low. To me this kind of knowledge is akin to knowing a set of “math facts” so that one does not have to always reach for a calculator when making estimates for simple calculations. Here, carrying in our minds knowledge of the general behavior of a carboxylic acid-containing analyte in reversed-phase LC allows us to avoid looking in books or journal articles for commentary on the behavior before taking the next step in method development. In this case, the rule is that generally retention of a carboxylic acid-containing analyte will increase as the mobile phase pH is decreased from above the pKa of the carboxylic acid functional group to below the pKa.
In my work with students and practicing chromatographers around various aspects of LC, I find that they generally are not aware of as many of these rules as they could be. Increasing the amount of chromatographic knowledge we carry around in our minds will not only be helpful during method development, but also in troubleshooting problems with LC systems. Very often a critical part of the troubleshooting process is understanding how the system should behave so that irregular behavior can be spotted, and troubleshooting efforts can be focused in this area. The more rules we have in mind, the more readily we can spot irregular behavior. This installment of “LC Troubleshooting” articulates several rules in one place. They are not new ideas, but information about them tends to be spread out across many resources. In this article, I have consolidated some of them as a starting point for increasing the knowledge in our chromatographic minds.
Rules #1-4: Mobile Phase Effects on Retention of Small Molecules in Reversed-Phase LC
#1: Effect of the Level of Organic Solvent in the Mobile Phase
In many cases, the most powerful determinant of retention in reversed-phase LC is the volume fraction of organic solvent (commonly referred to as “%B”) in the mobile phase, and thus it is very helpful to have a sense for how much the retention of an analyte of interest should change in response to a change in %B. As part of my ongoing work in my laboratory, we have collected retention data for a diverse set of small molecules that includes both non-ionogenic (that is, no net charge in aqueous solutions) and ionogenic (both acids and bases) compounds. Since we have retention factors for these compounds in several different mobile phases varying in %B, we can calculate the degree of change in retention factor for a certain degree of change in %B.
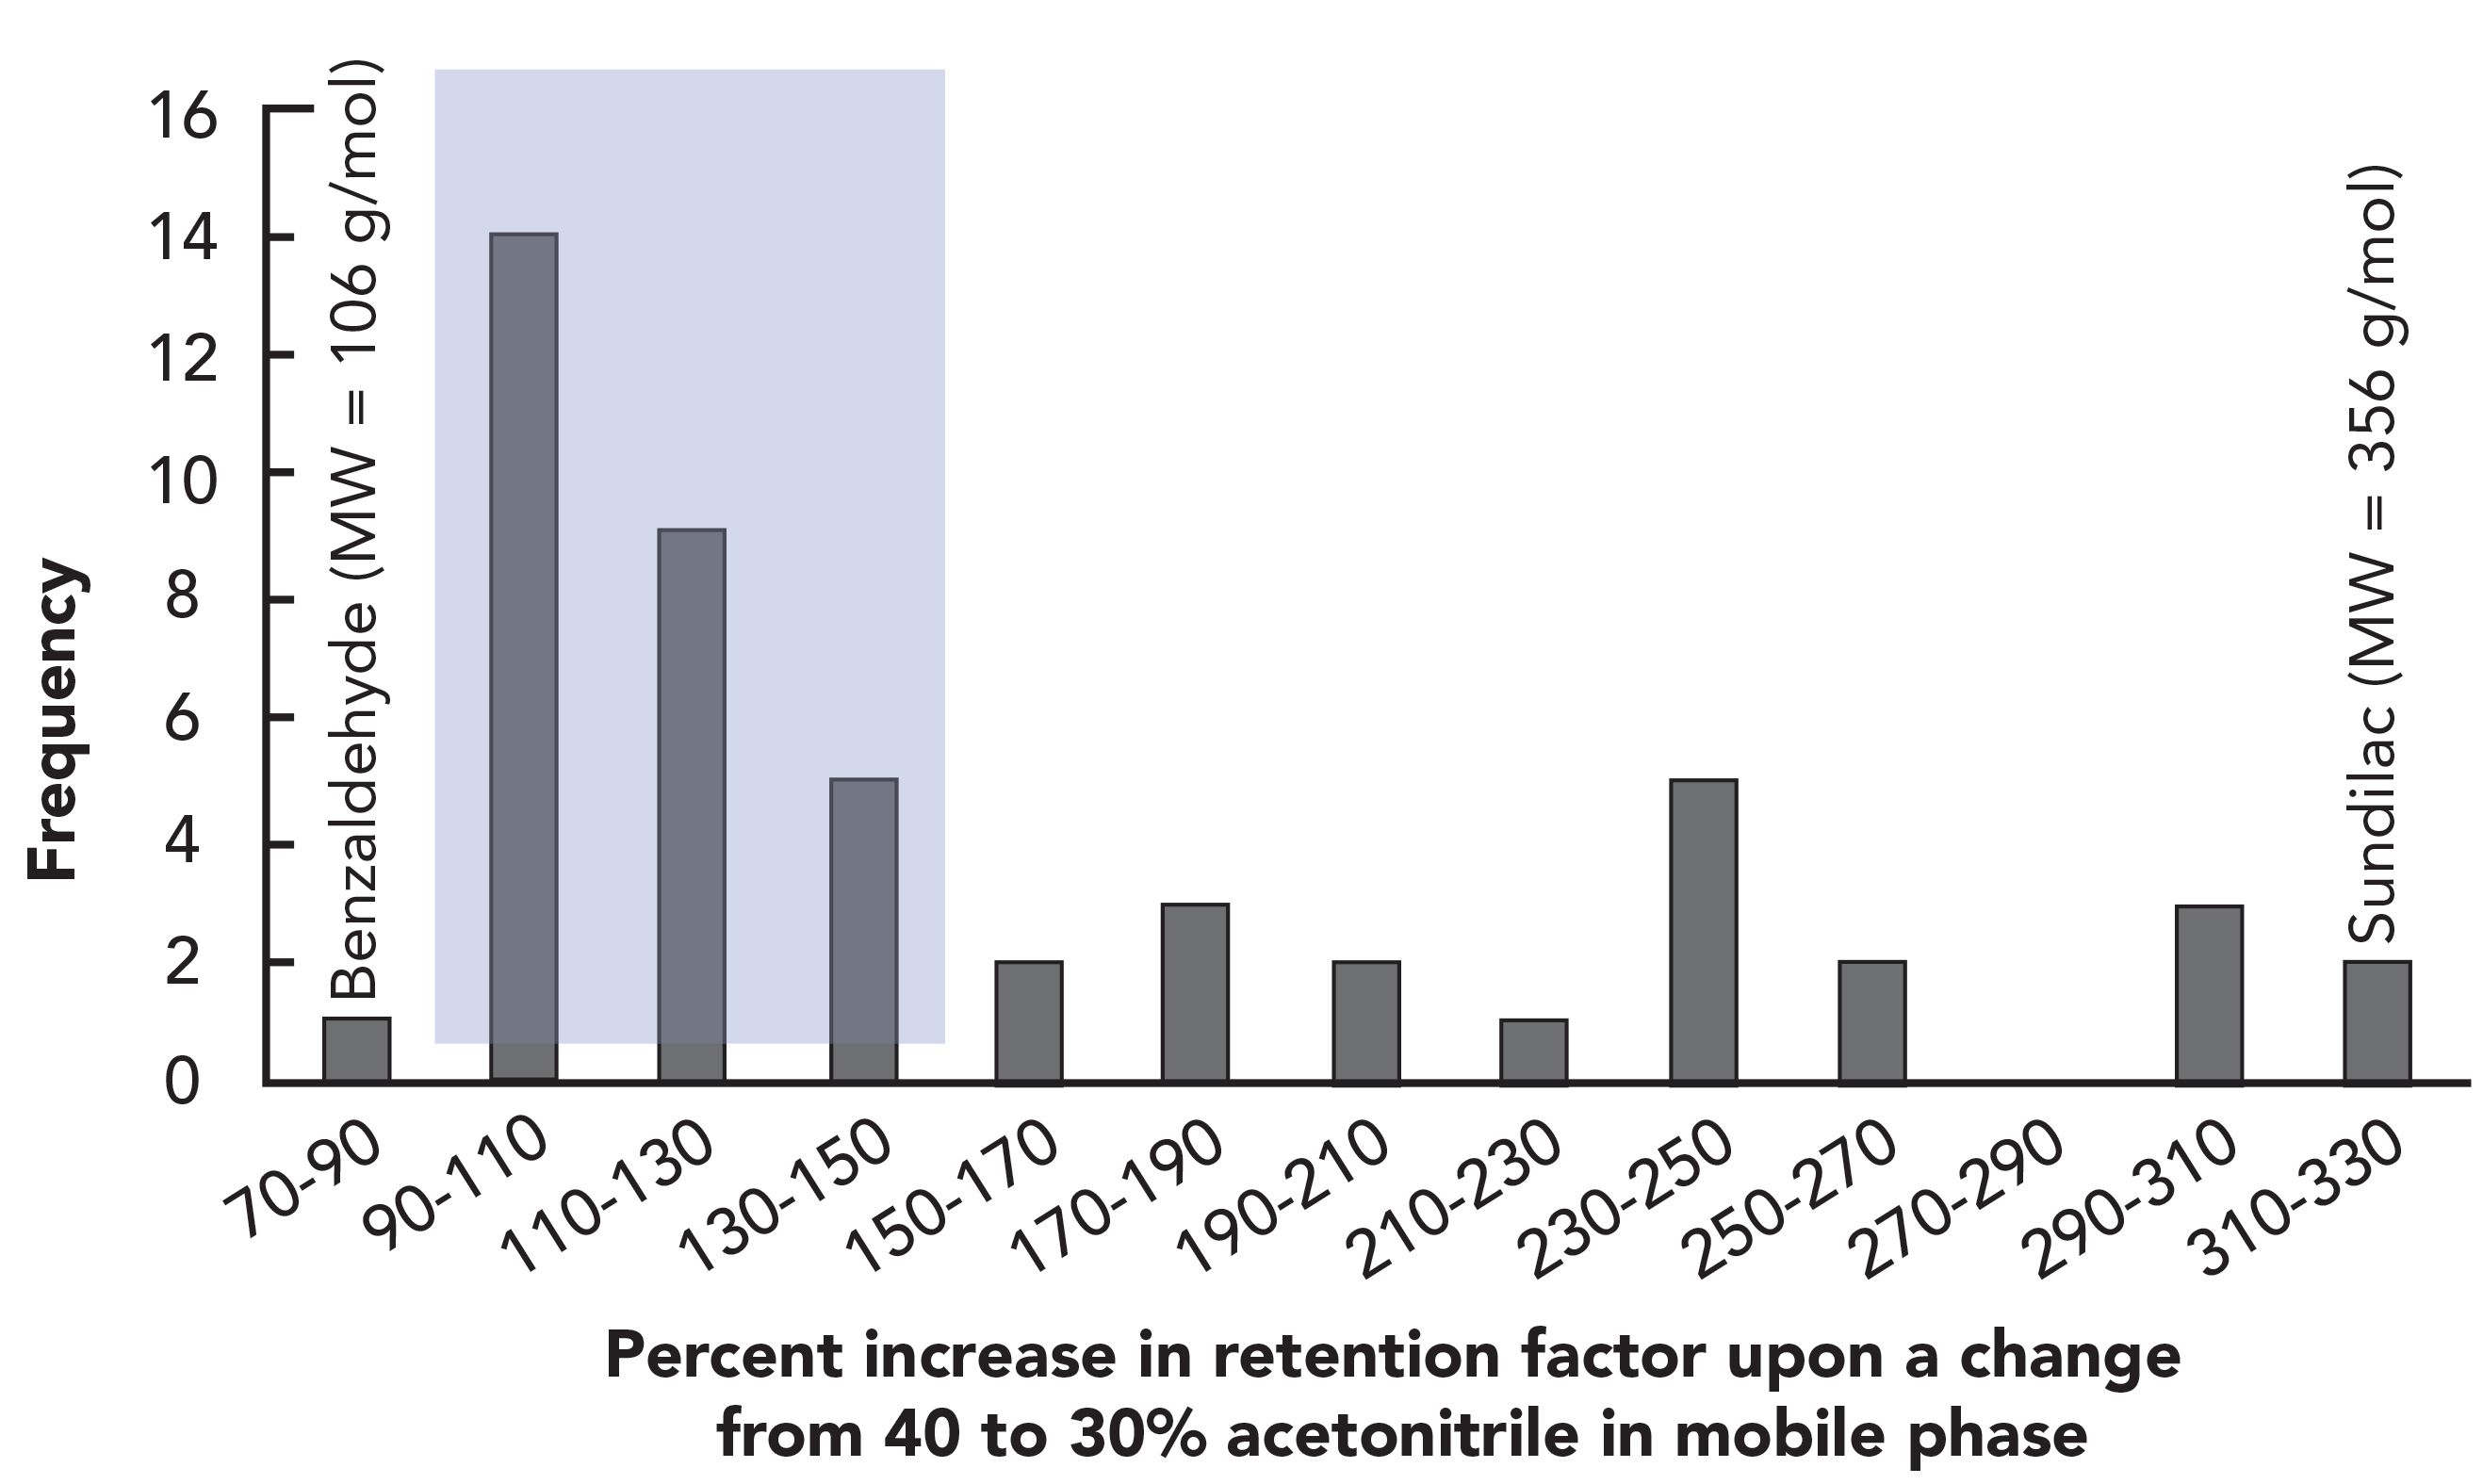
Figure 1 shows a histogram of these results. Here, a 100% increase in retention means that the retention factor for a given compound doubles when the %B is decreased from 40% to 30%, a 200% increase means that the retention triples, and so on. From these data we make two practically significant observations: 1) the degree to which retention increases for these compounds in response to the same change in mobile phase composition varies by about a factor of four; and 2) the degree of change for the majority of the compounds falls in the range of 90% to 150%. Based on this, we can adopt the rule that the retention of an average small molecule will roughly double in response to a 10% decrease in the %B in the mobile phase; these numbers are easy to remember. For a more precise estimate of the expected change, more information about the analyte and separation conditions are needed. For example, it is known that the degree of change in retention in reversed-phase LC is highly correlated with the molecular weight of the analyte (1), which we also see in the data.
Figure 1: Increases in the retention of 49 small molecule analytes in response to a 10% decrease in the organic solvent level (%B) in the mobile phase of RPLC separations. Chromatographic conditions: column, Agilent SB-C18; temperature, 40 °C; mobile phase A solvent, 25 mm ammonium formate, pH 3.2.
#2: Effect of the Type of Organic Solvent
Acetonitrile (ACN) and methanol (MeOH) are the organic solvents most commonly used in reversed-phase LC mobile phases. However, they are not interchangeable in terms of their effects on retention and selectivity in separations of small molecules. The effects of these solvents on selectivity are compound- and stationary phase-specific, and thus we should be careful not to assign too much weight to general statements about their effects on retention. However, a generalization is still useful for method development and troubleshooting purposes. The diagram in Figure 2 is known as a nomogram, which is useful for estimating the composition of one mobile phase that will lead to roughly the same retention as another mobile phase containing a different organic solvent. The dashed blue line helps visualize how this tool can be used in practice.
Figure 2: Nomogram for the comparison of acetonitrile-, methanol-, and tetrahydrofuran-containing mobile phases used for RPLC. Adapted from reference (2).
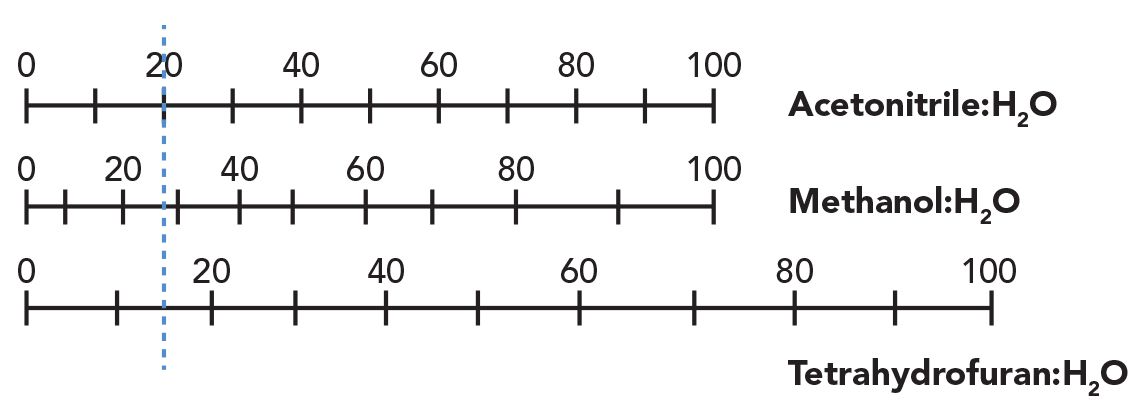
Suppose we have an isocratic separation where a particular analyte has a retention factor of five in a mobile phase that is 20% (v/v) acetonitrile. The nomogram shows us that we could expect to observe similar retention for the same compound on the same column if we use about 8% more methanol (28%) or 5% less tetrahydrofuran (15%) in the mobile phase. Inspection of the nomogram shows that these percentages that will give similar retention vary as one moves across the scale from 100% aqueous to a 100% organic solvent mobile phase. However, a rule to remember here is that when changing from a mobile phase of acetonitrile water to methanol water, use about 10% more methanol than acetonitrile to get comparable retention; when using tetrahydrofuran water, use about 5% less tetrahydrofuran than acetonitrile to get comparable retention.
#3: Effect of Mobile-Phase pH on Retention of Carboxylic Acids
The fact that some small molecules change their ionization state over the pH range of aqueous solutions can present challenges in method implementation, but also opportunities. With non-ionogenic small molecules, we are limited to variables, including mobile-phase composition, temperature, and stationary phase chemistry to adjust retention and selectivity. However, with ionogenic analytes (such as carboxylic acids) and amines, the pH of the mobile phase can also be a powerful determinant of retention and selectivity.
Figure 3 illustrates the general retention behavior of these types of molecules under reversed-phase LC conditions. The carboxylic acid functional group (Figure 3a) is protonated and neutral (that is, not charged) in a mobile phase with a pH that lies below the pKa of the acid (in this case, pKa = 5). When protonated, the acid is less water soluble and retention will be higher compared to the case where the acid is deprotonated and negatively charged (that is, when pH > pKa). The limiting retention of the two forms when the mobile phase is buffered well below or above the pKa depend on the nature of the rest of the analyte structure. A useful rule here, then, is that the reverse-phase LC retention of a carboxylic acid-containing analyte will be significantly higher in a mobile phase buffered at a pH much lower than the pKa compared to when the mobile phase is buffered well above the pKa
Figure 3: Illustration of the effect of mobile phase pH on retention of (a) carboxylic acids and (b) amines in RPLC. The pKa of the generic carboxylic acid in this example is assumed to be 5, and the pKa of the protonated, acidic form of the amine is assumed to be 10.
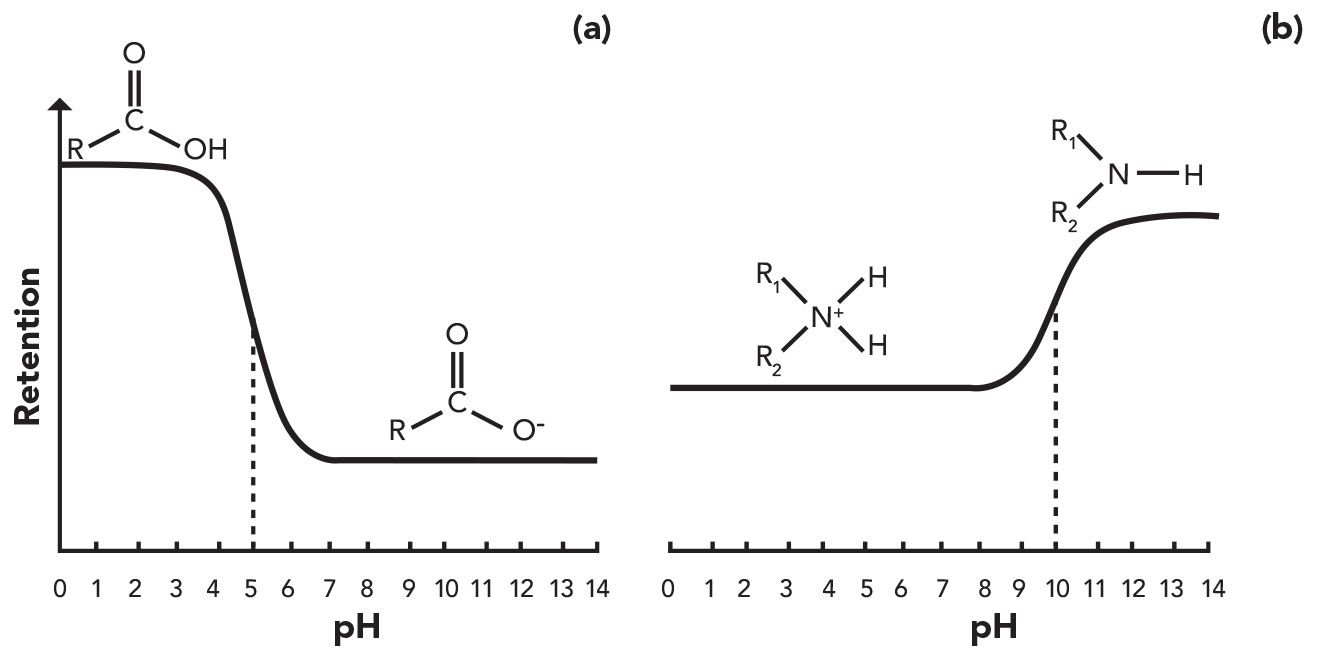
As shown in Figure 3b, the dependence of retention on mobile phase pH is quite different for amine-containing analytes compared to carboxylic acids. In this case, the protonated and positively charged form of the amine is favored in mobile phases buffered well below the pKa of this acid, while the deprotonated and neutral form of the amine is favored when the pH is above the pKa. It is this difference in the ionization behavior of the two functional groups that leads to the very different retention behaviors depicted in Figure 3. In the case of amine-containing analytes, a useful rule is that the retention will be significantly lower in a mobile phase buffered at a pH much lower than the pKa of the acidic form of the amine compared to when the mobile phase is buffered well above the pKa.
Relevance to Troubleshooting
On occasions where peaks do not appear where they are expected to appear in a chromatogram (whether in absolute terms, or relative to each other), the list of possible reasons is pretty long. Is the flow rate correct? Was the mobile phase made properly? Is the solvent proportioning valve working properly in the pump? This short version of the list has several elements related to potential problems with the mobile phase, and so it is very helpful to have in mind the expected effect on retention of a change in either the type or amount of organic solvent in the mobile phase and in the mobile phase pH. Knowing whether or not the magnitude of the observed change in retention could possibly be explained by a problem with the mobile phase composition can help reduce the number of likely causes of the problem to pursue, and ultimately help the analyst arrive at a solution more quickly.
Rules #5 and 6: Mobile Phase
Viscosity and Pressure Drop in Reversed-Phase LC
Pressure is an important topic in modern LC. Contemporary methods are often run at pump pressures on the order of several hundred bar, and problems with partially blocked connecting tubing, filters, or columns can result in an over-pressure situation that must be resolved before analysis can continue. We can also use measured pump pressures to our advantage during troubleshooting, however. Under most reversed-phase LC operating conditions in common use the flow in the LC system is laminar, which means that the pressure drop between the pressure measurement point in the pump and the detector outlet is highly predictable. For example, under these conditions, the pressure drop between the inlet and outlet of a piece of connecting capillary is related to the mobile phase viscosity through Poiseulle’s law, shown in equation 1:
[1]
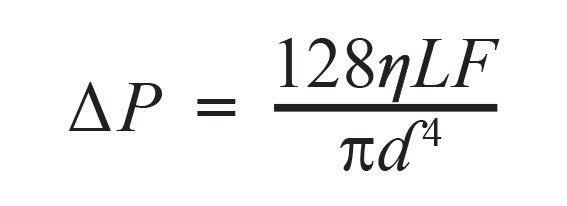
where ∆P is the pressure drop across the capillary, F is the flow rate of mobile phase, η is the mobile phase viscosity, L is the capillary length, and d is the capillary diameter. In the case where all of the variables except viscosity are fixed (as in a typical LC analysis ), we can predict the change in pressure drop if the change in mobile phase viscosity is known or predictable, as in gradient elution, for example.
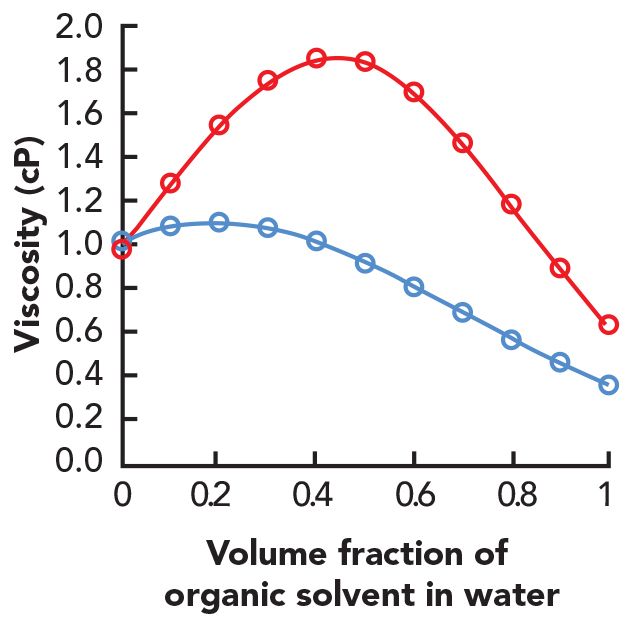
Figure 4 shows the dependence of the viscosity of acetonitrile:water or methanol: water mixtures on the fraction of organic solvent in water. Since the pressure drop is directly proportional to the first power of the viscosity, we can expect the pressure measured at the pump to change in a way that looks very similar to these curves when we execute a solvent gradient from 0% to 100% organic solvent (or a piece of these curves if a narrower gradient is used). Indeed, the observed pressure profiles look very much like this in actual experiments, and these pressure measurements can be useful when troubleshooting LC problems. A useful rule for acetonitrile water mixtures is that the maximum viscosity and pressure occurs around 20% acetonitrile, and that 100% acetonitrile has a viscosity that is about one-third of that of water. For methanol water mixtures, a useful rule is that the maximum viscosity occurs around 50% methanol, and the viscosity of 100% methanol is slightly lower than that for water.
Figure 4: Dependence of mobile phase viscosity on volume fraction of organic solvent in water at 20 °C and ambient pressure. The values plotted are based on the data in reference (3), which were fitted as described in reference (4). The blue line is acetonitrile, and the red line is methanol.
Relevance to Troubleshooting
The direct relationship between pressure drop and mobile phase viscosity means that we can use the pressure measured at the pump as an indirect (relative) measure of the viscosity of the mobile phase flowing through the system. This can be quite valuable for troubleshooting a number of problems, including leaky pump parts, malfunctioning gradient proportioning valves, errors in mobile phase preparation, and errors in method setup and implementation. Again, knowing the pressure changes we should expect to see during gradient elution, or when switching from 100% acetonitrile to 100% water better prepares us to determine when something does not look quite right; these are often the first clues needed in a successful troubleshooting adventure.
Summary
In this installment of “LC Troubleshooting,” we have discussed several chromatographic rules that approximately describe some of the behaviors we observe in reversed-phase LC systems, which are useful in both method development and troubleshooting. While there are certainly exceptions to these guidelines, and they only describe average behavior, carrying these general ideas in our chromatographic minds can make our method development and troubleshooting work more efficient by facilitating quick decisions about next steps, and identification of potential problems when the observed behavior of the system does not look quite right.
Acknowledgment
I would like to acknowledge Gustavus student Simerjit Kaur for compiling the retention information shown in Figure 1.
References
- L.R. Snyder, and J.W. Dolan, High-Performance Gradient Elution: The Practical Application of the Linear-Solvent-Strength Model (John Wiley & Sons, Hoboken, New Jersey, 2007).
- L.R. Snyder, in: Practical HPLC Method Development (John Wiley, Hoboken, New Jersey, 2nd ed., 1997), pp. 226–227.
- J. Billen, K. Broeckhoven, A. Liekens, K. Choikhet, G. Rozing, and G. Desmet, J. Chromatogr. A 1210, 30–44 (2008). https://doi.org/10.1016/j.chroma.2008.09.056.
- J. Halvorson, A.M. Lenhoff, M. Dittmann, and D.R. Stoll, J. Chromatogr. A 1536, 185–194 (2016). https://doi.org/10.1016/j.chroma.2016.12.084.

Dwight R. Stoll is the editor of “LC Troubleshooting.” Stoll is a professor and the co-chair of chemistry at Gustavus Adolphus College in St. Peter, Minnesota. His primary research focus is on the development of 2D-LC for both targeted and untargeted analyses. He has authored or coauthored more than 60 peer-reviewed publications and four book chapters in separation science and more than 100 conference presentations. He is also a member of LCGC’s editorial advisory board. Direct correspondence to: LCGCedit@mmhgroup.com

Green Chemistry: What is it (and What Is It Not)? And How Does It Apply to Gas Chromatography?
October 31st 2024Everyone is talking about sustainability, and organizations are creating sustainability programs. But what does green chemistry really mean, and how does it apply to gas chromatography?
HILIC Peptide Retention Times Predicted Using New Approach
October 29th 2024Manitoba Centre for Proteomics and Systems Biology scientists produced a new means of predicting peptide retention times for hydrophilic interaction liquid chromatography (HILIC) at acidic pH in formic-acid based eluents.
A Review of the Latest Separation Science Research in PFAS Analysis
October 17th 2024This review aims to provide a summary of the most current analytical techniques and their applications in per- and polyfluoroalkyl substances (PFAS) research, contributing to the ongoing efforts to monitor and mitigate PFAS contamination.