Semi-Automated Cleanup of Persistent Organic Pollutants in Environmental Samples—Complete Separation of PCDD/Fs and PCBs for Extracts in Toluene
Environmental laboratories with high sample throughput often wish to analyze PCDD/Fs and PCBs in separate fractions. The cleanup method described here results in complete separation, and offers an alternative to fully manual or fully automated cleanup.
Analysis of polychlorinated dibenzo-p-dioxins (PCDDs), furans (PCDFs), and biphenyls (PCBs) by environmental laboratories in North America has continued for many years. Increasingly analytical needs have focused on complete separation of PCDD/Fs and PCBs during sample processing with all existing 209 PCBs being analyzed. A semi-automated method (EZPrep), which combines elements of fully manual and fully automated procedures, was developed and tested. It uses pre-packaged silica, alumina, and carbon column kits for sample cleanup. The system uses a vacuum pump to elute solvents through these chromatographic columns for sample purification and preparation. The method described here allows for the sample extracts to be in toluene. With this method all PCBs are collected in one fraction and all PCDD/Fs in another fraction. 13C labeled recoveries for 10 g soil extracts were 75 to 95% for PCDD/Fs and 75 to 90% for PCBs. Similar tests for 2 g salmon extracts yielded recoveries of 80 to 105% for PCDD/Fs and 75 to 95% for PCBs. The semi-automated method can process six samples in parallel within a 50 min period.
Persistent organic pollutants (POPs), such as polychlorinated dibenzo-p-dioxins (PCDDs), furans (PCDFs) and biphenyls (PCBs), have been analyzed and studied in a variety of samples for decades (1). These compounds are regulated under the 2004 Stockholm Convention, which the majority of countries in the world have acceded (2). Human health risks include possible damage to the immune system, the nervous system, reproductive functions, increased risk of cancer, endocrine disruption, and chloracne (3). PCDD/Fs occur as byproducts of various processes such as combustion, incineration, metallurgical industry, and pulp and paper bleaching production (4). PCBs were produced from the 1920s to the 1970s (1.5 million tons globally) and used in capacitors and transformers as flame retardants, hydraulic fluids, sealants, and vacuum pump fluids (5).
PCDD/Fs and PCBs have been strictly regulated in North America, creating a steady flow of samples analyzed by both small and large environmental laboratories. PCDD/Fs and PCBs sample processing is labor-intensive and prone to error. Compliance with regulatory procedures and accreditation requirements can result in a lengthy method validation effort. Oftentimes, strict quality assurance (QA) requirements apply. The complexity of sample matrices and the possibility of native background interferences, which can be orders of magnitude higher than analytes, can be very challenging.
Since these compounds are often present at very low concentrations (nano-, pico-, or even femto- gram levels, (10-9–10-15 gram) of sample elaborate extraction and cleanup methods have been developed to remove interferences as much as possible. Environmental samples can be air, sediment, soil, or water, and food stuffs are often analyzed. Sample extraction for solid samples is usually done by techniques such as pressurized liquid extraction (PLE) and Soxhlet extraction; solid phase extraction (SPE) can be used for
liquid samples.
Manual procedures for cleanup of sample extracts (typically in hexane) include use of open column chromatography with the various steps: 1) Use acidified silica (often mixed with sulfuric acid) to oxidize lipids or other components of the extract (such as chlorophenols). Sometimes, neutral-basic silica is used behind the acidic silica. Depending on the amount of oxidation desired, the amount of acidified silica used will vary. Silver nitrate can be added to the column downstream of the silica to remove any sulfur components present in the extract. 2) Basic alumina is used after the silica steps to remove chlorobenzenes and other chlorinated components. 3) Carbon columns can be used to further purify the extracts and also to fractionate and separate the mono- and di-ortho chlorinated PCBs from the PCDD/Fs and so-called coplanar PCBs. This is because the carbon retains flat molecules such as PCDD/Fs and coplanar PCBs while letting the other PCBs through. The solvents that are eluted from the columns in the cleanup steps include benzene, dichloromethane, hexane and toluene. Meanwhile, the column elution is gravity-driven (6).
Automation of sample cleanup has focused on the use of a closed loop system to reduce background contamination, use of certified pre-packaged columns kits to further reduce background, lower solvent use, and elution by using a positive pressure pump. An automated system may allow for running more sample extract cleanups in parallel and faster processing through use of preprogrammed methods via a built-in computer (7).
A combination of aspects of both manual and automated methods can lead to a semi-automated system which is closed and uses pre-packaged certified column kits (thus reducing chances of background contamination) but requires less capital investment than a fully automated system. Use of a vacuum pump for column loading and elution reduces processing times compared to fully manual procedures and has the advantage of limiting potential downtime since the vacuum pump is the only mechanical part of the set-up. It also uses less electricity than an automated system.
Commercial environmental laboratories in North America with high sample throughput are often interested in analyzing PCDD/Fs and PCBs in completely separate fractions. This reduces the need for analyzing each sample more than twice and makes the analysis of all 209 PCBs in a separate fraction easier. In addition, Soxhlet-based methods for sample extraction are often carried out in toluene. Cleanup of sample extracts in concentrated toluene without the need for further evaporation and solvent-exchange to hexane is considered highly desirable.
The work described here offers a simple method for cleanup of sample extracts in between 2–10 mLs of toluene using a semi-automated system. The method results in complete PCDD/Fs and PCBs separation.
Materials and Methods
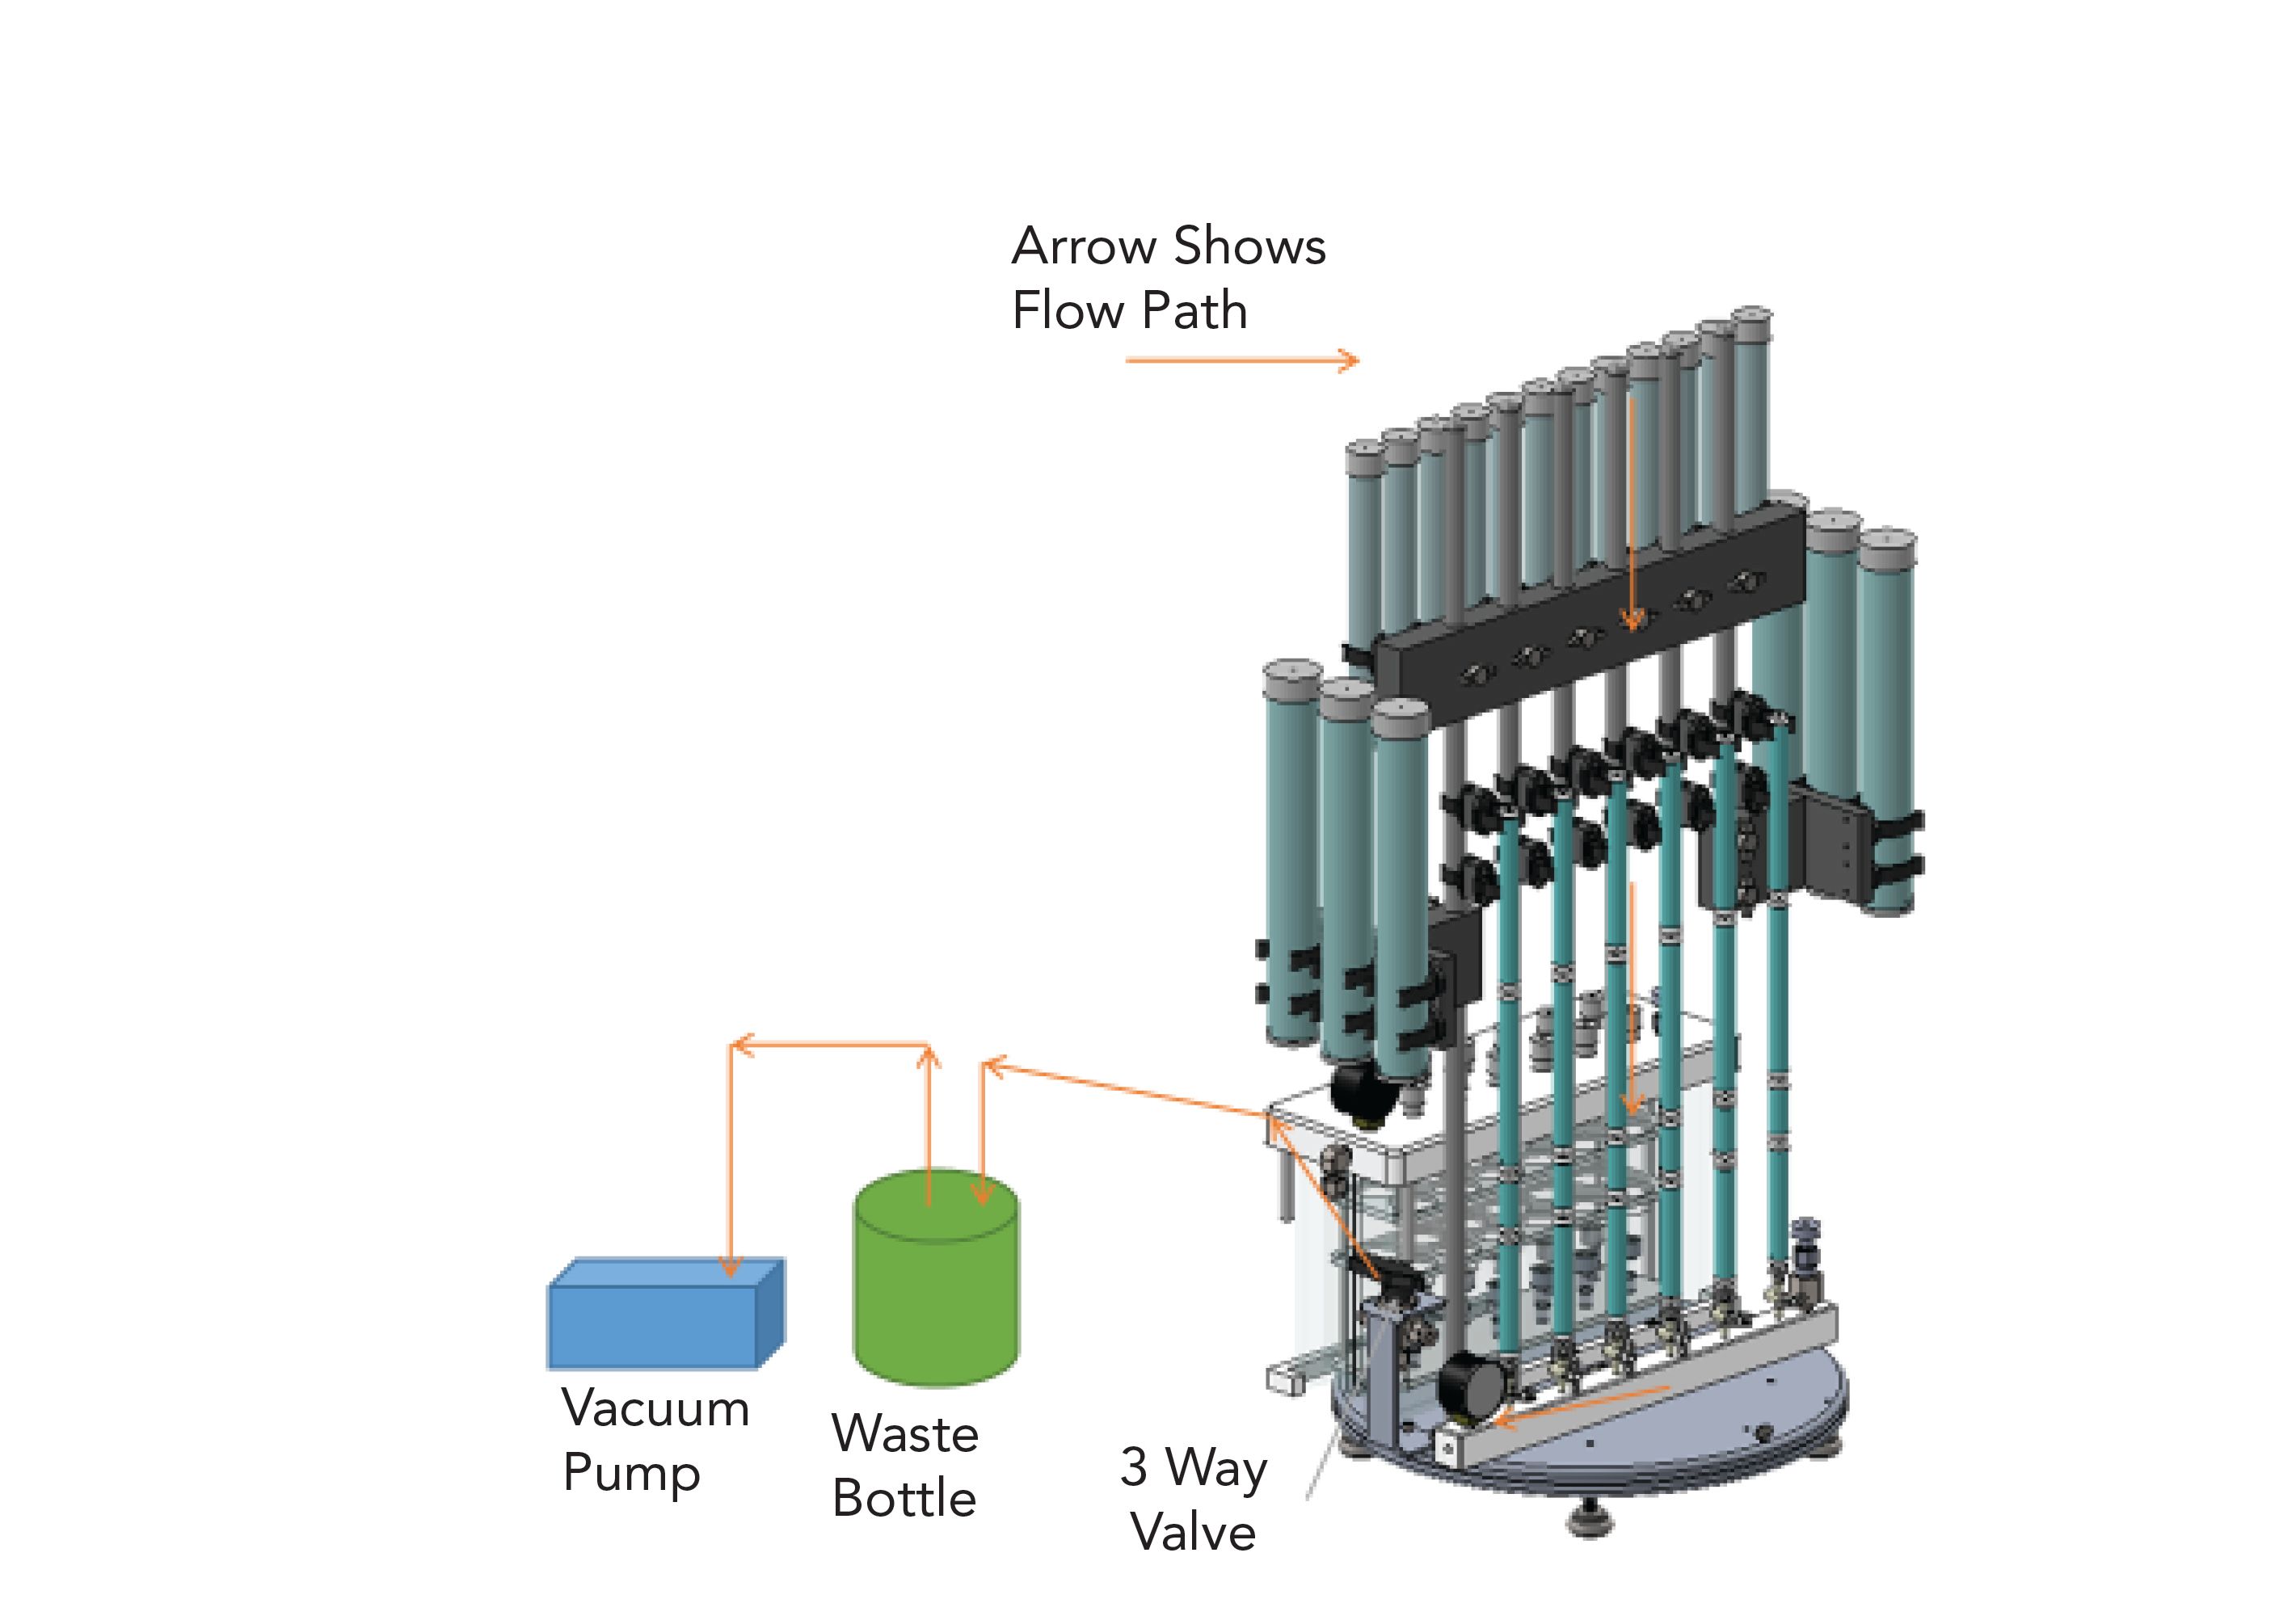
A closed loop system (EZPrep; Fluid Managements Systems, Watertown, MA) was used that utilizes the certified pre-packaged column kits mentioned above. The semi-automated system uses a rotary workstation with a vacuum pump to perform the entire sample cleanup in two stages. Figure 1 shows the small and large solvent reservoirs at the top and on the sides of the system. Black clamps (column holders) are shown for large size acidic silica columns and small clamps for the other columns. The turntable that the system is mounted on allows to rotate it 180o so that either side can face forward. Note that no columns are in place in Figure 1. The Stage 1 manifold has six positions for installing columns when the solvent eluents are directed to waste. The Stage 2 glass manifold (“fish tank”) is meant to contain collection tubes for when the desired analytes are eluting from the columns. The three-way valve controls the vacuum by directing it to either Stage 1 or Stage 2 or putting in “neutral” (off).
Figure 1: Rotary workstation with various parts shown.

Figure 2 shows the system with columns being conditioned (eluents to waste) on the Stage 1 side. The flow of solvents is shown with arrows going from the solvent reservoirs to the columns, then through the Stage 1 manifold to a wash bottle for waste collection and to the vacuum pump. The vacuum pump is the only mechanical part of the set-up and is used to pull the samples and elution solvents through the columns either to waste or for collection.
Figure 2: System with columns and vacuum pump (arrows show flow paths).
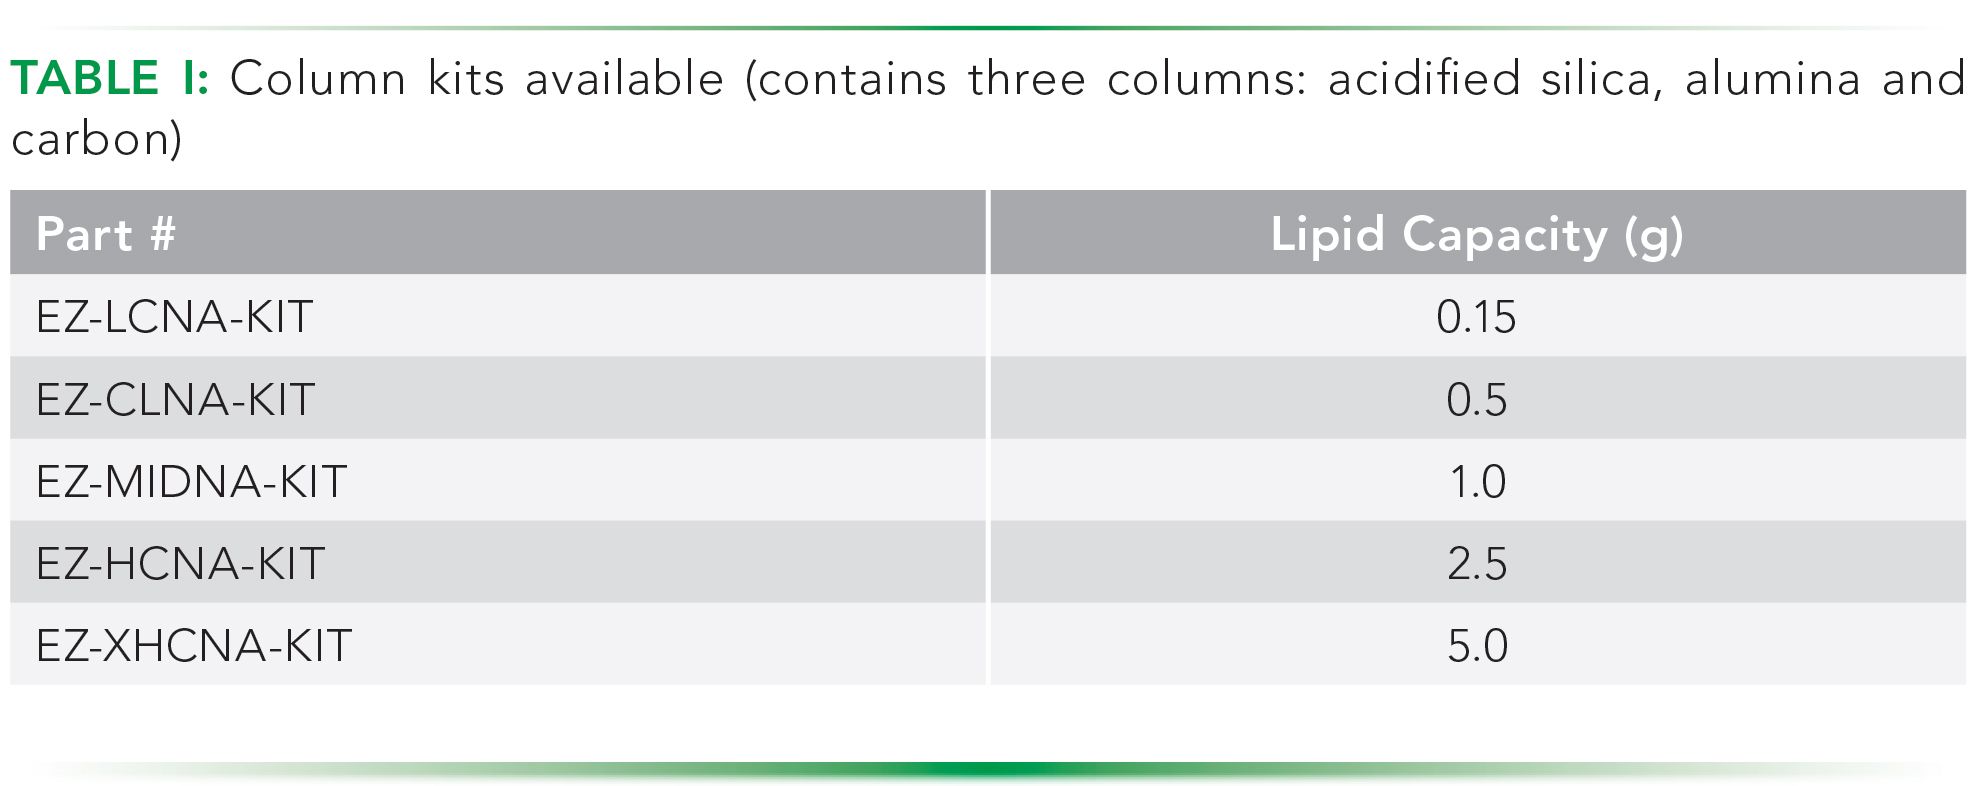
In the work presented here, three columns in a pre-packaged kit were used: high capacity acidified silica, 6 g alumina, and carbon. Depending on the amount of lipid or other oxidizable material in the sample, an acidified silica column with lower or higher capacity can be used. Columns available have between 0.15 g and 5 g of lipid capacity. The high capacity columns used can oxidize up to five grams lipid. The alumina and carbon columns used always have the same size. Columns can be ordered as kits (Table I, Fluid Management Systems, Watertown, MA, www.fms-inc.com).
Procedure
Stage 1: Columns were assembled in the order high capacity acidic silica–alumina (no carbon used here). The columns connect easily using male and female SNAP connections that are built in. The use of a 4 g neutral-basic silica column between the acidic silica and alumina columns are optional. The solvent reservoirs were filled with 60 mL hexane, the vacuum was turned on, and the columns were conditioned. The hexane was pulled through the columns by the vacuum pump to waste. Afterwards, the vacuum was turned to neutral.
Stage 2: The column assemblies were removed and put on the Stage 2 side of the turntable on top of the glass manifold. Glass sample collection tubes had previously been put inside the manifold. Samples were placed in syringe vials on top of the acidified silica columns and the vacuum was turned on. Samples were loaded across both the acidified silica and alumina columns in 2–10 mL toluene and collected as Fraction #1 (PCBs).
The syringe vials were removed and the columns were subsequently eluted with 60 mLs hexane from the solvent reservoirs (Fraction #1, PCBs). The vacuum was turned to neutral, the high capacity acidic silica columns were then removed and discarded (all remaining PCBs and PCDD/Fs had been transferred to the alumina), and the vacuum was turned back on. The alumina columns were now eluted with 30 mLs 10% dichloromethane in hexane from the solvent reservoirs (Fraction #1, PCBs). After this step all PCBs had been collected in Fraction # 1 and the PCDD/Fs remained on the alumina. The vacuum was turned to neutral (off) and the collection tubes with Fraction #1 were removed.
Stage 3: The alumina columns were put back on the Stage 1 manifold and connected at the bottom to the top of the carbon columns (which had been connected to the manifold). Solvent reservoirs were filled with 50 mL dichloromethane, the vacuum turned on, and both columns were eluted with 50 mL dichloromethane (vacuum, waste). This transferred the PCDD/Fs onto the carbon columns. The vacuum was then turned to neutral.
Stage 4: Alumina columns were disconnected from the carbon and discarded. The carbon columns were turned upside down and put on the Stage 2 manifold while the sample collection tubes were put in place in the manifold for collection. Solvent reservoirs were filled with 60 mL toluene. The vacuum was turned on and the carbon was eluted in reverse with 60 mL toluene collecting all PCDD/Fs (Fraction #2). The vacuum was turned to neutral and the tubes with Fraction #2 were removed. Because the carbon has strong adsorptive properties, the PCDD/Fs eluting from the alumina onto the carbon in the previous step were mostly present in the upper half of the carbon column; hence, the reason to reverse them before elution with toluene. The total run time was approximately 50 min.
13C PCDD/Fs and PCBs spiked soil and salmon extracts in toluene were run on the cleanup system. Afterwards, collection tubes were put in an automated concentrator (Fluid Management Systems, Watertown, MA), preheated for 10 minutes at 55 °C, followed by heating in sensor mode under a 8–10 psi nitrogen flow which assured automatic shut-off at 0.5–1.0 mL. Samples were reduced in volume further in a vial evaporator (Fluid Management Systems, Watertown, MA) to 10 mL and spiked with recovery standards. Analysis was done on a Thermo high resolution DFS GC–MS with a 60 m x 0.25 mm ID x 0.25-um (film thickness) DB-5 type column. Two ions were measured for each analyte (Multiple Ion Detection). GC–MS analysis was approximately 40 min for PCBs and 60 min for PCDD/Fs.
Discussion
Runs were carried out with 10 g soil and 2 g salmon extracts in toluene. Note that the presence of up to 10 mLs of toluene in the extracts pushes the analytes faster down the acidic silica columns than if the extracts had been in hexane. This results in less hexane needed after sample loading to elute PCDD/Fs and PCBs from the acidic silica onto the alumina and then into the collection vessel. Because of the toluene present, all effluent eluting from the columns is collected and nothing goes to waste. As soon as the samples in toluene are loaded, some of the PCBs are eluted from the columns. The elution of PCB was completed with 60 mL hexane and 30 mL of 10% dichloromethane in hexane. As described above, PCDD/Fs were collected via eluting alumina-carbon with 50 mL dichloromethane and then carbon with 60 mL toluene.
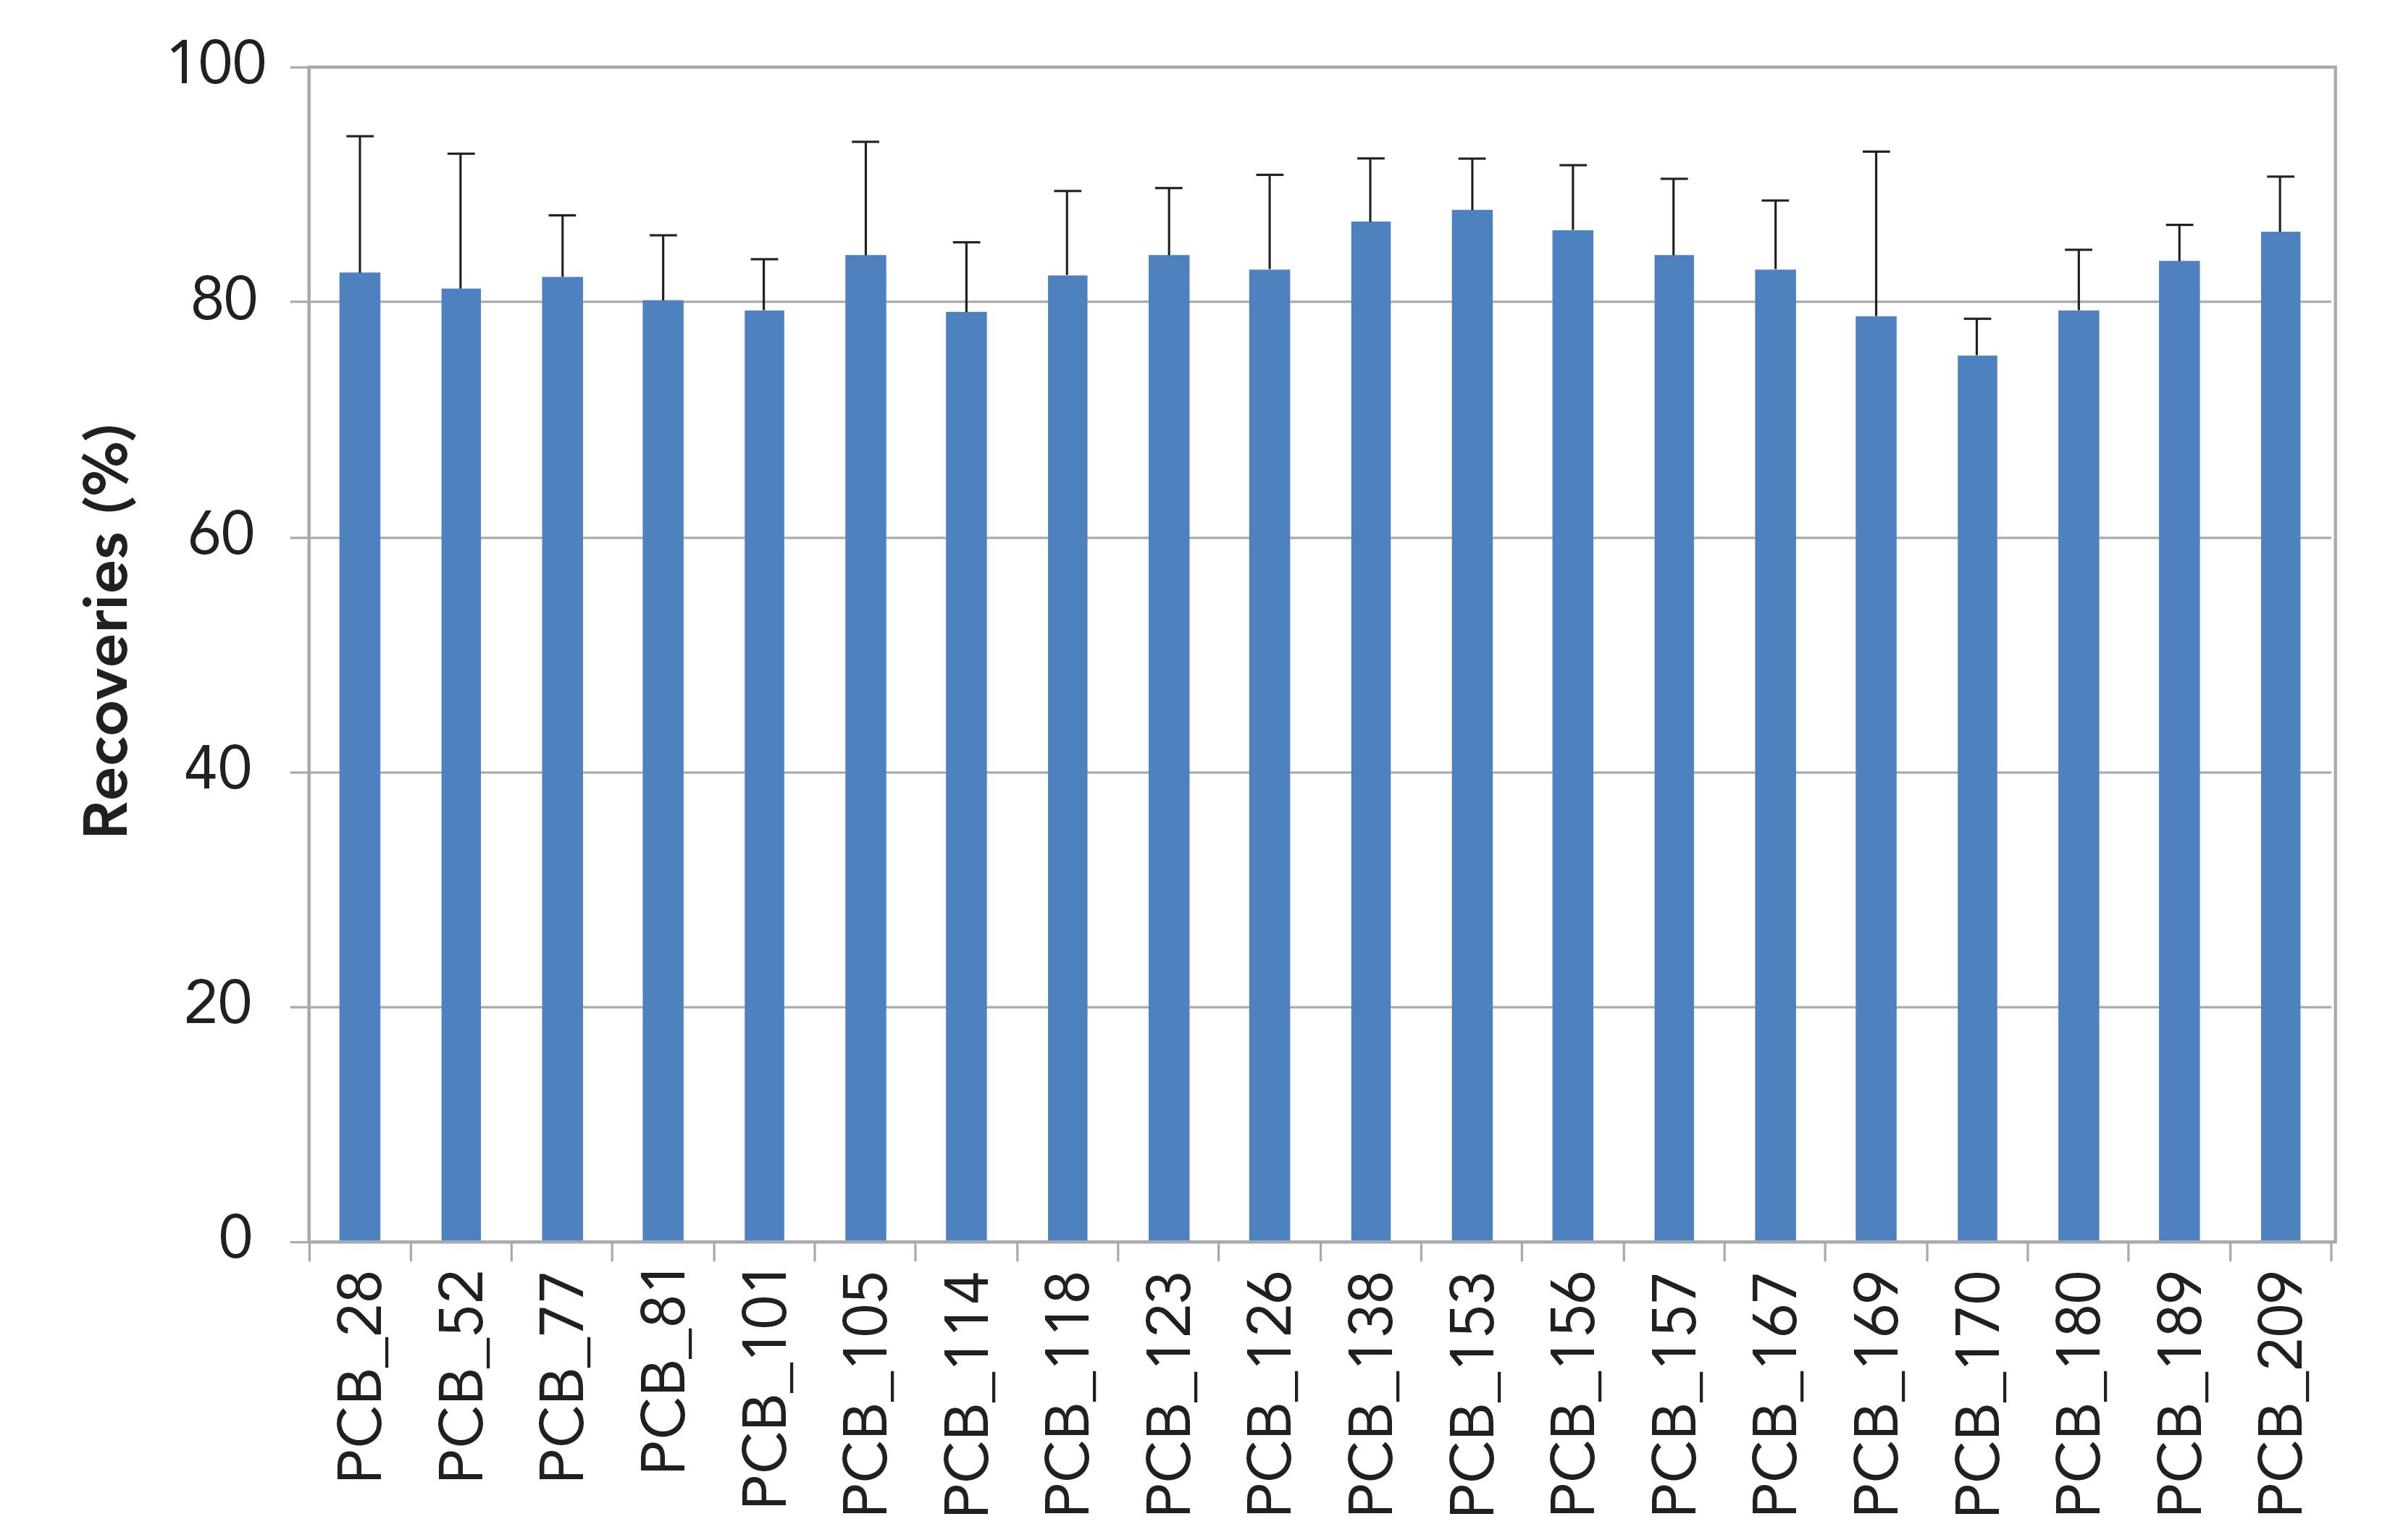
Recoveries across the cleanup step of 13C-labeled PCDD/Fs and PCBs for 10 g soil in toluene extracts are shown in Figures 3 and 4. For PCDD/Fs recoveries were between 75 and 95%, and for PCBs they were between 75 and 90%. Relative standard deviation values (RSDs) are shown as error bars.
Figure 3: 13C PCDD/F recoveries (%) for 10 g soil in toluene extracts (n = 6).
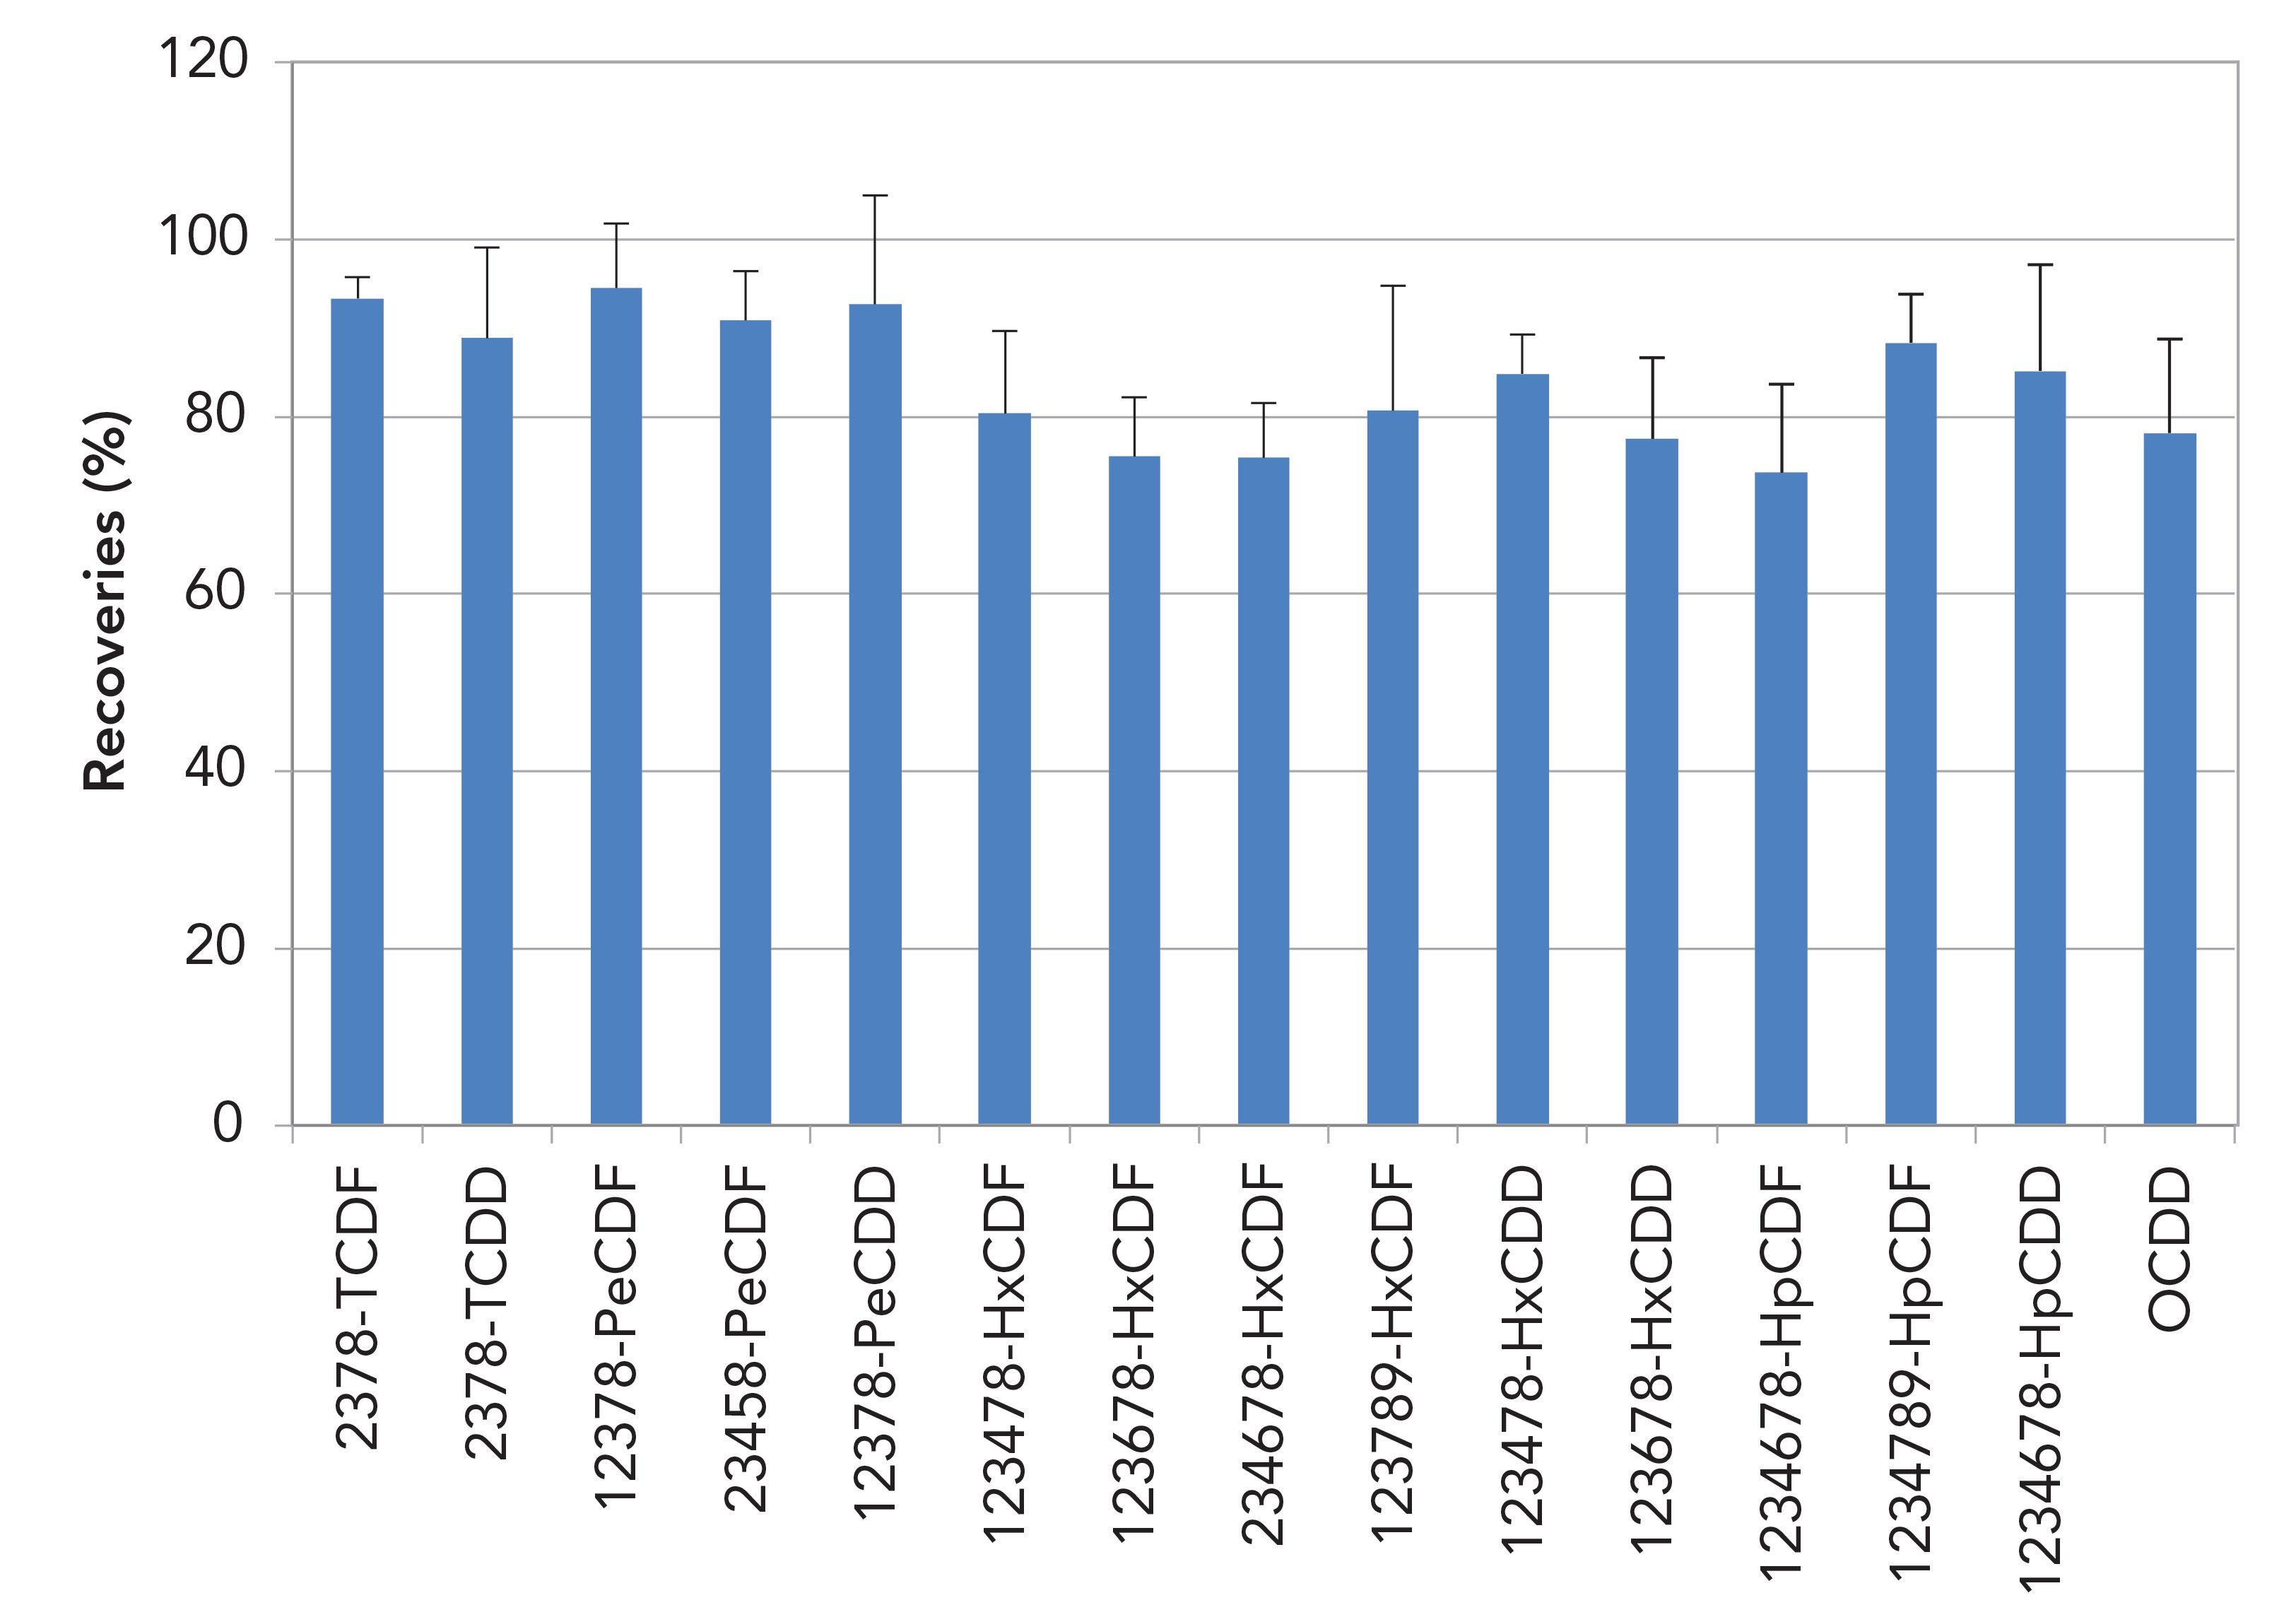
Figure 4: 13C PCBs recoveries (%) for 10 g soil in toluene extracts (n = 6).
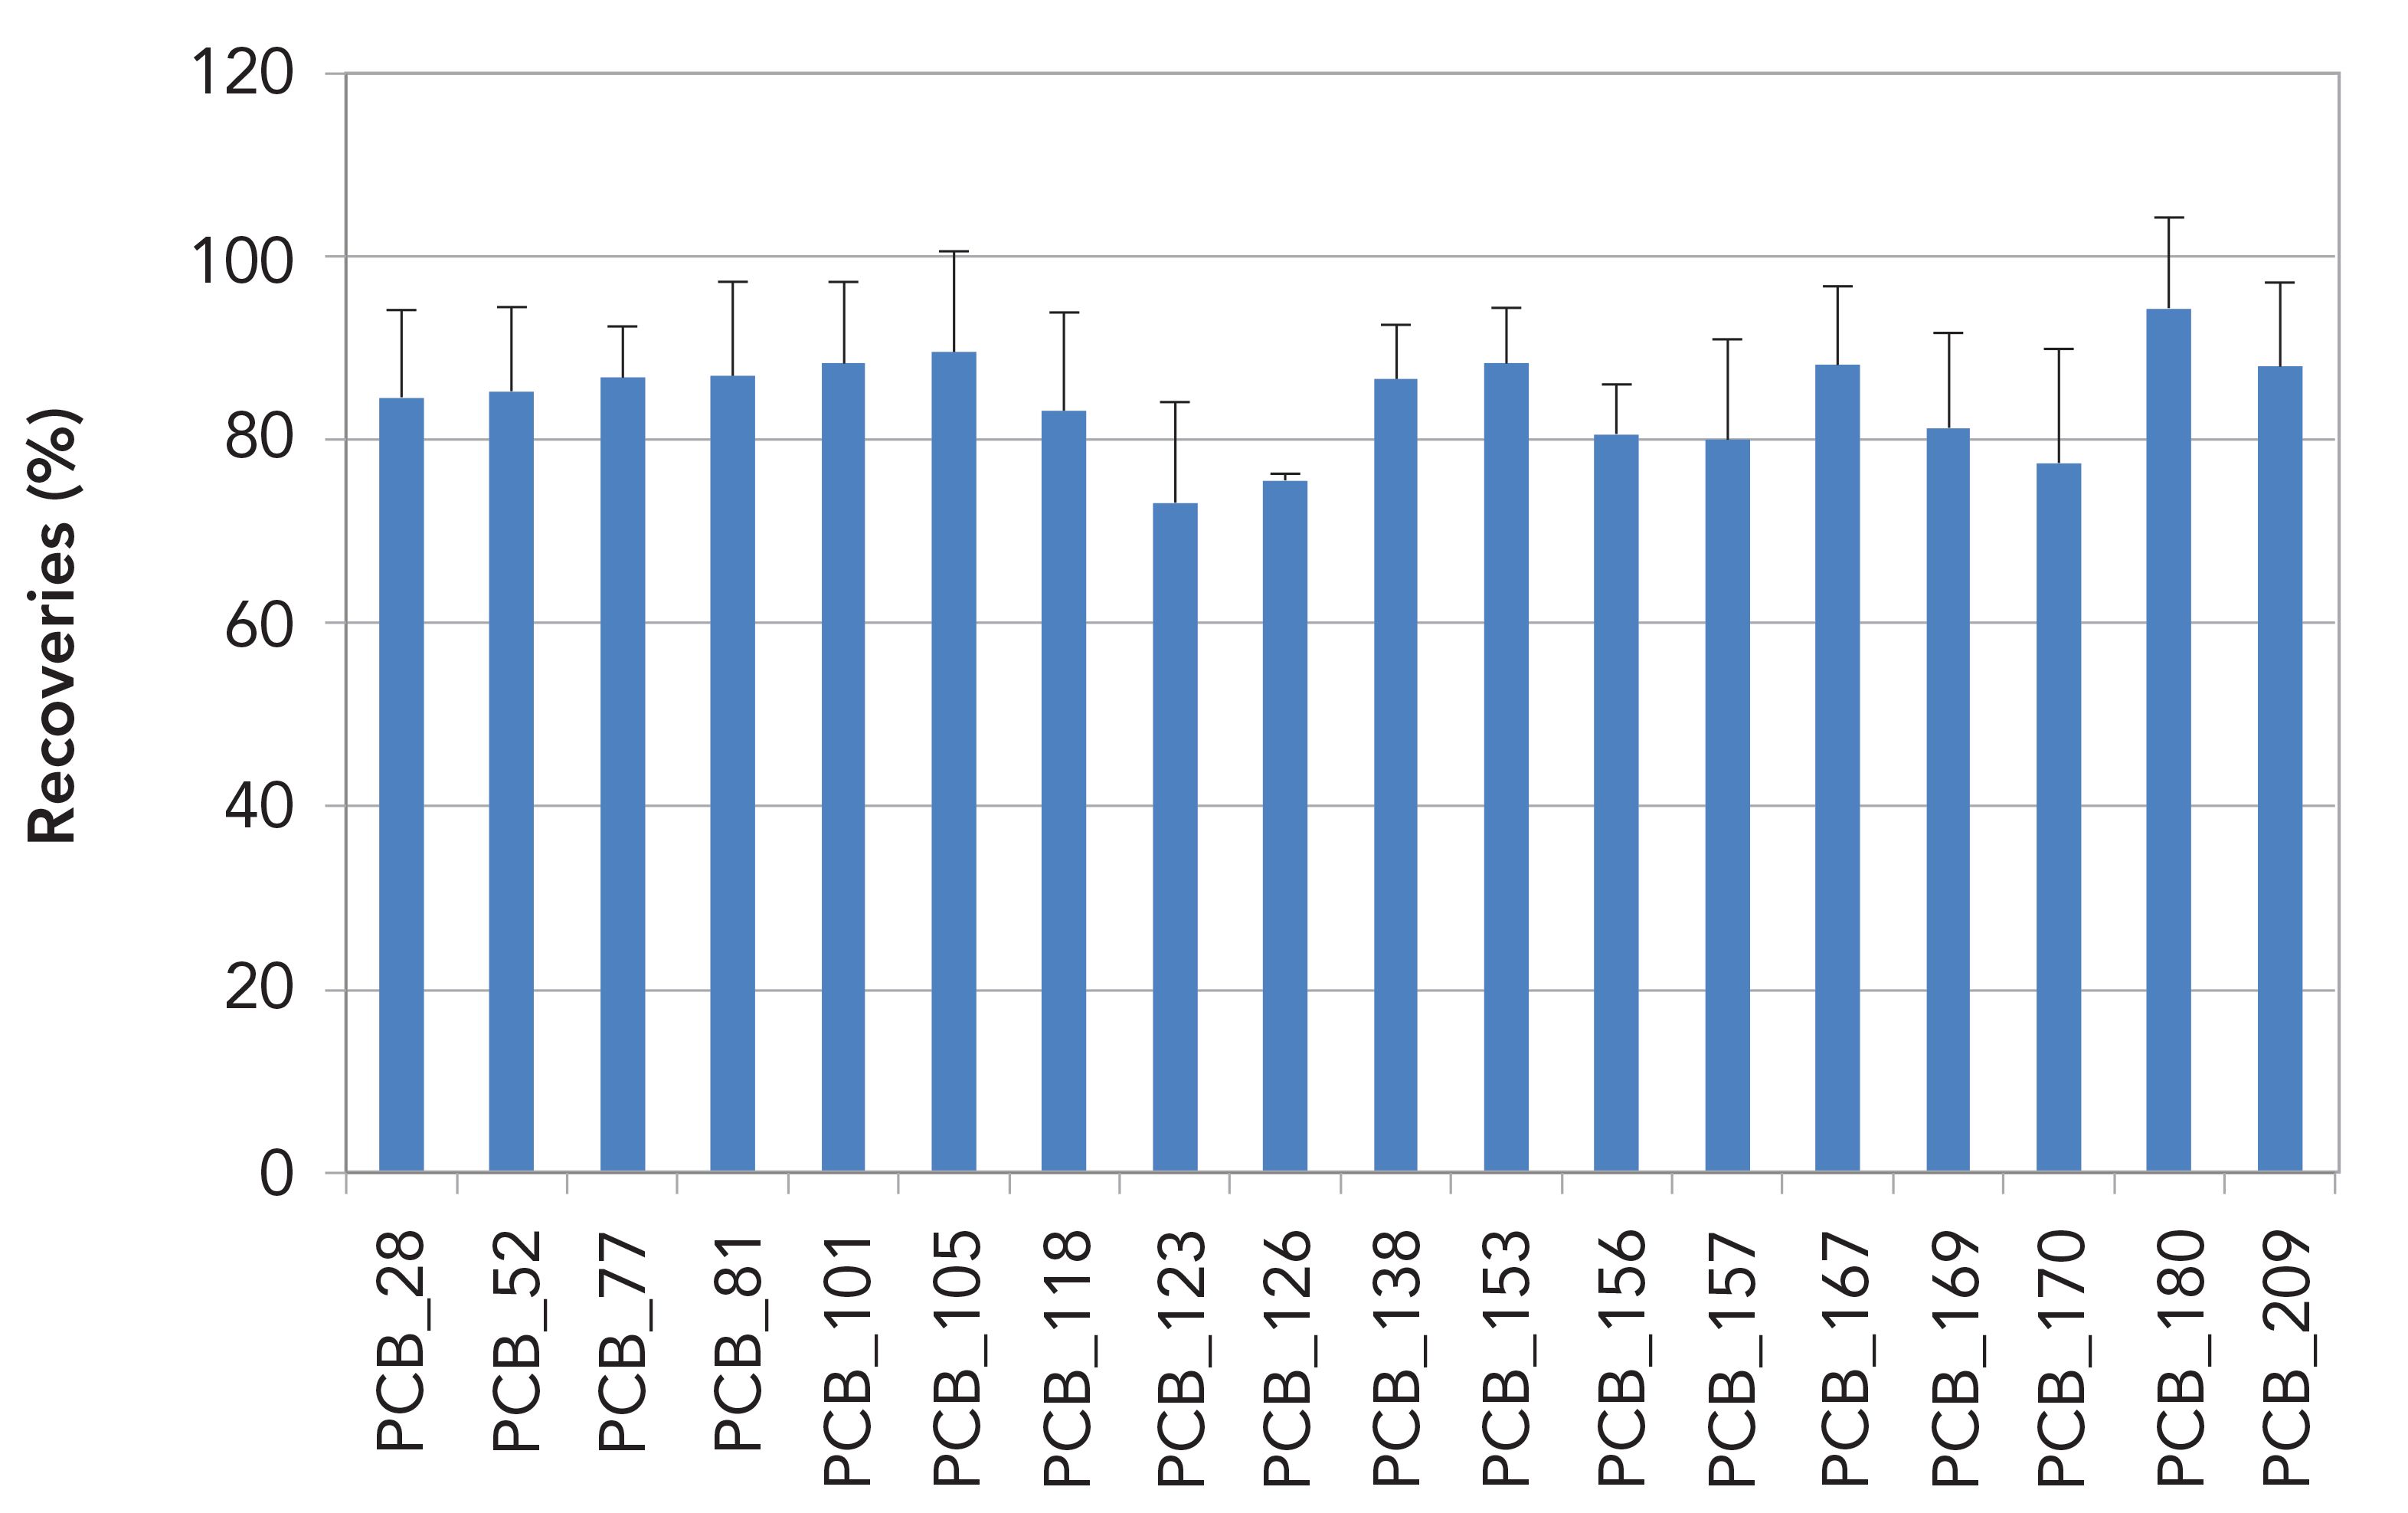
Figures 5 and 6 show 13C-labeled PCDD/Fs and PCBs recoveries across the cleanup step for 2 g salmon in toluene extracts. PCDD/Fs recoveries were between 80 and 105% and PCBs were between 75 and 95%.
Figure 5: 13C PCDD/F recoveries (%) for 2 g salmon in toluene extracts (n = 6).
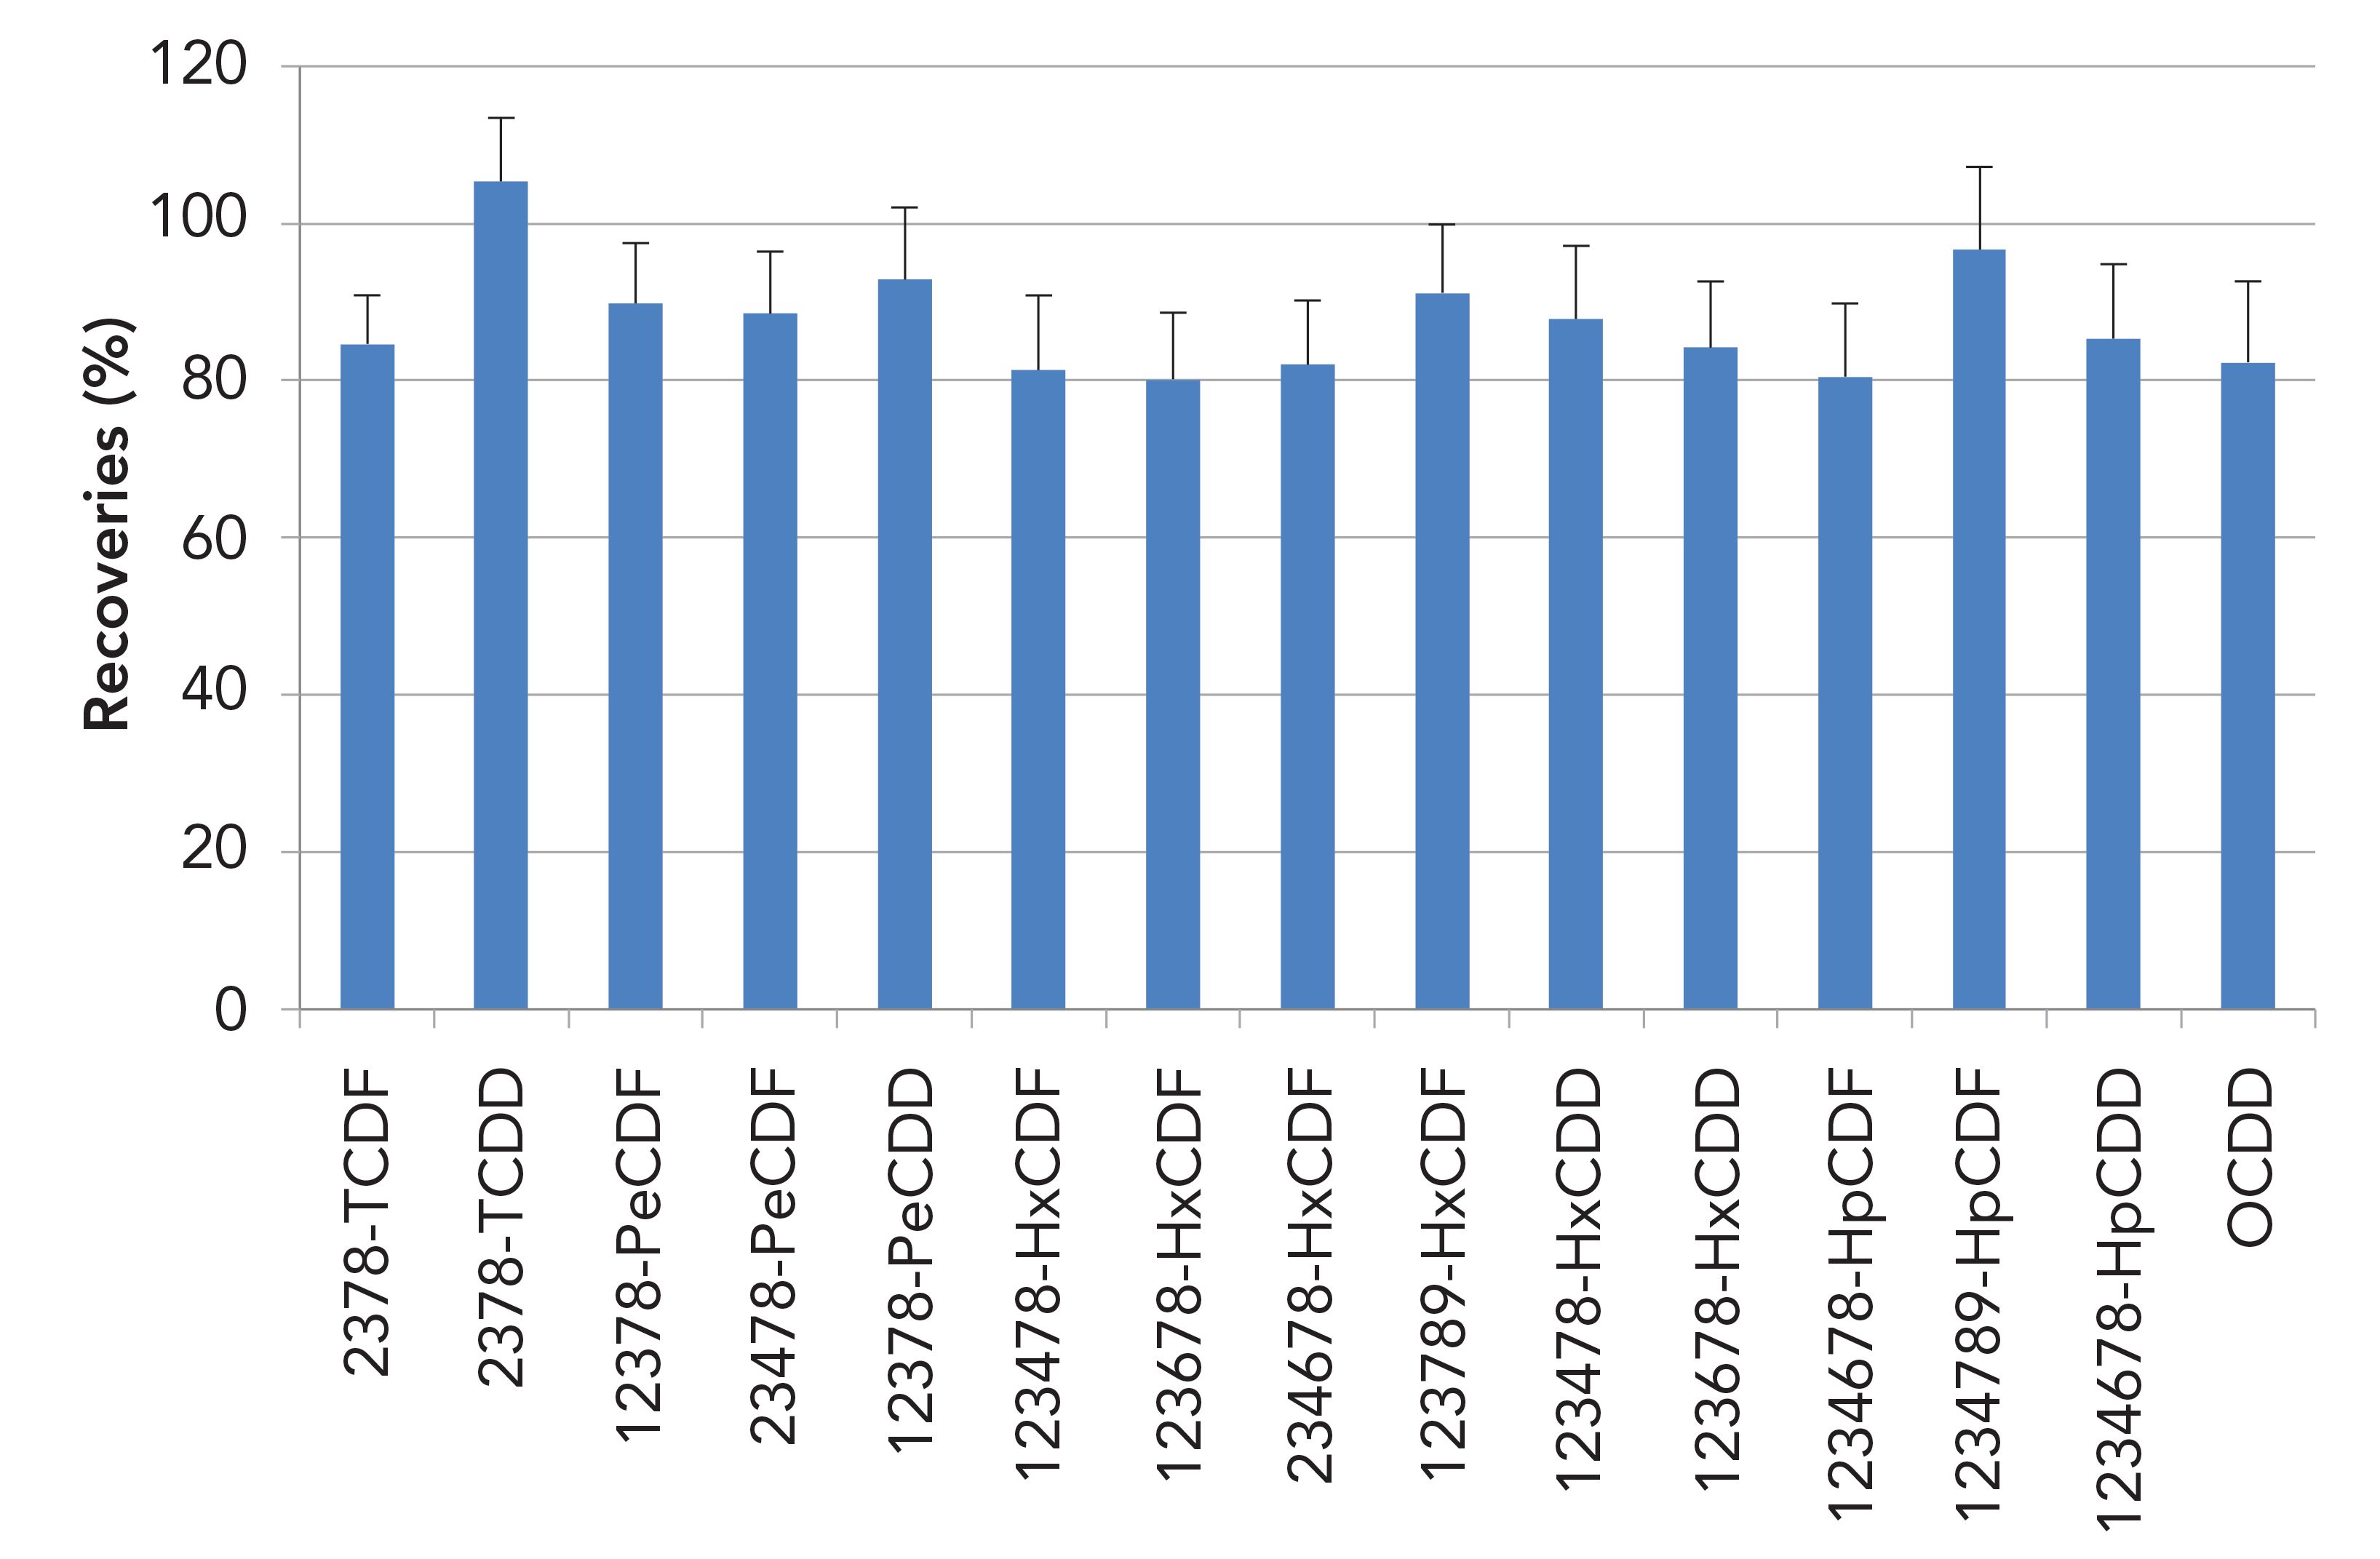
Figure 6: 13C PCBs recoveries (%) for 2 g salmon in toluene extracts (n = 6).
Complex matrices such as fish and soil can be rapidly cleaned up with this method. Total solvent use per sample is reduced because of the presence of toluene in the sample extract. Depending on the capacity of the acidic silica column, 250–300 mL solvent is used per sample. Compared to manual sample cleanup the semi-automated method is faster and incorporates the use of pre-packaged columns reducing the risk of native background contributions. Compared to automated systems, the semi-automated method requires relatively little investment and has less chance of breakdown because the vacuum pump used is the only mechanical part.
Note that the semi-automated EZPrep method is compatible with US EPA methods 1613 for PCDD/Fs, (8), and 1668C for PCBs (9). This is important since these methods are often followed by environmental laboratories in North America and also for work that is done under individual state certification.
Conclusions
Very good recoveries, all well within windows required by EPA methods 1613 and 1668C, were seen with the semi-automated system (Figures 3–6). Because the system is closed and mostly composed of disposable parts, risk of cross-contamination is low. A complete separation of all PCBs and PCDD/Fs was achieved. No solvent exchange to hexane was needed and the extracts in toluene were loaded as such. The method presented here can be seen as an alternative to fully manual or fully automated cleanup. Processing times are about 50 min which is shorter than most manual procedures. Use of certified pre-packaged column kits reduces chance of native background contamination. Individual column kits with varying sizes of acidified silica make the method applicable to low lipid level matrices such as serum and to demanding samples such as edible oils that require a high oxidizing capacity.
References
- M. Dopico and A. Gomez, J. Air & Waste Manage. Assoc. 65 (9), 1033–1049 (2015).
- A. Godduhn and L.K. Anna, Environ. Science and Policy 6 (4), 341–353 (2003).
- J.P. Giesy and K. Kannan, Crit. Rev. Toxicol. 28 (6), 511–569 (1998).
- P. Kulkarni, J.G. Crespo and C.A.M Afonso, Environ. Int. 34 (1), 139–153 (2008).
- S. Harrad (Ed), Persistent Organic Pollutants. (John Wiley & Sons, Sussex, UK, 2010).
- C. Pirard, J.F. Focant and E. de Pauw, Anal. Bioanal. Chem. 372, 373–381 (2002).
- D.G. Patterson Jr, H.R. Shirkhan, K. Sadeghi, P.M. Germansderfer, and J.F. Focant, Organohalogen Compounds 71, 2460–2465 (2009).
- W.A Telliard, Tetra- through Octa-Chlorinated Dioxins and Furans by Isotope Dilution HRGC/HRMS, Method 1613, Revision B, (U.S. Environmental Protection Agency, Washington, D.C., 1994).
- R. Reding, B. Englert, Chlorinated Biphenyl Congeners in Water, Soil, Sediment, Biosolids, and Tissue by HRGC/HRMS, Method 1668C, (U.S. Environmental Protection Agency, Washington, D.C., EPA-820-R-10-005, 2010).

Ruud Addink is Technical Director of Toxic Report Laboratories in Watertown, Massachusetts. Direct correspondence to: ruudaddink@toxicreports.com

Tom Hall is Manager of Toxic Report Laboratories and Vice-President of Sales at Fluid Management Systems in Watertown, Massachusetts.
University of Rouen-Normandy Scientists Explore Eco-Friendly Sampling Approach for GC-HRMS
April 17th 2025Root exudates—substances secreted by living plant roots—are challenging to sample, as they are typically extracted using artificial devices and can vary widely in both quantity and composition across plant species.
Sorbonne Researchers Develop Miniaturized GC Detector for VOC Analysis
April 16th 2025A team of scientists from the Paris university developed and optimized MAVERIC, a miniaturized and autonomous gas chromatography (GC) system coupled to a nano-gravimetric detector (NGD) based on a NEMS (nano-electromechanical-system) resonator.
Characterizing Plant Polysaccharides Using Size-Exclusion Chromatography
April 4th 2025With green chemistry becoming more standardized, Leena Pitkänen of Aalto University analyzed how useful size-exclusion chromatography (SEC) and asymmetric flow field-flow fractionation (AF4) could be in characterizing plant polysaccharides.


