Questions of Quality: Where Can I Draw The Line?
Where Can I Draw The Line?
A question that keeps raising its head when working in a regulated laboratory is can chromatographers integrate peaks manually? If they can, when can they do it? Also if they can manually integrate, when should they not do it?
Photo Credit: Claude Dagenais/Getty Images

One of the red rags to a regulatory bull is the issue of manual integration of chromatograms. If seen during an inspection, you can almost see the wheels in the inspector’s brain turn in mechanical precision as they question: are they testing into compliance? In a 2014 FDA inspection of a laboratory in Europe, one FDA 483 observation stated:
No procedure exists describing how to perform manual integration.
A more serious non-compliance occurred in the FDA warning letter to Leiner Health Products (1):
In addition, our investigators documented many instances with extensive manipulation of data with no explanation regarding why the manipulation was conducted. This manipulation would include changing integration parameters or relabelling peaks such that previously resolved peaks would not be integrated and included in the calculation for impurities.
There have been many other cases that I summarized in a recent Questions of Quality column on the role of chromatography data systems (CDS) in data falsification (2). What regulatory guidance is there to help us? We need to consider some basics of integrating chromatographic peaks before we can look at manual integration and the regulatory guidance surrounding it. The reason for this is simple: if integration parameters are set correctly and the chromatography is acceptable then there should be no need to reintegrate manually in many cases. However, we also need to acknowledge that chromatographic systems are dynamic by their nature and separations can change during a run, so getting the right overall integration can be a balancing act.
The regulators are wrong in their requirement for a procedure on manual integration. What is required instead is a standard operating procedure (SOP) for chromatographic integration, of which manual integration is an important sub-set. Although the focus of this column is manual integration please do not lose sight of the bigger picture. As such, we will not be discussing the various calibration methods that could be applied to standards to quantify analytes in samples nor will we be looking at analogue to digital conversion because the latter has been covered in an earlier Questions of Quality column (3). Furthermore we will not be considering the use of system suitability tests (SSTs), again because this column has already discussed them (4–6). The paper by Hill et al. (7) on manual reintegration in bioanalysis is also a highly recommended publication to read on the subject.
Back to Integration Basics
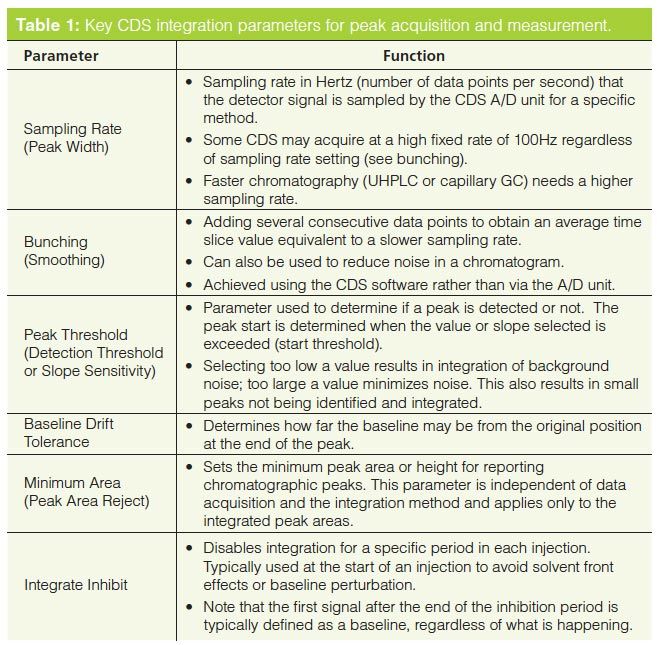
Before we can discuss how to control and manage manual integration it is important to understand the basics of chromatographic integration itself. The best book on the subject of integration is by Norman Dyson (8) and, although the second edition was published in 1998, it is still applicable and highly recommended if you want to understand chromatographic integration. The key integration parameters are shown in Table 1 and the main ones are discussed below. Note that some CDS suppliers may call these parameters a different name but the functionality is essentially the same.
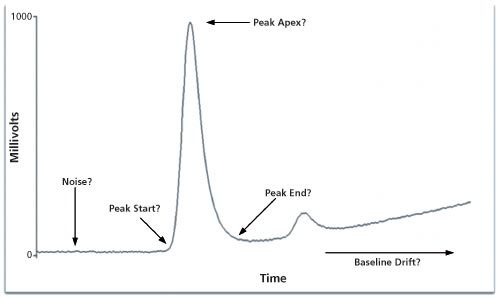
Figure 1: Key parameters for peak integration.
Chromatographic integration begins when the CDS samples the detector output using an analogue to digital converter (A/D). An integration method in the CDS determines the frequency of the detector data collection and analysis run time. Dependent on the CDS, either an integration method or a processing method will be automatically applied to the file of data slices to calculate the peak areas or heights. The processing method will contain the identities of the peaks of interest and their expected elution time windows. These data files and their interpretation constitute part of the raw data and primary record for the analysis. We will discuss the definition of primary record in the next Questions of Quality column (9) in light of the two MHRA data integrity guidance documents issued this year (10,11).
The two most important parameters for integration are sampling rate and peak threshold. In combination they determine the slices for peak measurement but also suppress noise to allow better peak measurement (8).
Peak width or sampling rate setting governs how often the detector output is sampled, which directly impacts the accuracy of peak area measurement. If the sampling rate is too slow it could result in the integration missing a small fast eluting peak or a valley between two peaks. Conversely, too fast a data acquisition rate can be managed by data bunching in the CDS software. Typically you should sample a peak at least 20–30 times across its width so that it can be integrated accurately; for example, conventional high performance liquid chromatography (HPLC) typically requires a 0.5–1 Hz sampling rate, faster capillary gas chromatography (GC) has a sampling rate in the range 5–20 Hz, and ultrahigh-pressure liquid chromatography (UHPLC) needs a sampling rate between 20–50 Hz. Most A/D units in CDS are rated at up to a 100 Hz sampling rate.
- Peak threshold is the setting that discriminates the start and end of a peak from baseline noise. It is based on the rate of change when the detector signal rises above a preset value in the integration method for peak start or falls in the case of peak end. This needs to be set carefully because if the baseline is noisy then noise is detected as peaks; if set too large the integration will miss small peaks because the threshold is not triggered. The same process occurs at peak end but if the threshold is low, too much of the peak tailing is counted. Conversely if the threshold is set too high the peak finishes early, which under-estimates the area of the peak.
- Once the peak has been detected the next step is to determine when it ends. Typically this is when the signal returns to where the baseline was before the peak started but if there are several peaks eluting or the baseline is rising then the signal will not return to the baseline origin. Therefore baseline drift tolerance determines how far the baseline can drift from the original position. This is in contrast to the peak threshold, which determines how fast it can drift away (8).
From this and alongside a more detailed discussion in Dyson’s book (8) we can develop three basic rules of chromatographic integration:
- Rule 1: Do NOT use default integration parameters. Ensure that each set of integration parameters is tailored to an individual analytical procedure and do not use a one-size-fits-all approach. For BeerâLambert’s law to hold, the samples and standards must be consistently integrated, otherwise the fundamental comparison of absorbance versus concentration cannot be performed.
- Rule 2: The function of a CDS is not to compensate for your poor method development or separation. There is a belief in many laboratories that a CDS can be used to salvage an analytical run but this is not the case. Robust and validated methods should reduce or eliminate this issue.
- Rule 3: Understand what is happening in the CDS. Just because you get a number from a CDS does not mean you have to believe the result. Use your eyes to look and your brain to think. For example, look at the integration codes (BB or BV): are these the ones expected? Are baselines positioned where they should be and are they as expected? Are retention times and peak shapes consistent throughout the run?
To complete this overview of CDS integration, please note what Dyson says: improving the chromatography must always take precedence over setting up the CDS (8):
If a chromatographer finds it necessary to tweak the parameters continuously in order to achieve consistent measurement of standard samples, it is a clear indication that more work is needed to bring the instrument and analysis under control.
In essence the likelihood of a Leinerâstyle non-compliance citation (1) is looming. This is because excessive use of manual integration to compensate for poor method development or chromatographic separation increases risk to data integrity (accuracy), and increases time to generate, review, and release results.
How Can Manual Integration Result in Falsification?
Using manual integration to falsify chromatographic data can arise in a number of ways, but the two main ways are:
- Peak Shaving - Manually placing the baselines to reduce the peak area on integration to enhance the analyte amount in a sample (only the standards are shaved) or reduce the amount of analyte reported (by shaving the sample and not the standards). In Figure 2 the first eluting peak has had the baseline manually adjusted to reduce the total peak area.
- Peak Enhancing - Adjusting the baselines for integration to increase the area of a peak. The enhancement of sample areas over the standards can increase the calculated amount in the sample. If reduction is required, the enhancement of the standards only is performed. Figure 2, line 3 shows how the minor or second eluting peak in the chromatogram can be enhanced.
Figure 2 shows the exaggerated enhancement and shaving of peaks but sometimes all that is required is a small change to bring a nonâconforming batch into compliance with a specification. Hence the need to trend analytical results as required under the new revision to EU GMP for Quality Control laboratories (12) to highlight out of expectation (OOE) and out of trend (OOT) results, as well as those that are out of specification (OOS). Results out of trend or expectation may identify the actions of an individual analyst, which may warrant closer inspection.
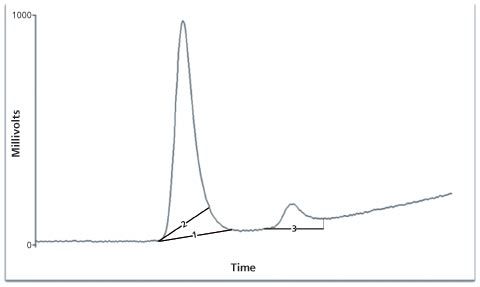
Figure 2: Examples of peak shaving (2) and peak enhancing (3).
In addition, inspectors and auditors will look for a number of factors to determine if there is unauthorized manual manipulation of a peak:
- Discovery of manual integration that is not traceable or retrievable. A chromatographer should be able to demonstrate that same results can be obtained if data files from a run are reprocessed - a red flag should be raised if this cannot be done quickly. An inspector looking to see if the CDS audit trail has been turned off temporarily to conduct falsification could also accompany this
- Electronic data are not available. A focus on paper because the raw data and the electronic records have been deleted or not saved means that data cannot be reprocessed and the result confirmed. The question of falsification is raised and the laboratory is on the slippery slope to compliance hell.
- Integration parameters are different for standards and the unknown samples of the same run or between replicate injections of the same unknown sample in an analytical batch.
- Evidence that the audit trail in the system has been turned off and then on again a few minutes later: what changes have been performed that are not recorded?
GMP Regulations and Regulatory Guidance
Although there is great interest in data integrity in laboratories working under the Good Manufacturing Practice (GMP) regulations, there is a paucity of either explicit regulation or regulatory guidance to help chromatographers.
The only GMP regulations applicable are the requirements for scientifically sound analytical procedures in 21 CFR 160(b) and for complete data under 21 CFR 211.194(a) (13). The latter topic was discussed in two earlier QOQ columns (14,15). In addition, there is data integrity audit under objective 3 in the FDA’s Compliance Policy Guide 7346.832 for pre-approval inspections (16). Both the European Pharmacopoeia (chapter 2.2.46) (17) and the United States Pharmacopoeia <621> (18) discuss criteria for good chromatography; there are no criteria for chromatographic integration or a similar discussion on data integrity. However, in the interest of scientific soundness: can you justify and defend your actions on the basis of good chromatographic science?
In my view, there is a need for regulatory agencies to issue guidance on the subject of integration with a focus on manual integration for GMP. As they typically move at glacial speeds, the likelihood of this occurring before the next ice age is probably minimal. However, there is an area where regulators have been active on the subject of manual reintegration and this is in bioanalysis of samples from non-clinical and clinical studies for the registration of drugs.
Bioanalytical Regulatory Guidance for Reintegration
The FDA created guidance for bioanalytical method validation following an AAPA-FDA conference in Washington in 1990, where I was involved as a co-chair, and the outcome from that meeting was a scientific paper on the subject (19). After a follow-up conference in 1999, the FDA issued Guidance for Industry on Bioanalytical Method Validation (20). In the section dealing with routine analysis of samples there is mention of sample data reintegration:
- An SOP or guideline for sample data reintegration should be established.
- This SOP or guideline should explain the reasons for reintegration and how the reintegration is to be performed. The rationale for reintegration should be clearly described and documented.
- The original and the reintegration data should be reported.
Later in the document, in the section on reports for routine studies, there is another section on Documentation for Reintegrated Data (20), which, in part, requires:
- The method used for reintegration.
- The reason for the reintegration.
- The requestor of the reintegration and the manager authorizing reintegration.
- Reintegration of a clinical or preclinical sample should be performed only under a predefined SOP.
In 2013, the FDA issued a draft revision of this Guidance for Industry where sample data integration was updated (please remember that the guidance is still a draft), but the key requirements are essentially unchanged. There is a rearrangement of the order listed above with the additional need to retain audit trail information from the CDS (21).
At last we are getting somewhere! We now have some guidance albeit in the good laboratory practice (GLP) arena. But wait! There is more! Not to be outdone by their American cousins, the EMA (European Medicines Agency) produced their own guidance document on Bioanalytical Method Validation (22) in 2011. Section 5.5 is concise and devoted to the subject of integration:
- Chromatogram integration and reintegration should be described in a SOP.
- Any deviation from this SOP should be discussed in the analytical report.
- Chromatogram integration parameters and in case of re-integration, initial and the final integration data should be documented at the laboratory and should be available upon request.
Although both the FDA and EMA allow reintegration of chromatograms, it must be under controlled conditions and must be reported in the final report along with who authorized the reintegration and what the original results were together with the need for audit trail entries and justification. Personally, I prefer the European approach because the FDA guidance is over-bureaucratic. This is particularly the case as the FDA requirement for documentation of the requestor and authorization by a manager will have to be outside of a CDS because there are currently no functions available to perform this. If required by regulators this needs to be included as a function in future versions of chromatography data systems.
What is Missing?
In reading both the GMP and GLP regulations, the European and US Pharmacopoeia general chapters on chromatography, and the three bioanalytical method validation guidance documents, it strikes me that there is a fundamental element missing from the equation. The only publications that discuss integration are the bioanalytical method validation guidance documents. However, the focus in all three publications is on the application of a validated method NOT on the validation of the analytical method itself.
It is essential that validation of ANY analytical procedure includes the integration parameters along with other methods measured in any method that utilizes chromatography. Note that the stimulus to the revision paper published in 2013 by Martin et al. (23) for a life cycle approach did not discuss the inclusion of integration parameters (24). I would strongly suggest that the draft general chapters include the requirement for stating integration parameters within the life cycle of analytical procedures involving chromatography.
What is Manual Integration?
So far we have discussed the regulatory issues around peak integration, the main integration parameters, and the three rules of integration so that you have a fighting chance for automatically integrating your peaks and there is no need to intercede manually. However, we now need to turn our attention to manual integration. As we can see from the regulatory citations and the bioanalytical guidance documents, what is needed is an SOP to control, manage, and authorize integration - both automatic and manual.
In an ideal world there would be a definition of manual integration. However, there is not a definition available for manual integration that I could find. Neither in Dyson, nor on any regulatory website. This was the point made by Hill et al. (7), who discussed the scope and terminology of manual reintegration and they concluded that it is essential to develop a consensus with respect to definitions. The problem, they noted, is that that a consensus does not exist.
This raises an important question: if we can’t define manual integration how can we write an SOP on integration as a whole?
Scope of an Integration SOP
In the spirit of the early pioneers, this column will present a possible approach to writing an SOP in the form of a flowchart that will consider some, but not all, options for both automatic and manual integration. Of course, there is a little trepidation because one definition of pioneer is finding new and exotic ways to die (!) However, I hope that this column and my views stimulate a debate about what constitutes manual integration and we can get a definition agreed upon.
In this discussion we need to balance sound science with regulatory compliance. Therefore, let me pose a question - which is worse: not reintegrating when you know the results are wrong or accepting wrong results when you can see an unknown peak in the sample chromatograms? You see the dilemma? We know the outcomes of both situations are undesirable, but as a result of inflexible procedures or fear of the regulations sound scientific judgement cannot be exercised.
First, let us consider a “no manual integration allowed” option. Personally, I think that this is an untenable situation, particularly if a regulated laboratory is using recently developed methods, analyzing impurities where the limits of quantification or detection are close to baseline noise, or investigating stability of products. In these situations, manual reintegration is scientifically sound and defendable provided that it is covered in the integration SOP.
A suggested flowchart for consideration of integration is shown in Figure 3. It begins with the completion of the chromatographic run and the automatic integration of peaks by the original processing method. The resulting chromatograms are reviewed by the chromatographer to see if retention times and peak shapes are as expected, the peak(s) have been correctly identified, baseline placement is as required by the analytical procedure, and the sample is integrated consistently with the standard. There may be other criteria that an individual laboratory wishes to apply. We now come to a decision point: is the run acceptable? If yes the individual results and the reportable value are calculated and all is well. All data at this point have been calculated automatically by the CDS, the chromatographer is merely confirming what the software has done conforms to pre-defined expectations.
However, if the integration is not acceptable we move to a second decision point: is manual integration (whatever that term may cover) permitted for this analytical procedure? If not the next stage is a laboratory investigation. What methods could we consider for inclusion for no manual integration? Perhaps measurement of active pharmaceutical ingredients (APIs) or registered methods for finished product for the active ingredient? If these peaks cannot be integrated correctly are you out of control? We will consider if this is tenable when we have finished discussing the flowchart.
In my view, manual integration must be specifically prohibited in the following circumstances:
- Symmetrical peaks that have acceptable baseline to baseline fitting following automatic integration.
- Enhancing or shaving peak areas to meet SST acceptance criteria or allowing a run to meet the test specification.
Now we come to what constitutes “manual integration”. Figure 3 presents three options that I have selected for discussion, your laboratory SOP may have more areas depending on the work performed. The outcome you require is consistent and appropriate manual integration that is scientifically defensible. Therefore, you need to avoid situations where you have inconsistent or inappropriate integration.
Manual Intervention Versus Manual Integration
In Figure 3 options 1 and 2 are shown as manual intervention and option 3 as manual integration. Let me clarify my reasoning.
- Option 1: Peaks have slipped out of a window and they are not correctly identified. The automatic integration is acceptable and all that is required is to change the peak windows in the integration method and reprocess. Peak areas are not changed by this approach.
- Option 2: Parameters in the integration or processing method need to be adjusted and then applied to all injections in the run. An example could be change of the peak threshold or minimum area to reduce the impact of baseline noise. Peak areas may or may not be changed under this option but there is no manual placement of the baselines by an analyst.
- Option 3: Manual placement of baselines by the chromatographer is required because of a late running peak or noise if undertaking an impurity analysis. Peaks areas will be changed by the reintegration.
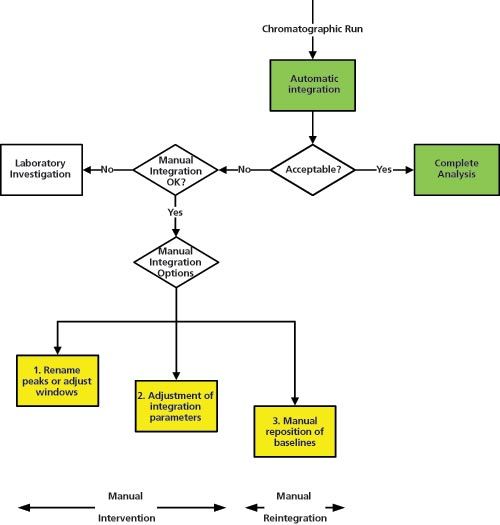
Figure 3: A suggested flow chart for manual intervention and manual integration.
Note that the three options in Figure 3 are shown on three different levels. This is my way of illustrating the descent into manual integration hell. In the first option you may think of as purgatory, the second as limbo while the third option is; well, you get the idea.
Options 1 and 2 are manual intervention but the baseline placement is performed by the CDS and is not altered by a chromatographer. These are the preferred options and easier to justify scientifically. Option 3 is where everything else has failed and a chromatographer goes through individual chromatograms and repositions the baselines where appropriate. This latter point is important, it is an exercise of scientific judgement that needs to be backed up by the procedures within the integration SOP.
It’s All Plain Sailing Now?
Let us return to the scenario we discussed earlier at the top of the flowchart in Figure 3. If the automatic integration has failed because the peaks have slipped out of the retention windows (option 1 in the manual intervention section) do you want to trigger a laboratory investigation? Especially when the peak windows are readjusted and, after reintegration, the run now passes. The peaks are now correctly labelled and the peak areas are unchanged after the manual intervention. Although the FDA classifies this situation under “manual integration”, there is no change to the actual measurement of the peaks of interest. Should this situation be classified as manual integration? In my opinion no – this is a manual intervention but not reintegration. This is not intended to be word play but a means of trying to define exactly what the regulators want in light of zero guidance and multiple citations on the subject. Furthermore, because there is no agreed definition of the term we have a problem – would this be permitted? Would you take the Clint Eastwood approach to risk management by feeling lucky or could you justify that this is an acceptable practice?
Ideally the SST, standards, and QC samples should be integrated the same way consistently throughout the run; however, this may not be the case, particularly near limits of quantification or detection. Let us look at a different situation that can arise when operational efficiency is considered and different material types are analyzed in a single run. Although the method is validated for these different sample types, there can be differences in the chromatography that require different integration parameters. So how can you apply the same integration parameters across the run? The classic example is mixing APIs and stability samples where the methods have different aims; for example, determination of purity versus degradation. Perhaps the case of data integrity should win over operational efficiency and it would be better to separate different types of analytical procedure?
Regardless of the content of the final SOP, chromatographers must be trained to perform manual integration using a scientifically sound, justifiable, and transparent process. We are looking at consistency of an integration technique among all trainees to ensure a consistent approach, which can be provided via a CDS by copying methods and chromatograms to a training project or directory and allowing chromatographers to integrate the same files. One outcome of the training is that trained chromatographers will think about where they place a baseline when manually integrating a peak so that it is scientifically justified and complies with the laboratory procedure.
Another outcome of the training is that all trainees must understand that unauthorized manual integration outside of the scope of the SOP is considered as data falsification. The more times that a run is reprocessed either via manual intervention or manual integration the more quality assurance and regulatory scrutiny it will attract, that is, the larger the size of the red rag. Unfortunately large red rags are not very effective at stopping regulatory bulls.
As a final comment, chromatographic integration should be included in the data integrity self-inspections to ensure that the training and procedure are being complied with in operational use.
Summary
We have discussed manual integration in the context of a regulated laboratory and have found a number of problems. Regulations and guidance are lacking in GMP and the only guidance on the subject is for regulated bioanalytical laboratories, which can result in an overly bureaucratic approach. However, we lack an agreed definition of what constitutes manual integration. Notwithstanding this minor problem, a suggested workflow for determining how manual intervention and manual integration can be combined in an overarching SOP on chromatographic integration to meet regulatory concerns. I hope this will stimulate a debate to define what constitutes manual integration and that regulatory agencies will provide guidance on the subject - eventually.
Acknowledgements
I would like to thank Chris Burgess, Howard Hill, Brian Jones, Mark Newton, and Paul Smith for advice and comments made during the preparation of this column.
References
- Leiner Health Products, FDA Warning Letter (Aug 2007)
- R.D. McDowall, LCGC Europe27(9), 486–492 (2014).
- C. Burgess, D.G. Jones, and R.D. McDowall, LCGC International 10(12), 791–796 (1997).
- R.D. McDowall, LCGC Europe23(7), 368–374 (2010).
- R.D. McDowall, LCGC Europe23(11) 585–589 (2010).
- L. Kaminski et al., LCGC Europe24(8), 418–422 (2011).
- H.M. Hill, D. Bakes, and I. Love, Bioanalysis6(9), 1171–1174 (2014)
- N. Dyson, Chromatographic Integration Methods. Second Edition (Royal Society of Chemistry, Cambridge, UK, 1998).
- C. Burgess and R.D. McDowall, LCGC Europe, in preparation
- MHRA GMP Data Integrity Definitions and Guidance for Industry, Medicines and Healthcare products Regulatory Agency, London (January 2015).
- MHRA GMP Data Integrity Definitions and Guidance for Industry, Medicines and Healthcare products Regulatory Agency, London (March 2015).
- EU GMP Chapter 6 on Quality Control (2014).
- FDA Current Good Manufacturing Practice for Finished Pharmaceutical Products, 21 CFR 211 (2009).
- R.D. McDowall, LCGC Europe 26(6), 338–343 (2013).
- R.D. McDowall, LCGC Europe26(7), 389–392 (2013)
- FDA Compliance Program Guide 7346.832 Pre Approval Inspections (2010, effective 2012).
- European Pharmacopoeia 2.2.46 Chromatographic Separation Techniques
- United States Pharmacopoeia <621> Chromatography (United States Pharmacopeial Convention, Rockville, MD, USA).
- V.P. Shah et al., Pharmaceutical Research9, 588–592 (1992)
- FDA Guidance for Industry, Bioanalytical Methods Validation. FDA, Rockville, MD, USA (2001).
- FDA Draft Guidance for Industry, Bioanalytical Methods Validation. FDA, Rockville, MD, USA (2013).
- European Medicines Agency, Committee for Medicinal Products for Human Use. Guideline on Bioanalytical Methods Validation. European Medicines Agency, London, UK (2011).
- G.P. Martin et al., Pharmacopoeial Forum 39(5), (September–October 2013) (Available on-line at www.usp.org).
- R.D. McDowall, LCGC Europe 27(2), 91–97 (2014).
“Questions of Quality” editor Bob McDowall is Director at R.D. McDowall Ltd, Bromley, Kent, UK. He is also a member of LCGCEurope’s editorial advisory board. Direct correspondence about this column should be addressed to the editor-in-chief, Alasdair Matheson, at amatheson@advanstar.com

Study Explores Thin-Film Extraction of Biogenic Amines via HPLC-MS/MS
March 27th 2025Scientists from Tabriz University and the University of Tabriz explored cellulose acetate-UiO-66-COOH as an affordable coating sorbent for thin film extraction of biogenic amines from cheese and alcohol-free beverages using HPLC-MS/MS.
Multi-Step Preparative LC–MS Workflow for Peptide Purification
March 21st 2025This article introduces a multi-step preparative purification workflow for synthetic peptides using liquid chromatography–mass spectrometry (LC–MS). The process involves optimizing separation conditions, scaling-up, fractionating, and confirming purity and recovery, using a single LC–MS system. High purity and recovery rates for synthetic peptides such as parathormone (PTH) are achieved. The method allows efficient purification and accurate confirmation of peptide synthesis and is suitable for handling complex preparative purification tasks.


