The Power of Mobile Phase Strength
After you have worked with liquid chromatography (LC) for several years, adjustment of the mobile phase to move peaks around comes almost as second nature. To the newcomer, however, such changes border on magic. One of the rules of thumb that I teach in my short courses is "nothing's magic". This is meant to remind us that chromatography is a very systematic process - study it carefully and you will minimize your surprises. In this month's instalment of "LC Troubleshooting," we'll look at solvent strength and see how we can use it to make predictable changes in the peak movement for reversed-phase LC separations. Hopefully, you will be able to make some practical use out of the principles presented here the next time you need to develop or adjust a method.
After you have worked with liquid chromatography (LC) for several years, adjustment of the mobile phase to move peaks around comes almost as second nature. To the newcomer, however, such changes border on magic. One of the rules of thumb that I teach in my short courses is "nothing's magic". This is meant to remind us that chromatography is a very systematic process — study it carefully and you will minimize your surprises. In this month's instalment of "LC Troubleshooting," we'll look at solvent strength and see how we can use it to make predictable changes in the peak movement for reversed-phase LC separations. Hopefully, you will be able to make some practical use out of the principles presented here the next time you need to develop or adjust a method.

Figure 1
Solvent Strength
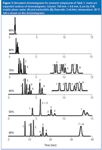
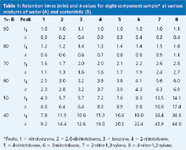
Solvent strength refers to the ability of a solvent to elute compounds more quickly from the column. For reversed-phase separations, the organic phase is the strong solvent — most commonly acetonitrile or methanol. The aqueous phase, in contrast, is a weak solvent. The most common convention is to refer to the weak solvent as the A-solvent (%A) and the strong solvent as the B-solvent (%B). The mobile phase is usually a blend of the A- and B-solvents; for example, 40% buffer and 60% methanol (abbreviated 60% B). We'll look only at isocratic separations this month — those in which there is no change in mobile phase composition during the separation. A good way for the beginner to learn about mobile phase strength is to make a series of runs with different %B mobile phases, using well-behaved compounds on a C18 column. An alternative is to use one of the retention modelling software programs, such as DryLab software (Rheodyne, Rohnert Park, California, USA). You usually can get a free copy of a demonstration version of the software that contains standard samples that you can manipulate with the software. This is the approach I took to generate the chromatograms of Figure 1 and corresponding data of Table 1.

Table 1: Retention times (min) and k-values for eight-component sample* at various mixtures of water (A) and acetonitrile (B).
Where to Start?
The first question is where to start? We can start our experiments with any %B, so at first glance, it might make sense to start at 50% B — after all, this is the middle of the range, so we should have equal probability of finding the best mobile phase above or below 50% — right? Wrong! The problem with this approach is that often we have no way of predicting retention without first doing an experiment or two. An arbitrary middle-of-the-road solvent strength might not elute all our compounds, yet we wouldn't know it. A better approach is to start at a strong solvent, even though it is highly likely that this condition will be too strong. So start at 100% or 90% B. The chromatogram for 90% B in Figure 1 is typical of what we might find. All the sample components come off the column so fast that it is hard to determine how many are present. However, from the appearance of the chromatogram, we're pretty sure that everything has been eluted under these conditions. On the plus side, however, the experiment didn't take very long.
Where next? One effective approach to method development is to step back in 10% B increments from a strong solvent until the desired chromatogram is obtained. The chromatograms for 90% down to 40% B are shown in Figure 1. Note that all of these are plotted on the same time scale except 40%, which uses a 40 min, rather than 15 min run time. A careful study of these chromatograms can give us much useful instruction.
Retention and %B
First, let's consider what happens to retention time as we change %B. Pick a peak from the chromatogram or Table 1 and you can see that as %B decreases, retention time increases. Nothing's magic — peaks don't move to longer retention times, then suddenly change direction — they move in a very regular fashion. In fact, the regularity of this change in retention for reversed-phase separations is so systematic that we have another rule of thumb for this. The Rule of Three states that for each 10% change in %B, retention changes by approximately threefold. Actually, it can be 2.5 fold or fourfold for a given compound, but threefold is a good generalization. Let's see how this works — look at the retention times for peak 8 in Table 1. Starting at 80% B, where we are beginning to see some peak movement: 1.6, 2.8, 6.0, 14.1 and 34.6 min for successive 10% B steps. This gives retention time ratios of 1.8, 2.1, 2.3 and 2.5, respectively. This doesn't seem very constant, does it? As a general rule, it is better to compare values of the retention factor k than retention times. The retention factor (formerly called the capacity factor k9) is calculated as follows:

where tR is the retention time and to is the column dead time, both measured in the same units (for example, minutes or seconds). The dead time is the time it takes an unretained substance to pass through the column, and can be measured by injecting an unretained material, such as uracil at > 70% B. An alternative is to estimate to as 0.01L/F for a 4.6 mm i.d. column, where L is the column length in millimetres and F is the mobile phase flow-rate in millilitres per minute. So for the 150 mm × 4.6 mm column used for the runs of Figure 1, (0.01)(150)/(2) = 0.75 min, which is very close to the measured value of 0.77 min.
So now, armed with k-values for all the peaks (see Table 1), we can check the rule of three again for k rather than retention time. We see 1.1, 2.7, 6.9, 17.4 and 44.0 for k-values from 80% to 40% B. The ratios are now 2.5, 2.6, 2.5 and 2.5, respectively — much more consistent than retention time ratios. You can check the ratios for the other peaks in Table 1 and see that most fall in the 2.0–2.5 range for this set of compounds — not quite 3, but the rule of three is close enough for estimates.
So what does this relationship buy us? It can save us time in our method-development strategy. If we estimate a threefold increase in retention (k) for each 10% change in % B, we can guess what will happen for the next step based upon the results for one experiment. For the 90% B run, all the peaks come out way too early and we can guess that 80% will not give sufficient retention, so we can skip 80% and go directly to 70% B. How much change should a 20% B adjustment make? Not 3 + 3, but 3 × 3, or ninefold change in retention (I usually round this to 10 fold for ease of mental calculations). Once we begin to see the peaks separating, as at 70% B, it is best not to make changes of more than 10%.
Another generalization that can be made is that we will generally get the best chromatographic behaviour if all the peaks are eluted in a range of 2 < k < 10, but because, for many samples, it is not possible to get all peaks within this range, we'll settle for 1 < k < 20. Smaller k-values tend to make the peaks run into the junk eluted at to in many samples; larger than k &απoσ; 20, and the peaks become so broad that they become hard to detect. From the data in Table 1, we need to operate somewhere in the 50–70% B range to obtain 1 < k < 20 for all peaks.
Resolution and %B
As discussed previously, retention times increase as the mobile phase strength decreases (lower %B), and you probably noticed that the overall separation improved, too. Look at the separation of peaks 5 and 6 as the mobile phase is changed from 60% to 50% to 40% B — it gradually improves. However, this is one of those general rules that doesn't necessarily hold for individual peak pairs. For example, peaks 7 and 8. Although the retention time increases, moving from 70% B to 40% B, these peaks move closer and closer together until they are merged into a single peak at 40% B. How about our "nothing's magic" principle here? We see peaks 7 and 8 move closer, then merge. What would happen if we continued to try a weaker and weaker mobile phase? Would they reverse order? Yes, they would, and we can see this by looking at the retention time data for peaks 2 and 3 in Table 1. We can see that at 90% down to 60% B, peak 2 is eluted first, and at 50% B, the two peaks are both eluted at 5.7 min. A further change to 40% B causes the peaks to reverse order — peak 3 now comes out first. So our nothing's magic rule holds — peak 3 moves forward relative to peak 2 as weaker and weaker mobile phases are tried.
Note another regular pattern: as %B is decreased, peak width increases. Peak area should be constant, so broader peaks mean they will be shorter and, thus, harder to detect. At sufficiently weak mobile phases, the late-eluted peaks will be so broad that they will be hard to distinguish from the relatively noisy baseline in a real chromatogram.
Critical Peak Pairs and %B
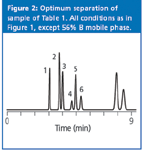
When we examine chromatograms to determine which one is best, our eye should focus on the critical peak pair in each separation. The critical pair is the pair of peaks that is the least separated. Obvious instances are peaks 7 and 8 at 40% B, and 2 and 3 at 50% B. For 60%, it is harder to tell from the full chromatogram, but the expanded inset for peaks 1–6 makes it obvious that peaks 4 and 5 are the critical pair here. For 70%, the expanded chromatogram shows that, although peaks 4 and 5 are not resolved to the baseline, peaks 3 and 4 overlap completely (also see Table 1), so they are the critical pair. When the critical peak pair changes from one condition to another, an intermediate condition will give a better separation than either of the two bracketing ones. Between 70% and 60% B, peaks 4 and 5 will still be separated poorly, because they are not well separated at either 70% or 60% B. The same holds for peaks 7 and 8 between 50% and 40% B. Between 60% and 50% B, we would expect a better separation of peaks 4 and 5 than at 60% B and better separation of peaks 2 and 3, and 7 and 8 than at 50% B. So we would expect the best overall separation somewhere between 60% and 50% B. The best separation is obtained at 56% B for this example, as seen in Figure 2. Higher % B compromises the separation of peaks 4 and 5, whereas lower % B degrades the separation of peaks 2 and 3. As expected with regular peak movements when % B is changed, the run time for Figure 2 is between that of the 60% and 50% B runs of Figure 1.

Figure 2
log k Versus %B
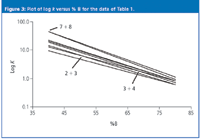
The regular movement of peaks with a change in % B can be expressed in another way. As shown in Figure 3, a plot of log k versus % B for the eight peaks gives plots that are approximately linear. The lines are generally parallel, and this pattern of similar slopes give rise to the rule of three. However, because the lines are not exactly parallel, different values of % B will result in changes in peak separation. The points at which the lines intersect correspond to conditions of complete peak overlap that are seen in the chromatograms: 40% (7 + 8), 50% (2 + 3) and 70% (3 + 4). Plots such as those shown in Figure 3 can be constructed from data from two experimental runs and allow us to predict retention for conditions other than the input runs. We can also use the plot to find conditions for which we can obtain 2 < k < 10 (or 1 < k < 20) for our compounds.

Figure 3
Summary
Several principles have been presented that will help you develop or modify LC methods. A general strategy is to begin method development with a high-% B mobile phase, then work to weaker mobile phases in a stepwise fashion. The regular movement of peaks and the rule of three will help you quickly find conditions that give reasonable retention. By keeping track of critical peak pairs and watching how they change with changes in % B, you can find conditions intermediate to your experimental runs that can give a better separation. Because the relationship between log k and % B is approximately linear, we can leverage a limited number of experimental runs to help us identify regions of peak overlap, mobile phase strengths that will give favourable k-values, and predict retention for conditions we have not yet run experimentally.
"LC Troubleshooting" editor John W. Dolan is vice-president of LC Resources, Walnut Creek, California, USA; and a member of the Editorial Advisory Board of LCGC Europe. Direct correspondence about this column to "LC Troubleshooting", LCGC Europe, Advanstar House, Park West, Sealand Road, Chester CH1 4RN, UK.
Readers can also direct questions to the Chromatography Forum at http://www.chromforum.com


