Optimization of Determination Method of Cooling Agents in Cigarette Tipping Paper by Gas Chromatography
Monitoring the characteristic components in tipping paper is important to ensure the quality of cigarette products. This study establishes a method based on gas chromatography (GC) for determining cooling agents in tipping paper. The tipping paper was cut into pieces and extracted by ethanol under specific temperatures in a shaker. Then, the characteristic cooling agents of (-)-menthone, L-menthol, and (-)-menthyl lactate in extract were determined using GC coupled with a flame ionization detector (GC-FID). The limits of detection (LODs) and limits of quantification (LOQs) for the three cooling agents ranged from 0.15~0.32 μg/mL and 0.49~1.06 μg/mL, respectively. Results demonstrated a good linear relationship with high correlation coefficients for the three tested cooling agents. The extraction conditions of the cooling agents were optimized through a single-factor experiment as well as an orthogonal experiment. The standard addition recovery experiment showed that the average recoveries range from 81.23 to 100.62%, and the relative standard deviations (RSDs) of the measured values (n = 5) ranged from 0.34 to 1.64%.
Recently, because of the heightened attention on smoking and health issues, low-tar and low-harm cigarettes have gradually attracted more consumers (1,2). However, the reduction of tar will inevitably lighten the cigarette aroma (3). Thus, it is necessary to increase the aroma concentra- tion of a burning cigarette to improve the smoking taste by adding different flavoring methods. Cigarette flavoring is an important method to improve the smoking quality of the cigarette product, and it can improve the taste and endow the cigarettes with an unique characteristic flavor.
Cigarette flavoring technology mainly includes filter tip flavoring (4,5), cut tobacco flavoring, cigarette paper flavoring, and forming paper flavoring. Among the different flavoring methods, adding flavor compounds to tipping paper is a newly developed method to improve the product quality. The flavor compounds in tipping paper are not involved in the combustion and pyrolysis process of cigarette, but are involved once the cigarette directly makes contact with the lips. This way, the flavor compounds that dissolved in the mouth interact with the cigarette smoke and provide a characteristic taste.
Cooling agents are commonly used flavor compounds in tipping paper. The cooling agents could give a cool effect to the consumer’s feeling. At the same time, many people assert that cooling agents improved the taste of cigarettes, with participants describing the flavor as “fresh,” “refreshing,” “like a blast of mint,” and “not as bitter” as regular cigarettes. The introduction of cooling agents sometimes can mask the bitterness of the smoke and improve the coordination and softness of the smoke (6). The commonly used cooling agents in the tobacco industry include L-menthol, isopulegol, menthone, menthyl lactate, menthone glycerol ketal, or a combination of a few cooling agents for a better taste.
Many studies have shown that the type and amount of flavoring have a great impact on the flavor style of cigarettes (7–9). Cooling agents are also a considered a kind of combined flavor and fragrance. Several methods have been established for the analysis of cooling agents in mint plants (10), medicine (11), food (12), and tobacco (13). In addition, the detection methods used in the above studies mainly include high performance liquid chromatography (HPLC) coupled with a fluorimetric or polarized photometric detector and gas chromatography–mass spectrometry (GC–MS). Nowadays, artificial taste and smell evaluations are commonly used methods to monitor the quality and stability of cigarette tipping paper. The quantitative detection method for multiple cooling agents in tipping paper is lacking and is unfavorable for the product quality control (QC). Among these methods, GC is an efficient analysis technology with its advantages of high separation and detection efficiency, and the technique is widely used and praised for its simple operation and easy maintenance. Therefore, it is highly desirable and feasible to establish and monitor the characteristic cooling components in tipping paper by adopting the GC technique.
In this study, a solvent extraction method was used to extract the cooling agents in tipping paper and GC coupled with a flame ionization detector (GC-FID) was employed to establish a quantitative detection method for determining cooling agents. The extraction conditions of cooling agents were optimized through single-factor experiment and orthogonal experiment design (OED). The established method exhibited good applicability for analyzing cooling agents in some flavor functional tipping paper brands on the market.
Materials and Methods
Materials
Ethanol, methanol, acetonitrile, dichloromethane, isopropanol, and n-hexane (all chromatographically pure) were obtained from Sinopharm Chemical Regent Co., Ltd. Phenyl acetate (purity >98%), (-)-menthone, L-menthol, and (-)-menthyl lactate (purity >98%) were purchased from Beijing Bailingwei Technology Reagent Co., Ltd. Tipping paper was supplied by Nanjing Jinling Gold Foil Group Co., Ltd.
Instrumentation and Chromatographic Conditions Apparatus
The S152TPS3-1 Shredder (Deli Group), ME104E Electronic Balance (Mettler Toledo), HZQ-F160 Full Temperature Shaking Incubator (Taicang Experimental Equipment), and the KQ5200DE CNC Ultrasonic Cleaner (Kunshan Ultrasonic Equipment) were used for the sample preparation. A 7890B gas chromatograph (Agilent Technologies) equipped with a FID detector was used to detect the cooling agents. The separations were carried out in an HP-5MS column (30 m × 250 μm × 0.25 μm, Agilent Technologies).
The chromatographic separation was carried out in gradient elution with a carrier gas of N2 as follows: the initial temperature was 50 °C for 2 min; the temperature was then increased to 230 °C at a rate of 5 °C/min and kept for 2 min. The inlet temperature and detector temperature were all set at 250 °C. The flow rate of carrier gas was maintained at a flow rate of 1 mL/min. The split ratio was set at 15:1, and the injection volume of sample was 1 μL.
Sample Preparation
Preparation of the Standard Solution
To prepare the standard solution, 0.2 g of phenyl acetate (internal standard) was diluted with ethanol in a glass volumetric flask to obtain an internal standard solution with a concentration of 0.2 mg/mL. The standard stock solutions of the three cooling agents were prepared as follows: weigh 15 mg (-)-menthone, 85 mg L-menthol, and 15 mg (-)-menthyl lactate and dilute them into a 10 mL volumetric flask with the internal standard solution. The standard stock solution was used to gradually dilute into the standard working solution. The concentration of (-)-menthone and (-)-menthyl lactate was 7.5, 15.0, 30.0, 120.0, 300.0, 600.0, and 1500.0 μg/mL, and the concentration of L-menthol was 42.5, 85.0, 170.0, 680.0, 1700.0, 3400.0, and 8500.0 μg/mL. All the standard solutions were stored in a refrigerator at 3 °C.
Extraction of Cooling Agents
The tipping paper was cut using a shredder to generate fragments of 5 mm × 5 mm. A weight of 1.00 g tipping paper fragments was put into a 50 mL erlenmeyer flask with a stopper, and 25 mL of the internal standard solution was added. Subsequently, the mixture was placed into a shaker with a preset temperature of 30 °C and a rate of 160 r/min for 25 min. After that, a proper amount of the extract was filtered through a 0.45 μm filter membrane, and the sample was analyzed by GC according to the above chromatographic conditions. The obtained data was processed by Agilent GC–MS data analysis software and quantified by the internal standard method.
Optimization of the Extraction Method
To obtain the highest extraction efficiency, the effects of different solvents (ethanol, methanol, acetonitrile, dichloromethane, isopropanol, and n-hexane), auxiliary extraction methods (ultrasound and shaker), extraction times (20, 25, 30, 35, and 40 min), solvent volumes (10, 15, 20, 25, and 30 mL), extraction temperatures (20, 30, 40, 50, and 60 °C), and rotation rates (120, 140, 160, 180, and 200 r/min) on the extraction yield were studied through single-factor experiments. All the extraction experiments were performed three times to ensure repeatability. The OED were carried out based on the results of single-factor experiments. A four-factor, three-level orthogonal array design was used to evaluate the effects of the following factors on the extraction content: extraction time, solvent volume, extraction temperature, and rotation rate.
Calibration Curve and Validation of the Method
The analytical calibration curve was constructed by internal standardization through a series of standard working solutions. The limits of detection (LODs) and limits of quantification (LOQs) were calculated through the standard deviation of the response according to previous study (n = 10) (14,15,16).
The recovery was performed by adding three different concentration levels standard at sample with five replicates. The relative standard deviation (RSD) of five parallel experiments indicates the precision of the method.
Results and Discussion
Establishment of Detection Method Chromatographic Behavior
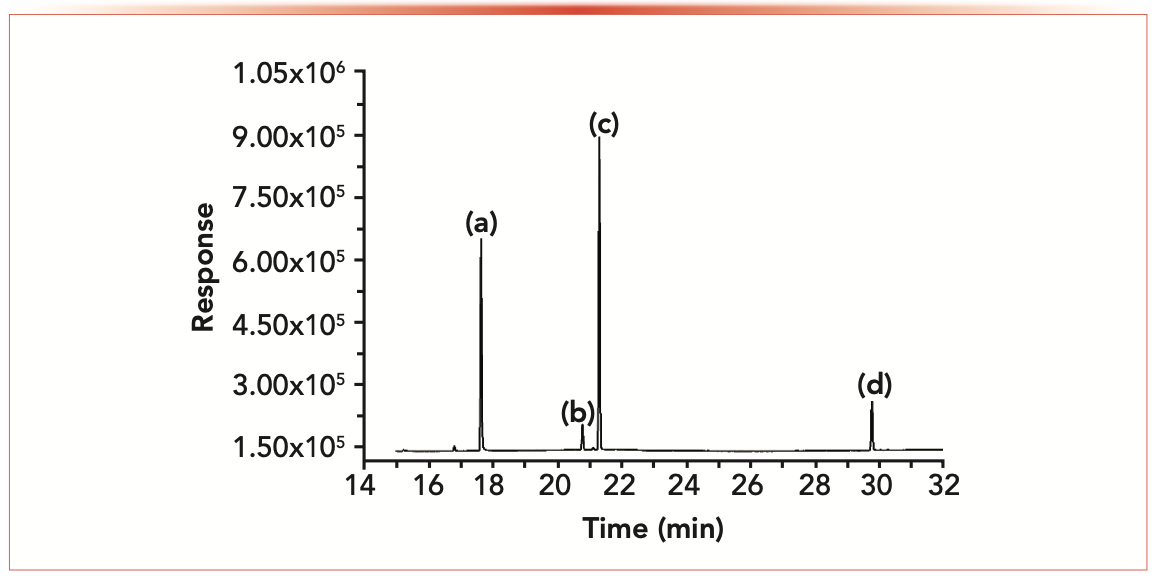
The chromatographic separation conditions were optimized by using the mixture of standard solution of three cooling agents. Under the optimal conditions, the typical chromatograms of the three cooling agents and internal standard substances in the sample are shown in Figure 1. The peaks of analyte were well resolved without tailing. The retention time of phenyl acetate, (-)-menthone, L-menthol and (-)-menthyl lactate were 17.65, 21.23, 21.78, and 30.23 min, respectively.
FIGURE 1: Chromatogram of three cooling agents and internal standard substances in the sample. Peak identification: (a) phenyl acetate, (b) (-)-menthone, (c) L-menthol, and (d) (-)-menthyl lactate.
Calibration Curve and LOD/LOQ
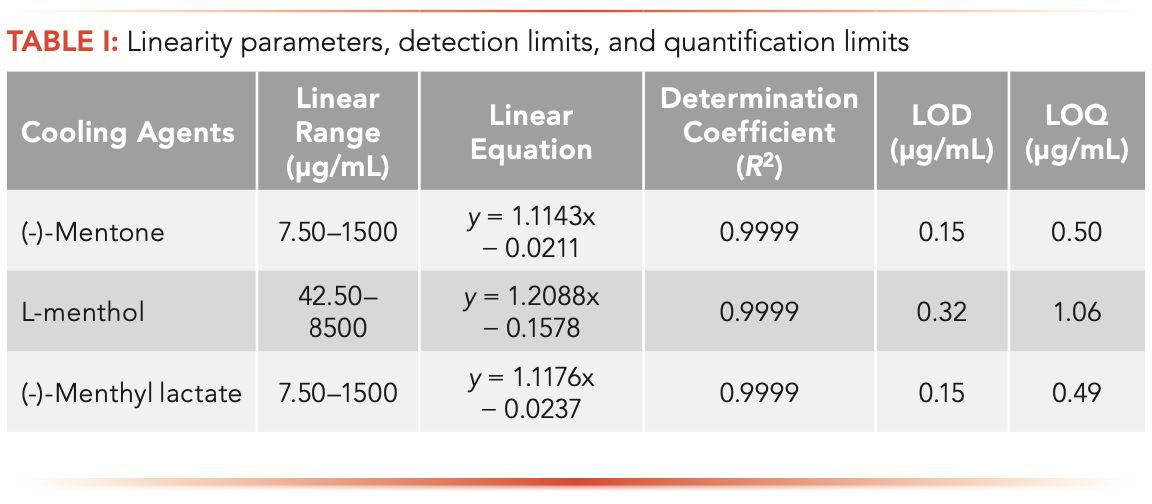
A series of mixed standard solutions of the three cooling agents with specific concentrations were analyzed through GC-FID under the optimized conditions. A linear response was obtained between the concentration ratio of cooling agent to the internal standard substance and the correspond peak area ratio. Table I summarized the linear equation for different cooling agents and their LODs and LOQs. The correlation coefficients (R2) were relatively high (>0.999), indicating an appreciable applicability. The LOD and LOQ for (-)-mentone was 0.15 μg/mL and 0.50 μg/ mL. For L-menthol, the LOD and LOQ was 0.32 μg/mL and 1.06 μg/mL. The LOD and LOQ for (-)-menthyl lactate was similar to (-)-mentone. The LOD and LOQ of menthol in this study were much lower than that of menthol in pharmaceutical suppositories detected also by using GC-FID (17). These results demonstrate a good applicability for the quantitative analysis of cooling agents in tipping paper.
Optimization of the Extraction Method
Comparison of Extraction Methods
Effective pretreatment of the tipping paper was required to ensure the determination accuracy of the cooling agents in tipping paper. Generally, simultaneous distillation extraction method could lead to the volatilization of cooling agents because of its heat-sensitive property. Herein, the solvent extraction method, including shaker oscillation and ultrasonic-assisted extraction, was used to compare the extraction efficiency of cooling agents. The results showed that the extracted total amount of cooling agents were 6.16 mg/g and 6.03 mg/g under the shaker and ultrasonic-assisted method, respectively. The ultrasonic cavitation effect could have resulted in the loss of cooling agents (18,19); therefore, shaker oscillation extraction was used for the next experiment.
Selection of Extraction Solvent
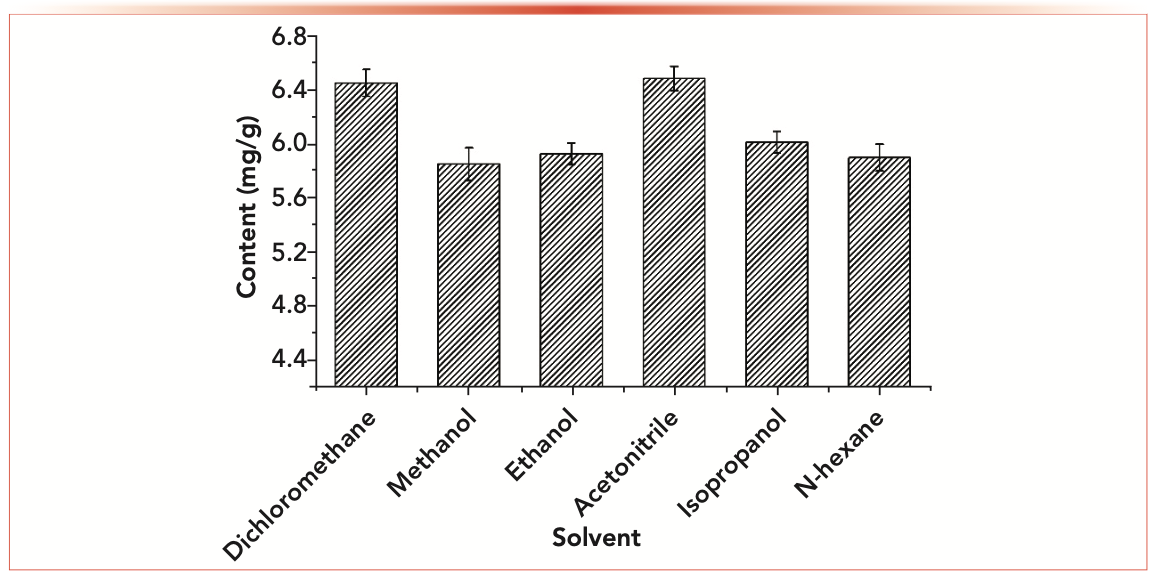
The effect of different solvents, including methanol, ethanol, acetonitrile, isopropanol, dichloromethane, and n-hexane, on the extraction contents of cooling agents from tipping paper was investigated. The extraction contents of the three cooling agents using different solvents are shown in Figure 2. The extraction content difference of the six extraction solvents was not obvious, but in the order of acetonitrile, dichloromethane, isopropanol, ethanol, n-hexane, and methanol. The extraction contents of acetonitrile, isopropanol, and dichloromethane were slightly higher. However, acetonitrile is moderately toxic, and isopropanol easily generates peroxides. The boiling point of dichloromethane is approximately 39.8 °C, which is also the reason for the large extraction amount. The extraction contents of methanol and n-hexane are worse than that of ethanol. After comprehensive consideration, ethanol was selected for the experiments.
FIGURE 2: The effects of extraction solvent on the extraction contents (n = 3).
Optimization of Shaker Conditions
Four main parameters, including the volume of extraction solvent, time of extraction, temperature of extraction, and rotation rate of shaker, were considered for the optimization of shaker conditions. The result was shown in Figure 3.
FIGURE 3: Influence of (a–d) four factors on the extraction effect of cooling agents (n = 3).
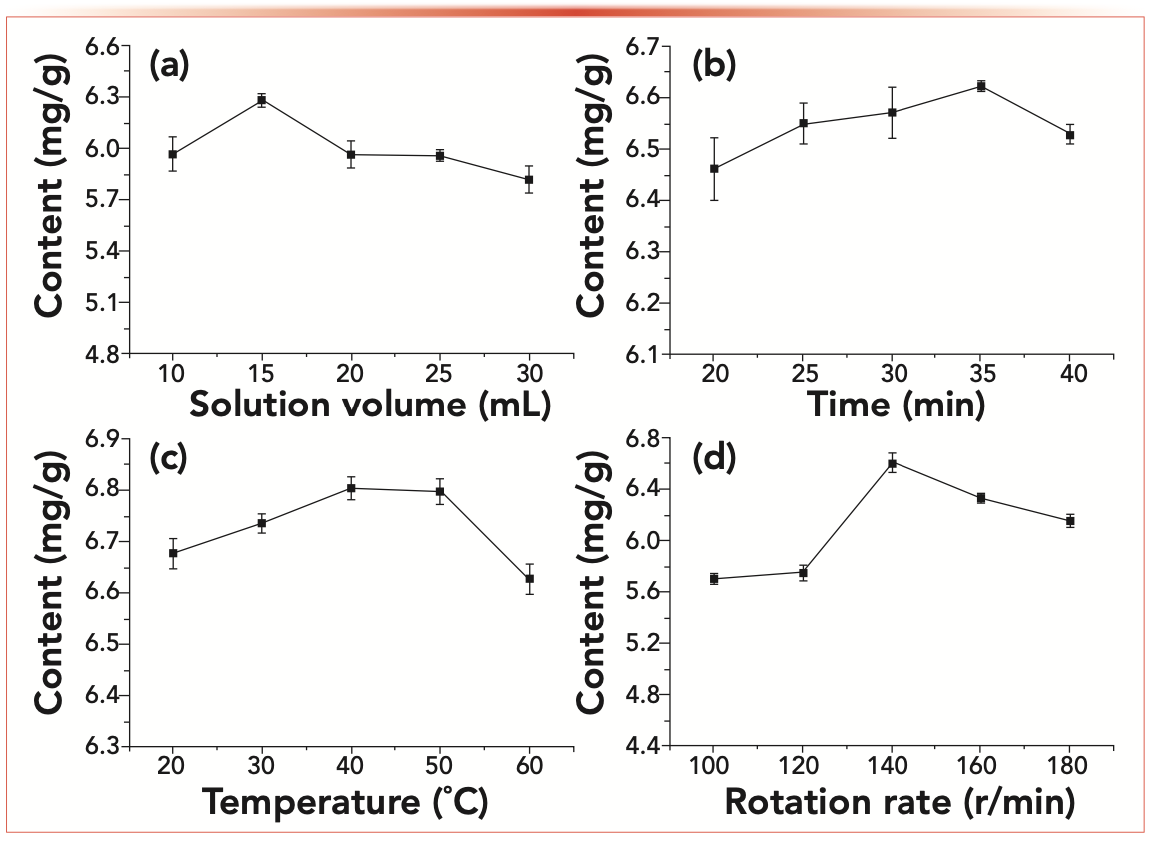
To study the effect of the extraction solution volume on the extraction contents of total cooling agents, the volume of the extraction solution was increased from 10 mL to 30 mL at 5 mL intervals. The results are shown in Figure 3a. It can be seen that the extraction contents of cooling agents exhibited a trend of first increasing and then decreasing, accompanied with the maximum value at the volume of 15 mL, which may be an increase in the solvent-to-sample ratio that helps the solute dissolve in solvent (20,21). The decreasing extraction content could be caused by the dilution effect when the solution was excessive.
Extraction time is an important parameter that influences the dissolution process and extraction contents of cooling agents. The effect of extraction time was studied in the range from 20 to 40 min. As shown in Figure 3b, the extraction efficiency showed an increasing trend with the increase of extraction time, reaching the highest value of 6.62 mg/g at 35 min. Then, the extraction contents of cooling agents declined as time continued to increase.
Extraction temperature has significant influence on the dissolution speed of cooling agents and on the volatility of cooling agents. The extraction content of cooling agents was investigated in the temperature range from 20 °C to 60 °C. The result is shown in Figure 3c. The extraction contents of cooling agents increased with the increase of temperature before 40 °C, while an sharp decrease was observed when the temperature was higher than 50 °C. Generally, the diffusion rate could increase with the rise in temperature, but too high a temperature could cause volatilization of the cooling agents (22).
The rotation rate of shaker is another important factor during the extraction process. Therefore, this study investigated the extraction contents at five different rates in the range of 100–180 r/min. The result in Figure 3d shows that the extraction contents are the highest when the rotating rate of rotation is 140 r/min, which may be caused by the sufficient contact of tipping paper and solvent in this limited space of conical flask.
Orthogonal Experiment
The single-factor optimization experiment has been widely used to optimize extraction conditions to obtain the highest extraction efficiency (23,24). The single-factor experiment is easy to operate, but the disadvantage is that it cannot reflect the influence of the interaction between the variables on the extraction efficiency (25). Fortunately, OED can be used to overcome these drawbacks. OED is a scientific method that is based on the theoretical basis of the theory of probability and statistics (26). OED is commonly employed in studying behaviors of parameters, which involve multivariate and multi-level factors. Based on orthogonality, representative samples of test points were selected from comprehensive test variables. These representative test points were uniformly dispersed and neatly comparable (27). This statistical analysis technique has been demonstrated to be highly efficient, accurate, fast, and economical in experimental design methods (28).
Based on the results of a single-factor test, a four-factor, three-level orthogonal array design was used to evaluate the effects of the following factors on the extraction contents: extraction time, solvent volume, extraction temperature, and rotation rate. The details are shown in Table II.
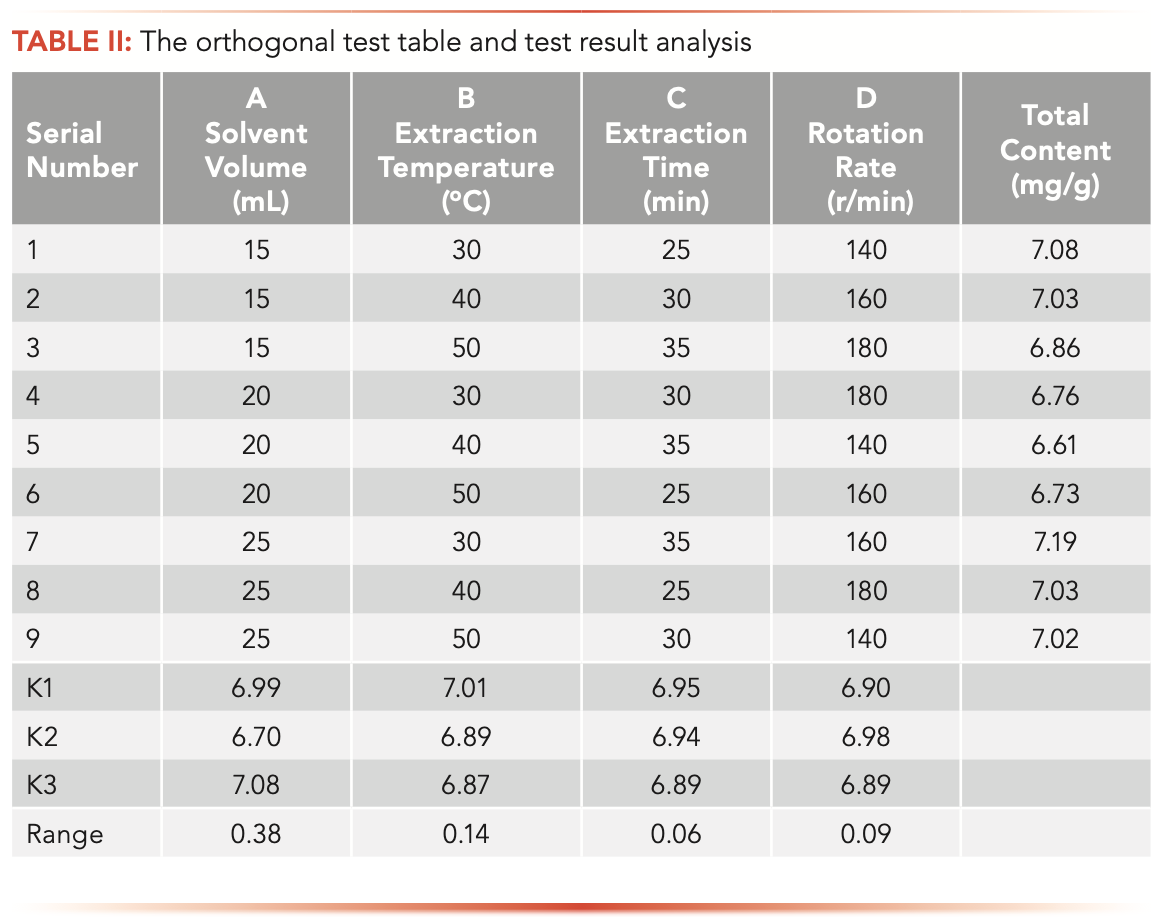
From Table II, the order of factors affecting the content of cooling characteristic component was as follows: amount of solvent volume, extraction temperature, shaker speed, and extraction time. The optimum conditions obtained by OED were as follows: solvent volume of 25 mL, extraction temperature of 30 °C, extraction time of 25 min, and rotation rate of 160 r/min (A3B1C1D2). Therefore, the extraction condition was selected to experiments.
Verification of Optimal Condition
According to the optimal condition (A3B1C1D2) that was obtained from OED, the verification test was carried out. The verification experiment was carried out in three parallel experiments. According to the test results, the total extraction amount of cooling agents in tipping paper were 7.21, 7.22, and 7.25 mg/g, respectively. It was greater than the result of each condition in the OED table. This result indicated that the condition of A3B1C1D2 was the best extraction method for detecting cooling agents in tipping paper.
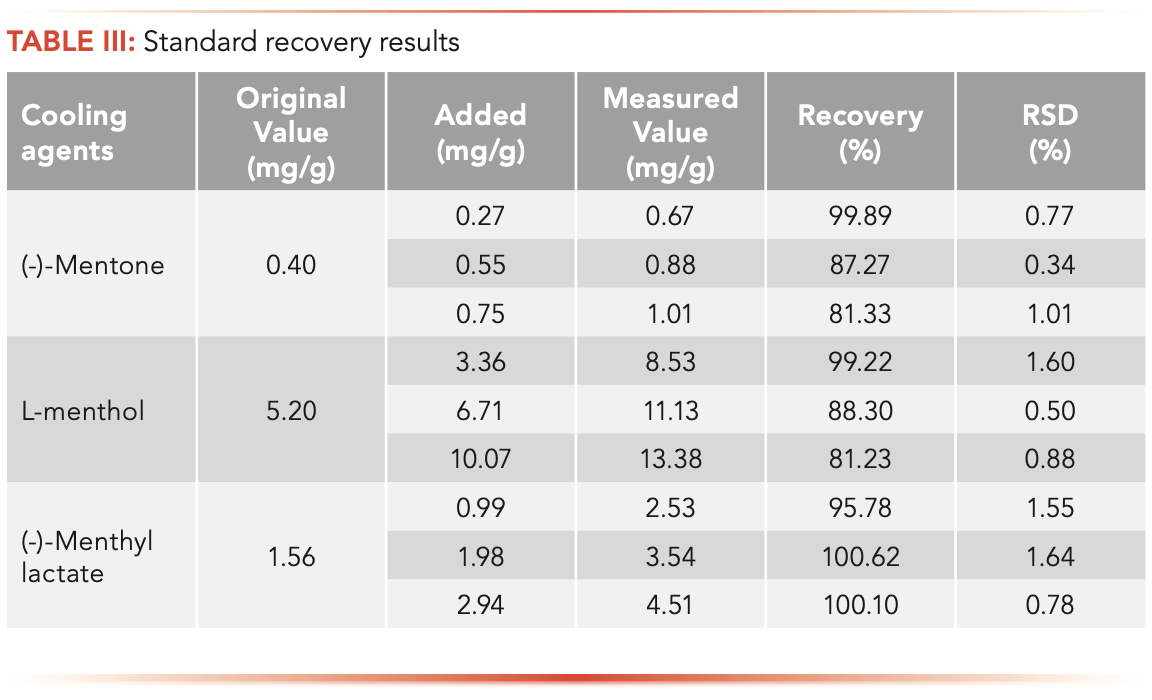
Table III showed the average recovery value of the studied three cooling agents ranging from 81.23 to 100.62% (RSDs, 0.34~1.64 %). In addition, the recovery rate of (-)-menthone and L-menthol showed a decreasing trend with the increase of the standard addition amount, which may be caused by the higher volatility of (-)-menthone and L-menthol, the increase of content of volatile cooling agent leading to a higher loss rate (22,29). These results demonstrated that the method proposed here is effective and available for extracting and determining the cooling agents in cigarette tipping paper.
Market Sample Analysis
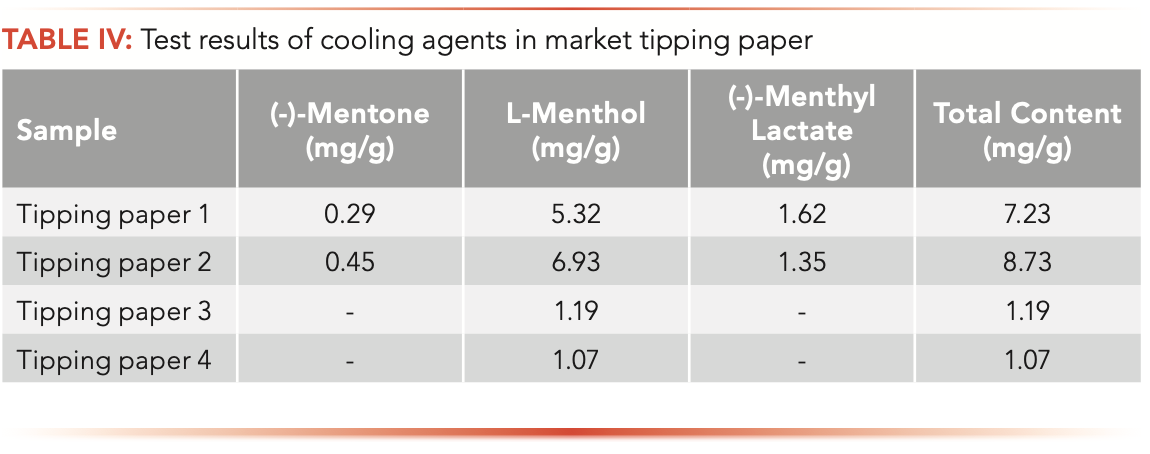
The cooling contents in different tipping paper samples on the market was determined through the above optimal conditions. The results are shown in Table IV. It can be seen that the kinds of cooling agents in different tipping paper are different, and the contents of different kinds of cooling agents are also significantly different. For tipping paper 1 and 2, three cooling agents were all detected and the content of L-menthol was obviously higher than that of (-)-mentone and (-)-menthyl lactate. The total contents of cooling agents were 7.23 and 8.73 mg/g for tipping paper 1 and 2, respectively. However, for tipping paper 3 and 4, only L-menthol was detected, and the contents were lower than the other two samples. Therefore, the solvent extraction combined with GC-FID method could be employed to monitor the cooling agents in tipping paper for controlling the quality of cigarette product.
Summary
In the present study, a solvent extraction methodology for the determination of cooling agents in cigarette tipping paper using GC-FID was developed, validated, and optimized. The parameters extraction solvent volume of 25 mL, extraction time of 25 min, temperature of 30 °C, and rotation rate of 160 r/min were optimized using the single factor and orthogonal experiments. The quantification of cooling agents in tipping paper exhibited good repeatability and high recovery rate. By employing the proposed method, the contents of cooling agents in four market tipping paper were detected and compared. Therefore, this study provided an available method for monitoring the characteristic components in tipping paper.
Acknowledgments
This work was supported by the project (No. HTYX-20200252109791) from Hongta Group Co., Ltd.
References
(1) M.B. Reed, C.M. Anderson, and D.M. Burns, Tob. Control 15, 436-441 (2006).
(2) Q. Gan, W. Lu, J.Y. Xu, X.J. Li, M. Goniewicz, N.L. Benowitz, and S.A. Glantz, Tob. Control 19, 374–379 (2010).
(3) Y.Q. Jing, G.L. Li, J.J. Liu, H.T. Huang, H.M. Hu, H.L. Zhang, X.H. Xie, and J.F. Zhu, App. Mechan. Mater 79, 35–42 (2011).
(4) S.M. Gordon, M.C. Brinkman, R.Q. Meng, G.M. Anderson, J.C. Chuang, R.R. Kroeger, I.L. Reyes, and P.I. Clark, Chem. Res. Toxicol 24, 1744–1753 (2011).
(5) H.S. Kim, E.C. Pack, Y.J. Koo, Y.J. Lee, D.K. Sung, S.H. Lee, et al, Regul. Toxicol. Pharm 92, 420–428 (2018).
(6) E. Gilbert and A. Ewald, BMC. Womens Health 21, 155 (2021).
(7) J. Aszyk, P. Kubica, M.K. Wozniak, J. Namiesnik, A. Wasik, and A. Kot-Wasik, J. Chromatogr. A 1574, 86–98 (2018).
(8) E.J.Z. Krusemann, J.L.A. Pennings, J.W.J.M. Gremers, F. Bakker, S. Boesveldt, and R. Talhout, J. Pharmaceut. Biomed. 188, 113364 (2020).
(9) T.B. Mason and A.M. Leven, Subst. Use. Misuse 56, 848–853 (2021).
(10) Y.T. Lin, H.L. Wu, H.S. Kou, S.M. Wu, and S.H. Chen, J. Chromatogr. A 1087, 223–228 (2005).
(11) K. Hamasaki, K. Kato, T. Watanabe, Y. Yoshimura, H. Nakazawa, A. Yamamoto, and A. Matsunaga, J. Pharmaceut. Biomed. 16, 1275–1280 (1998).
(12) M.T. Lisanti, J. Laboyrie, S. March-and-Marion, G. de Revel, L. Moio, L. Riquier, and C. Franc, Food Chem. 361, 130029 (2021).
(13) Z.Y. Wang, J.M. Han, D.L. Yuan, X.D. Zheng, S.Z. Shang, Z.Q. Li, et al, Tob. Sci. Technol. 53, 57–63 (2020).
(14) B.M.C. Botrel, D.C.P. Abreu, M.J.F. Bazana, P.V.E. Rosa, and A.A. Saczk, Food. Anal. Method 12, 1390–1398 (2019).
(15) U. Sengul, J. Food. Drug. Anal. 24, 56–62 (2016).
(16) N.H. Snow, LCGC N. Am. 39, 232–235 (2021).
(17) M.N. Abualhasan, A.N. Zaid, N. Jaradat, and A. Mousa, Int. J. Anal. Chem. 2017, 5 (2017).
(18) T. Belwal, S. M. Ezzat, L. Rastrelli, I.D. Bhatt, M. Daglia, A. Baldi, et al, Trac-trend. Anal. Chem. 100, 82–102 (2018).
(19) F. Chen, Y.Z. Sun, G.H. Zhao, X.J. Liao, X.S. Hu, J.H. Wu, and Z.F. Wang, Ultrason. Sonochem. 14, 767–778 (2007).
(20) S.S. Chen, Z. Zeng, N. Hu, B. Bai, H.L. Wang, and Y.R. Suo, Food Chem. 242, 1–8 (2018).
(21) F. Ma, P.W. Li, B. Matthaeus, W. Zhang, and Q. Zhang, J. Sep. Sci. 35, 2241–2248 (2012).
(22) P. Piran, H.S. Kafil, S. Ghanbarzadeh, R. Safdari, and H. Hamishehkar, Adv. Pharm. Bull. 7, 261–268 (2017).
(23) J.P. Tang, Y.T. Liu, and L. Zhu, Prep. Biochem. Biotech. 44, 90–106 (2014).
(24) E.Z. Jahromi, A. Bidari, Y. Assadi, M.R.M. Hosseini, and M.R. Jamali, Anal. Chim. Acta. 585, 305–311 (2007).
(25) N. Wang, Y.M. Lu, and B. Cui, Food. Anal. Method 14, 1577–1589 (2021).
(26) C. Sun, and C.L. Lu, “Design and Development of an Experimental Design and Evaluation System,” paper presented at the 4th International Conference on Instrumentation and Measurement, Computer, Communication and Control, Heilongjiang, Harbin, 2014.
(27) J. Wu, W. Liu, R. Zhu, and X.S. Zhu, Rsc. Adv. 11, 8255–8263 (2021).
(28) S. Hinislioglu and O.U. Bayrak, Civ. Eng. Environ. Syst. 21, 79–90 (2004).
(29) J.M. Davidson, R.S.T. Linforth, T.A. Hollowood, and A.J. Taylor, J. Agric. Food. Chem. 47, 4336–4340 (1999).
Yanchuang Feng, Ke Huang, Miao Liang, and Junsong Zhang are with the Collaborative Innovation Center of Food Production and Safety, in the College of Food and Bioengineering, at Zhengzhou University of Light Industry, in Zhengzhou, China. Zhen Zhang, Dongdong Feng, Dingrong Guo, and Hepeng Ni are with the Yuxi Cigarette Factory of Hongta Group Co., Ltd., in Yuxi, China. Direct correspondence to Miao Liang at liangmiaozzu@163.com or Junsong Zhang at 13283712413@163.com.
Study Examines Impact of Zwitterionic Liquid Structures on Volatile Carboxylic Acid Separation in GC
March 28th 2025Iowa State University researchers evaluated imidazolium-based ZILs with sulfonate and triflimide anions to understand the influence of ZILs’ chemical structures on polar analyte separation.
Study Explores Thin-Film Extraction of Biogenic Amines via HPLC-MS/MS
March 27th 2025Scientists from Tabriz University and the University of Tabriz explored cellulose acetate-UiO-66-COOH as an affordable coating sorbent for thin film extraction of biogenic amines from cheese and alcohol-free beverages using HPLC-MS/MS.


