Nanoparticle Toxicity: Responding to Analytical and Regulatory Challenges with Field-Flow Fractionation
The fate and modification of nanoparticles in real life matrices can be investigated by the combination of field-flow fractionation (FFF) with inductively coupled plasma mass spectrometry (ICP–MS). This article explains more.
This article illustrates how the fate and modification of nanoparticles in real life matrices can be investigated by the combination of field-flow fractionation (FFF) with inductively coupled plasma mass spectrometry (ICP–MS).
Engineered nanoparticles (ENPs) play an important role in a range of industrial and commercial products; however, there are concerns over their potential toxicity. The regulations governing the use of ENPs are not fully defined or harmonized - current guidance by the US Environmental Protection Agency (US EPA) requires "manufacturers of new (nanoparticle) chemical substances to provide specific information to the Agency for review prior to manufacturing chemicals or introducing them into commerce".1 This requires a comprehensive approach to analysis, particularly with regards to factors that contribute to the rate of diffusion or uptake by an organism such as particle size, size distribution, and concentration.

Photo Credit: bgblue/Getty Images
Analysis of nanoparticle suspensions presents a unique analytical challenge, because NPs can be sensitive to even slight variations in media and can readily change size by dissolution or aggregation. NP suspensions therefore have to be analyzed in matrices that are as close as possible to expected environmental conditions (surface water, sea water, or sewage sludge), and at realistic concentrations (low ppb). Field-flow fractionation (FFF) is a powerful separation method for proteins and colloidal particles that (when combined with multiple particle-sizing techniques) can provide high resolution and high dynamic range in terms of size, which is not possible with column-based chromatography.
An Introduction to Field-Flow Fractionation (FFF)
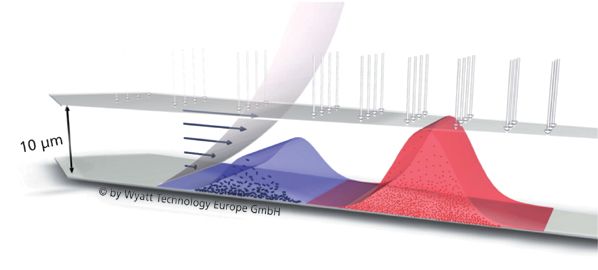
FFF separation takes place inside a thin-fluid layer within a flat channel or hollow fibre. A liquid force-field within the channel causes the sample to concentrate along the bottom wall, which is lined with a semi-permeable ultrafiltration membrane. Particles diffuse back into the channel because of Brownian motion, with smaller particles travelling higher than larger ones. These are collected by a laminar flow that separates particles according to size (see Figure 1). As elution progresses, the sample components separate further to form either discrete or more broadly dispersed peaks, with smaller particles emerging before larger ones. FFF is a remarkably simple technique that delivers several advantages including:
- Ability to use a range of complex sample media.
- Wide separation range from one nanometre to several micrometre.
- Minimal shearing.
- Minimal column surface interaction.

Figure 1: A laminar flow within the fractionation column separates particles into discrete size fractions without inducing particle shearing or column interaction.
The Stokes radius of the particles may be estimated from the FFF retention equation, but it is only through combination with particle characterization that the full analytical productivity of FFF is truly achieved.
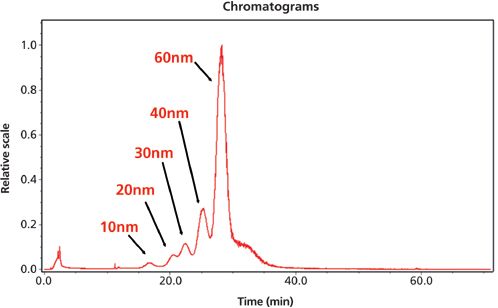
Light scattering is widely considered the gold standard method for particle size analysis and most modern FFF instruments are compatible with either dynamic light-scattering (DLS) or multi-angle light scattering (MALS) systems. Figure 2 shows a chromatogram for a polyethylene glycol suspension of gold nanoparticles (GNP). Individual GNPs, nominally 10 nm, 20 nm, 30 nm, 40 nm, and 60 nm, were fractionated with FFF. Each fraction is successfully separated and clearly resolved.2 However, the reliability of light scattering is limited at ultra-low concentrations and often requires validation with an additional particle sizing technique. An alternative method is to combine FFF with inductively coupled plasma mass spectrometry (ICP–MS).

Figure 2: Fractionation and characterization of gold nanoparticles in aqueous solution with FFF and DLS.
The following study shows how FFF linked to ICP–MS can be performed to monitor changes in particle size distribution and recovery caused by variation in ionic strength of the carrier solution. Single-particle ICP–MS (sp-ICP–MS) is applied over a complete FFF separation run, demonstrating it to be an efficient tool to obtain size information where other methods (such as light scattering) cannot be applied.
Case Study: Characterization of Surface-Modified Gold Nanoparticles (GNPs)
Sample Preparation: Two GNP samples with diameters of 15 nm (INM) and 60 nm (NIST 8013) were citrate-reduced in aqueous solution (0.01 % HAuCl4). The 15-nm particle solutions were then modified with (11-mercaptoundecyl)-tetra(ethylene glycol), bonded covalently by the thiol group to the particle surface. Three different carrier solutions for the FFF separation were prepared: 0.02% sodium-dodecylsulphate (SDS), and the same SDS with the addition of 0.1% and 0.5% NaCl.
Instrument Set-Up: The data presented in this study were obtained using an Eclipse DUALTEC Flow FFF (Wyatt Technology Corp.) equipped with a hollow-fibre channel (HF5). The mobile phase was delivered using an ICS-5000 quaternary, metal-free HPLC system (Thermo Scientific) and injections were performed using a DS-DP ICS-5000 autosampler (Thermo Scientific). The FFF unit was coupled to an iCAP Qc ICP–MS system (Thermo Scientific). A PFA-ST nebulizer (Thermo Scientific) was used for all ICP–MS and sp-ICP–MS determinations. The Eclipse chassis splits the flow appropriately with a series of specially configured valves and creates the inject flow and cross-flow using needle valves and flowmeters. Separation was achieved on a single hollow fibre with 800 μm internal diameter (polyethersulphone, 10 kDa cutoff) mounted in a cartridge, which creates a cylindrical channel. This disposable unit has a 90-μL volume resulting in low sample dilution. Flow conditions were selected to achieve baseline resolution for the two peaks. Dwell time was 100 ms for ICP–MS and 0.005 ms for sp-ICP–MS. For the sp-ICP–MS mode, the injected sample was diluted by a factor of approximately 1000.
Qtegra Intelligent Scientific Data System software (Thermo Scientific) was used throughout for iCAP Q control and data acquisition. Chromeleon software (Thermo Scientific) with the Eclipse plug-in was used to drive the Wyatt Eclipse and ICS-5000 in a single method. ISIS software (Wyatt Technology) was used to calculate the theoretical retention time of the particles under different flow conditions to optimize the FFF separation conditions.
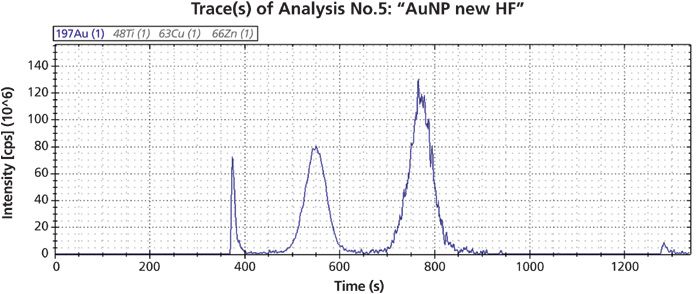
Results: Figure 3 shows the fractogram for GNP in 0.02% SDS. Four distinct peaks can be observed in the ICP–MS signal, which correspond to the following:
- The void peak with a retention time corresponding to the channel volume at 320 s.
- Two successive peaks corresponding to the 15-nm and the 60-nm particles.
- A fourth peak eluting after activation of the flow through the injector at the end of the run at 1200 s.

Figure 3: Fractogram of two nanoparticles with 15 nm and 60 nm diameter.
ISIS software calculated retention times as 220 s and 510 s for 15 nm and 60 nm particles, respectively, after the void peak. This compares to 190 s and 420 s for the experimental values. The 60 nm particle elutes earlier as expected, which can be explained by the contribution of electrostatic repulsion between the particle and the membrane. Within the void, peak particle size is unpredictable with FFF alone because it may consist of oversized particles from steric elution as well as small particles.
The effect of changing conditions was monitored to establish the impact of variations in ionic strength on GNP stability. NaCl was added to the carrier solution to produce 0.1% and 0.5% concentrations, and the modified solutions analyzed using FFF.
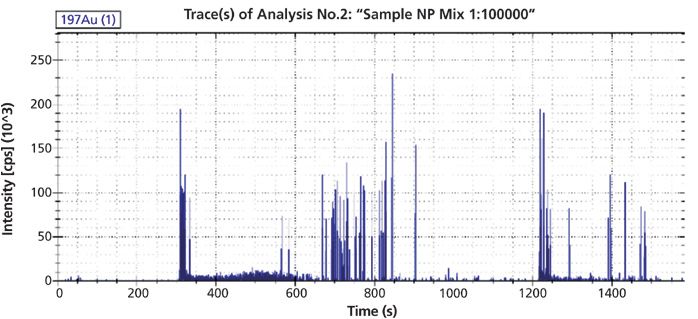
The recovery of both particles drops by approximately 50% with the addition of 0.1% NaCl. Increasing NaCl concentration to 0.5% further reduces recovery by 50% for the 15-nm particle and results in almost complete loss of the 60-nm signal. sp-ICP–MS was then used to better understand how particle size changes with increased ionic strength. The sample load was reduced by a factor of 100 to reach a dilution high enough to detect single particle events. The results from sp-ICP–MS analysis can be seen in Figure 4.

Figure 4: sp-ICP–MS data upon separation of the two GNPs in 0.02% SDS.
The height of the spikes provides an indication of the corresponding particle size. Assuming a spherical shape, the spikes from 15-nm particles are expected to be lower than those of the 60-nm particles, which are around 100 k counts. Significant further dilution would be required to resolve single 15-nm particles and signal-to-noise would probably not be sufficient for reliable detection. These results indicate that 60-nm particles are present in the void peak alongside oversized aggregates.
The results following addition of 0.5% NaCl show that the recovery of 60-nm particles is so low that the sample does not need to be diluted, while 15-nm particles are still too concentrated to give single particle events. Spikes of 100 k counts can still be found in the elution time range of 600 to 800 s, which correspond to the small fraction of particles which were not aggregated. Interestingly, there are larger spikes in the elution and injection peaks compared to the void peak. Flow-injection into higher ionic strength conditions leads to aggregation, but not to adsorption, because the particles are not concentrated at the membrane.
The results indicate that sample loss in higher ionic strength solutions is caused by formation of aggregates and then adsorption of those aggregates on the membrane or other surfaces. This phenomenon is independent of the different surface coating of the two Au particles. Retention time of the 60 nm GNPs is considerably shorter than predicted by theory, indicating non-ideal effects not influenced by the ionic strength. Therefore, sp-ICP–MS is a useful tool to provide additional size information where it cannot be obtained from FFF retention time, and it can be used to detect aggregates in the void as well as the release peaks.
Summary
When used with other detection techniques such as MALS, DLS, and ICP–MS, FFF allows comprehensive characterization of nanoparticles. The demand for a reliable technique for nanoparticle separation has led to recognition of the capabilities of FFF and the potential of sp-ICP–MS to quantify and validate separation results at trace levels. However, the detection limit of ICP–MS depends heavily on size and varies dramatically depending on the metal of interest. In unfavourable cases where the detection limit is above the critical size of 100 nm it is often challenging to find a suitable dilution range to enable detection of a broader size range. This highlights the importance of using complementary analysis with direct sizing detectors, such as light scattering instruments, during ENP characterization.
References
1. U.S. Environmental Protection Agency, Control of Nanoscale Materials under the Toxic Substances Control Act, http://www.epa.gov/oppt/nano/ (Last accessed: 26/03/2015)
2. Tae Joon Cho and Vincent A.Hacley, Annual Bioanal Chem398(5), 2003–18 (2010).
Christoph Johann is managing director and founder of Wyatt Technology Europe (WTE) GmbH. Dr. Johann has been active in polymer and biopolymer analysis for over 30 years and has several peer-reviewed publications in the field of macromolecular characterization and field-flow fractionation (FFF). He earned his PhD in 1985 in physical chemistry at the University of Mainz. In the same year he was the co-founder of PSS Polymer Standards Service GmbH, a start-up company that offered model polymers for research purposes and developed SEC columns. In 1993 he left PSS and founded a second company, Wyatt Technology Deutschland, now called Wyatt Technology Europe.
E-mail: christoph.johann@wyatt.eu
Website: www.wyatt.com
This article is from LCGC's digital magazine The Column. Click here to view the full issue>

What Goes in a CDS IT Service Level Agreement?
Published: April 7th 2025 | Updated: April 7th 2025Protecting your network chromatography data system (CDS) data is critical and a service level agreement (SLA) with your IT provider is vital. What should be included? Are SLAs for in-house IT and SaaS (software as a service) similar?
Retaining Talent in Field-Flow Fractionation: An Initiative
The authors present their motivation for establishing the Young Scientists of FFF (YSFFF) initiative within the FFF community.
Advanced LC–MS Analysis for PFAS Analysis in Eggs
October 11th 2024The European Commission's regulation on maximum levels for certain contaminants in food highlights the need for precise and reliable methods to quantify per- and polyfluoroalkyl substances (PFAS) in various food matrices. This article discusses development and validation of a robust method for analyzing 21 PFAS compounds in chicken eggs using solid-phase extraction (SPE) and liquid chromatography–mass spectrometry (LC–MS).


