Multivariate Design of Experiments for Gas Chromatographic Analysis
Recent advances in green chemistry have made multivariate experimental design popular in sample preparation development. This approach helps reduce the number of measurements and data for evaluation and can be useful for method development in gas chromatography.
Extensive progress in analytical equipment development means a large amount of complex data is generated during the method development step that needs to be processed. This situation is typical for complex samples, where the overall profile of the sample more closely correlates with the investigation objectives, and the selection of optimal experimental conditions depends on multiple responses.
Multivariate design of experiments (DOE) allows a reduction in the number of measurements and helps to meet the desired requirements by building a mathematical model (1). In the case of several independent variables, it is recommended to perform a screening step first to identify factors that have statistically significant effects on the dependent variables (responses) (2). Therefore, using designs with two-factor levels, such as a 2k full/fractional factorial design or a Plackett-Burman design at this stage, is preferable. The resolution of the selected design determines the ability to estimate all the effects, including main effects and interactions. On the other hand, the main optimization stage requires three or more factor-level designs, such as a central composite design, a Box-Behnken design, a 3k full factorial design, a Doehlert design and a D-optimal design. Besides the number of experimental runs, these designs differ in orthogonality (diagonality) and rotatability (symmetry to a central point). Subsequently, all the responses are processed to construct the model that fits the obtained responses based on a second-order polynomial function or artificial neural network (ANN) methodology (3). In addition, a desirability function is another tool incorporated in this strategy to transform multiple responses into a single (total) response.
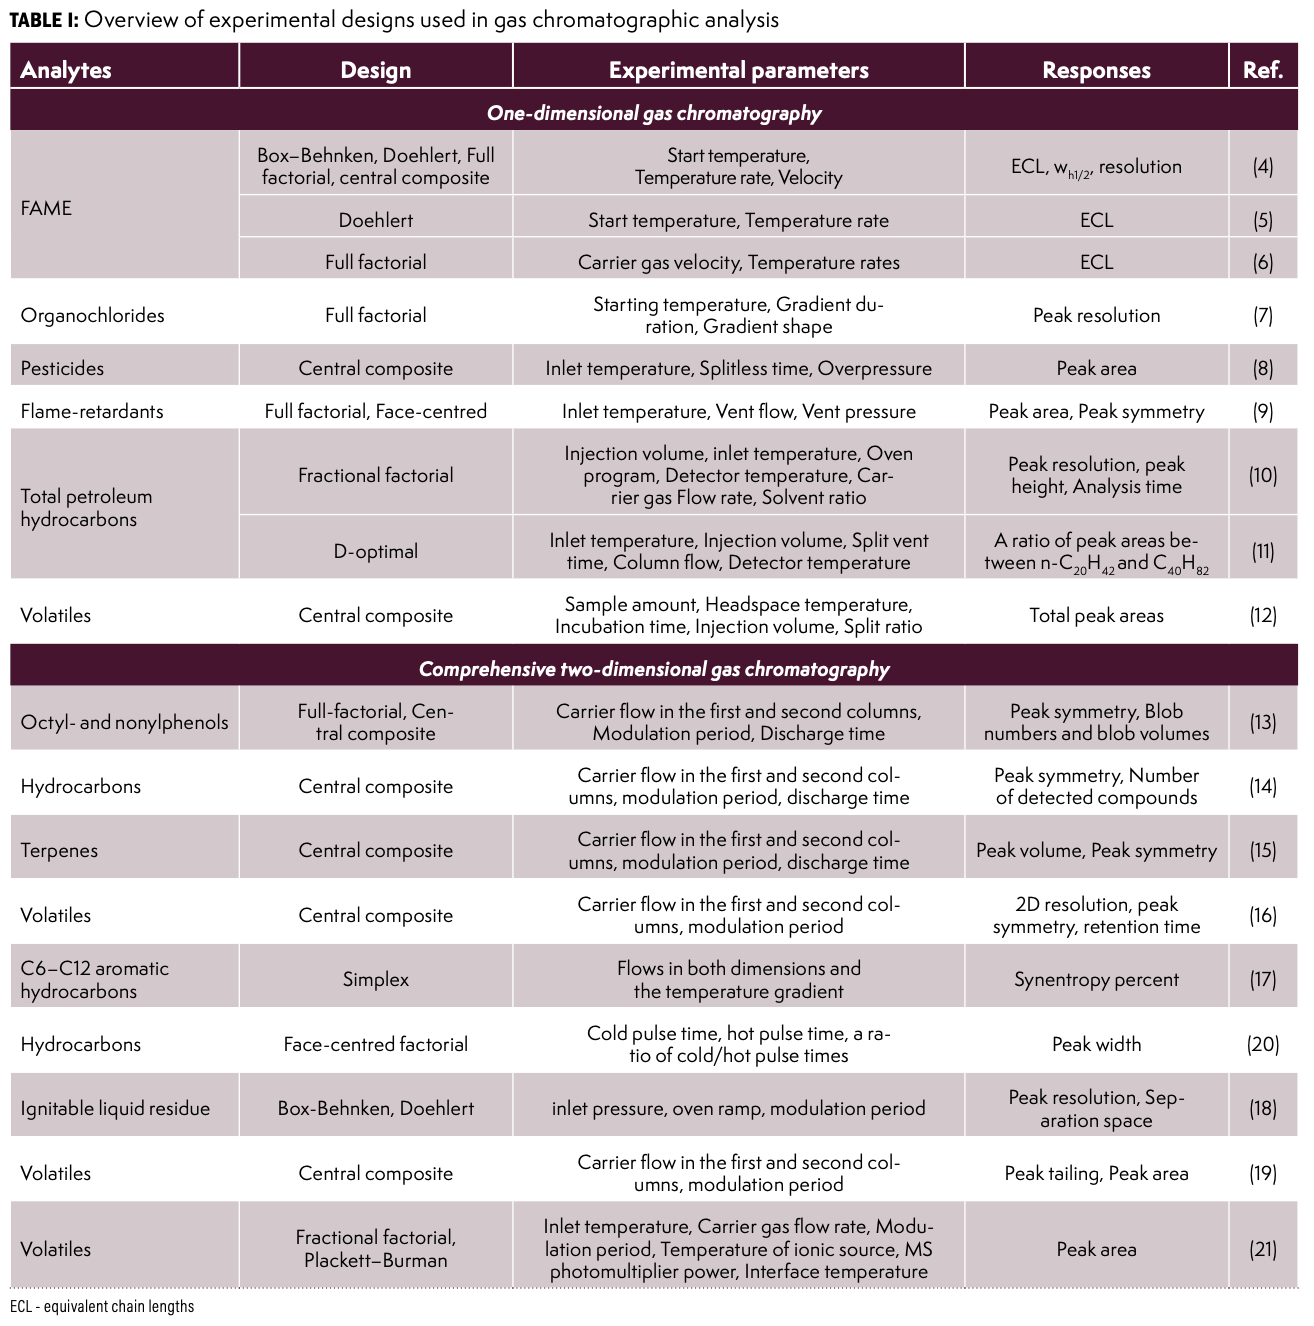
An experimental design was used in gas chromatographic analysis to study the effect of separation parameters and injection or detector configuration (Table I). For example, different experimental designs were tested to enhance the separation of fatty acid methyl esters with a stationary phase based on 70% cyanopropyl polysilphenylene-siloxane (4,5). The most successful correlation was found between factors like temperature program and carrier gas velocity, and the results were represented using retention indices or equivalent chain length values (ECLs). The precision of retention indices ranged from 0.0010% to 0.0039%, based on the results of a Box–Behnken design (4). Similarly, a Doehlert design was used to translate elution patterns between columns with the same stationary phases (5). In this case, a minimal deviation from the target retention indices was defined using response surface methodology. Furthermore, the study (6) assessed the influence of specific experimental parameters on the retention of FAME for diverse types of polar columns. Variations in the results were observed, such as the ionic liquid stationary phase displaying a highly temperature-dependent polarity compared to the other studied columns and displaying a polarity that is highly temperature-dependent compared to the other polar columns. Another approach, similar to HPLC analysis, was used to optimise the temperature program for organochlorine pesticide analysis (7). A full three-level factorial design was chosen to cover experimental factors such as starting temperature, gradient duration, and a shape parameter of the gradient.
The resolutions of various pairs of compounds (β-BHC/δ-BHC, 4,4’--DDE/dieldrin, dieldrin/2,4’-DDD and 2,4’-DDT/4,4’-DDD) and the global resolution were analyzed with a multi-layer artificial network and a polynomial regression. The constructed response surfaces showed a moderate and positive influence on the shape parameter and a significant and positive influence on the gradient time. The main difference lies in finding an optimum condition for the initial temperature.
A few studies were mainly focused on injection parameters, e.g. the analysis of pesticides (diphenylamine, tolylfluanid, propargite and phosalone) in the liver (8) and flame-retardants in food and feed (9). For both cases, a central composite design defined an experimental domain for injector temperature, splitless time, splitless overpressure, vent pressure and vent flow, depending on injection mode. Utilizing a second-order polynomial function, the response surfaces for the peak areas and symmetry at 10% of height were effectively described. Notably, the model suggests a recommended inlet temperature of 45 °C for injection of nonane extract. The optimized conditions for PTV injection allowed ultra-trace level determination (pg) using GC-QQQ (9).
A screening stage is often utilized to optimize a combination of inlet and chromatographic parameters. This method was used to decrease the analysis time for separating total petroleum hydrocarbons (C6-C50) (C6–C50) (10). Initially, a 26-2 factorial design was employed, which included six experimental parameters (extract solvent ratio, injection volume, injection temperature, oven program, carrier gas flow rate, FID temperature). Subsequently, the statistically significant gas flow rate and oven temperature were carefully studied using a central composite design. A D-optimal design was selected as a statistical tool to prevent mass discrimination and loss of peak symmetry in a narrower range of hydrocarbons (C10-C40) (11). In contrast to the previous study, the influence of the oven temperature wasn’t evaluated, but a liner design was taken into account. The effectiveness of the proposed experimental conditions was assessed by the responses of n-eicosane and n-tetracontane, as well as their ratio. Two statistical approaches were compared for describing response surface methodology when using gas chromatography-ion mobility spectrometry to analyse saffron volatiles in the headspace (12). The study found that a Bayesian regularized artificial neural network model was better suited for representing the nonlinearity of GC–IMS peak areas. At the same time, multiple linear regression effectively described a linear correlation between headspace parameters and the number of detected peaks.
With improved separation efficiency, comprehensive two-dimensional gas chromatography (GC×GC) gives more experimental parameters for optimization. Valllejo et al. (13) combined a full-factorial experimental design at a screening step and a central composite design at the optimization step for GC×GC analysis of octyl- and nonylphenol isomers with a non-polar × mid-polar column setup In this case, peak symmetries, blob numbers and blob volumes were selected to define statistically significant experimental parameters for a forward-flush modulator. The effect of modulation time was primarily excluded after the first step, and afterwards, a negative influence of the discharge time on the symmetry of peaks was found. Similar studies were carried out to analyse hydrocarbons in lithic materials (14) and terpenes in essential oils (15). A 2D resolution was included as an additional dependent variable for GC×GC analysis of volatile organic compounds in raw and roasted almonds (16). The separation performance of five column setups with conventional and reversing order of polarity was tested with a central composite design to determine the influence of carrier gas flows in both dimensions and modulation period was tested with a central composite design. It was shown that the effect of the 1D carrier gas flow on the 2D symmetry of 2,3-dimethylpyrazine mainly depends on the value of the 2D carrier gas flow. Furthermore, a synentropy percent was shown as a dependent variable related to the distribution of C6–C12 aromatic hydrocarbons in the 2D separation space (17), with two maxima of the response on the response surface plot found by simplex optimization, described with a quadratic function.
In the case of reversed fill-flush technology for GC×GC, a Box-Behnken design and Doehlert design were tested for ignitable liquid residue analysis (18). Influence of inlet pressure, oven ramp and modulation period on average resolution in both dimensions and percent usage of the separation space were presented with response surface plots. Accordingly, to response surface plots, the Box Behnken model only shows one optimum, while Doehlert displays a second optimum region for peak areas. However, both models showed the same average prediction variance at 0.4 point. Nonetheless, the Doehlert design demonstrated more statistical correlations, especially between separation efficiency and inlet pressure, whereas the Box Behnken results were characterised with higher model efficiencies. A GC×GC modulator of the same type was optimized using a central composite design to separate enantiomers in wine volatiles (19). However, a second-order polynomial function could not accurately describe the 2D peak tailing, and artificial neural networks (ANN) proved to be a better tool for estimating the obtained results.
DOE strategy was tested for evaluation of a cryogenic dual-stage modulator for GC×GC-QqQMS crude oil analysis (20). This involved experimental parameters responsible for cryogenic focusing, such as the times of cold/hot pulses and variation during analysis. The main goal of this study was to minimize the 2D peak width for a C12–C32 range, as modulation conditions could vary based on the volatility of the compounds. Modulation time was also investigated to assess the robustness of the chromatographic GC×GC–qMS signal (21). The experiment was designed using a Plackett–Burman strategy. It included carrier gas flow rate, injector temperature, modulation period, temperature of ionic source, MS photomultiplier power, and MS interface temperature as independent variables. Overall, the variations in peak areas were primarily influenced by carrier gas flow rate and photomultiplier power.
Acknowledgements
This work was supported by the Ministry of Education, Science, Research and Sports of the Slovak Republic for grant number VEGA 1/0298/23.
References
(1) Brown S, Tauler R, Walczak B (2020) Comprehensive chemometrics: chemical and biochemical data analysis. Elsevier.
(2) Vera Candioti L.; De Zan, M.M.; Cámara, M.S.; Goicoechea, H.C. Experimental design and multiple response optimization. Using the desirability function in analytical methods development. Talanta 2014, 124,123-138. DOI: 10.1016/j.talanta.2014.01.034
(3) Bezerra, M.A.; Santelli, R.E.; Oliveira, E.P.; Villar, L.S.; Escaleira L.A. Response surface methodology (RSM) as a tool for optimization in analytical chemistry. Talanta 2008, 76 (5), 965-977. DOI: 10.1016/j.talanta.2008.05.019
(4) Skartland, L.K.; Mjøs, S.A.; Grung, B. Experimental designs for modeling retention patterns and separation efficiency in analysis of fatty acid methyl esters by gas chromatography–mass spectrometry. J. Chromatogr. A 2011, 1218 (38), 6823-6831. DOI: 10.1016/j.chroma.2011.07.077.
(5) Chhaganlal, M., Skartland, L.K.; Mjøs, S.A. Transfer of retention patterns in gas chromatography by means of response surface methodology. J. Chromatogr. A 2014, 1332, 64-72. DOI: 10.1016/j.chroma.2014.01.039
(6) Waktola, H.D.; Mjøs, S.A. Chromatographic efficiency of polar capillary columns applied for the analysis of fatty acid methyl esters by gas chromatography. J. Sep. Sci. 2018, 41 (7), 1582-1592. DOI: 10.1002/jssc.201700908
(7) D’Archivio, A.A.; Maggi, M.A.; Marinelli, C.; Ruggieri, F.; Stecca F. Optimisation of temperature-programmed gas chromatographic separation of organochloride pesticides by response surface methodology. J. Chromatogr. A 2015, 1423, 149-157. DOI: 10.1016/j.chroma.2015.10.082
(8) Kadar, A.; Peyre, L.; Wortham, H.; Doumenq, P. A simple GC–MS method for the determination of diphenylamine, tolylfluanid propargite and phosalone in liver fractions. J. Chromatogr. B 2019, 1113, 69-76. DOI: 10.1016/j.jchromb.2019.03.005
(9) L’Homme, B.; Calaprice, C.; Calvano, C.D.; Zambonin, C.; Leardi, R.; Focant, J.-F. Ultra-trace measurement of Dechloranes to investigate food as a route of human exposure. Chemosphere 2015, 139, 525-533. DOI: 10.1016/j.chemosphere.2015.07.043
(10) Zubair, A.; Pappoe, M.; James, L.A.; Hawboldt, K. Development, optimization, validation and application of faster gas chromatography–flame ionization detector method for the analysis of total petroleum hydrocarbons in contaminated soils. J. Chromatogr. A 2015, 1425, 240-248. DOI: 10.1016/j.chroma.2015.10.003
(11) Saari, E.; Perämäki, P.; Jalonen, J. Evaluating the impact of GC operating settings on GC–FID performance for total petroleum hydrocarbon (TPH) determination. Microchem. J. 2010, 94 (1), 73-78. DOI: 10.1016/j.microc.2009.09.004
(12) Parastar, H.; Weller, P. Benchtop volatilomics supercharged: How machine learning based design of experiment helps optimizing untargeted GC-IMS gas phase metabolomics. Talanta 2024, 272, 125788. DOI: 10.1016/j.talanta.2024.125788
(13) Vallejo, A.; Olivares, M.; Fernández, L.; Etxebarria, N.; Arrasate, S.; Anakabe, E.; Usobiaga, A.; Zuloaga, O. Optimization of comprehensive two dimensional gas chromatography-flame ionization detection–quadrupole mass spectrometry for the separation of octyl-and nonylphenol isomers. J. Chromatogr. A 2011, 1218 (20), 3064-3069. DOI:10.1016/j.chroma.2011.03.016
(14) Olivares, M.; Irazola, M.; Vallejo, A.; Murelaga, X.; Zuloaga, O.; Etxebarria, N. Comprehensive two-dimensional gas chromatography to characterize hydrocarbon mixtures in lithic materials. J. Chromatogr. A 2011, 1218 (12), 1656-1662. DOI: 10.1016/j.chroma.2010.11.034
(15) Omar, J.; Alonso, I.; Olivares, M.; Vallejo, A.; Etxebarria, N. Optimization of comprehensive two-dimensional gas-chromatography (GC× GC) mass spectrometry for the determination of essential oils. Talanta 2012, 88, 145-151. DOI: 10.1016/j.talanta.2011.10.023
(16) Manzano, P., Diego, J.C.; Bernal, J.L.; Nozal, M.J.; Bernal, J. Comprehensive two‐dimensional gas chromatography coupled with static headspace sampling to analyze volatile compounds: Application to almonds. J. Sep. Sci. 2014, 37 (6), 675-683. DOI:10.1002/jssc.201301278
(17) Májek, P.; Krupčík, J.;, Gorovenko, R.; Špánik, I.; Sandra, P.; Armstrong, D.W. Computerized optimization of flows and temperature gradient in flow modulated comprehensive two-dimensional gas chromatography. J. Chromatogr. A 2014, 1349, 135-138. DOI: 10.1016/j.chroma.2014.05.015
(18) Boegelsack, N.; Hayes, K.; Sandau, C.; Withey, J.M.; McMartin, D.W.; O’Sullivan, G. Method development for optimizing analysis of ignitable liquid residues using flow-modulated comprehensive two-dimensional gas chromatography. J. Chromatogr. A 2021, 1656, 462495. DOI: 10.1016/j.chroma.2021.462495
(19) Vyviurska, O.; Koljancic, N.; Gomes, A.A.; Spanik, I. Optimization of enantiomer separation in flow-modulated comprehensive two-dimensional gas chromatography by response surface methodology coupled to artificial neural networks: Wine analysis case study. J. Chromatogr. A 2022, 1675, 463189. DOI: 10.1016/j.chroma.2022.463189
(20) Alexandrino, G.L.; de Sousa, G.R.; de A.M. Reis, F.; Augusto, F. Optimizing loop-type cryogenic modulation in comprehensive two-dimensional gas chromatography using time-variable combination of the dual-stage jets for analysis of crude oil. J. Chromatogr. A 2018, 1536, 82-87. DOI: 10.1016/j.chroma.2017.10.054
(21) Oliveira, L.F.; Braga, S.C.G.N.; Filgueiras, P.R.; Augusto, F.; Poppi, R.J. Assessment of robustness on analysis using headspace solid-phase microextraction and comprehensive two-dimensional gas chromatography through experimental designs. Talanta 2014, 129, 303-308. DOI: 10.1016/j.talanta.2014.05.038
About the Author
Olga Vyviurska is an Associate Professor in the Department of Analytical Chemistry at the Slovak University of Technology in Bratislava. Her research mainly focuses on applying multivariate experiment design to comprehensive two-dimensional gas chromatography (GC×GC) and sample preparation techniques. She is also interested in approaches to simplifying the processing of high-resolution GC×GC data.


New Study Reviews Chromatography Methods for Flavonoid Analysis
April 21st 2025Flavonoids are widely used metabolites that carry out various functions in different industries, such as food and cosmetics. Detecting, separating, and quantifying them in fruit species can be a complicated process.
University of Rouen-Normandy Scientists Explore Eco-Friendly Sampling Approach for GC-HRMS
April 17th 2025Root exudates—substances secreted by living plant roots—are challenging to sample, as they are typically extracted using artificial devices and can vary widely in both quantity and composition across plant species.
Sorbonne Researchers Develop Miniaturized GC Detector for VOC Analysis
April 16th 2025A team of scientists from the Paris university developed and optimized MAVERIC, a miniaturized and autonomous gas chromatography (GC) system coupled to a nano-gravimetric detector (NGD) based on a NEMS (nano-electromechanical-system) resonator.

.png&w=3840&q=75)

.png&w=3840&q=75)


.png&w=3840&q=75)


.png&w=3840&q=75)

