A Miniature Static Headspace–GC Method for the Analysis of Methanol in Biodiesel
The Column
An autosampler for a standard gas chromatography (GC) or GC–mass spectrometry (MS) system was adapted to perform simple static headspace sampling, instead of using a separate, and potentially more complicated, headspace sampling unit.
Photo Credit: saicle/Shutterstock.com

James D. Stuart and Anthony A. Provatas, Center for Environmental Sciences and Engineering, University of Connecticut, Connecticut, USA
An autosampler for a standard gas chromatography (GC) or GC–mass spectrometry (MS) system was adapted to perform simple static headspace sampling, instead of using a separate, and potentially more complicated, headspace sampling unit.
In order to use the same gas chromatography (GC) system for a variety of applications, an inexpensive and simple GC method was developed to perform not only highâtemperature GC analyses, but also a miniature static headspace method using the same autosampler and GC coupled to a flame ionization detection (FID) or GC coupled to a mass spectrometry (MS) system. A recent article in The Column (1) summarized how static headspace sampling has been effectively used for the analysis of ethanol in blood, residual solvents in pharmaceutical products, flavours and fragrances in commercial products, and many other applications. In this application we were asked to modify and possibly miniaturize a widely used static headspace method to test for the residual content of methanol in biodiesel samples (2), while still using the same GC–FID to perform a high-temperature analysis of the components of biodiesel (3).
Experimental
For the miniature static headspace–GC application it was found that the common biodiesel GC column used as specified in ASTM D6584 (3)-either a 14 m × 0.53 mm, 0.16âµm dimethylpolysiloxane or a 5%-phenyl methylpolysiloxane-bonded column-was replaced by a thicker film 15 m × 0.53 mm, 3.0-µm 5%-phenyl methylpolysiloxane capillary column. A commercially available dry heating block was adapted by having an aluminum block machined to hold and heat about 15 different 2-mL autosampler vials. These vials were capped with silicone and Teflon septa. It should be emphasized that the candidate for analysis by static headspace in the heated vial was rapidly transferred by hand into the appropriate slot of the autosampler tray for injection and the sequence immediately initiated so that the contents of the vial did not cool down. To avoid cross-contamination of samples from previous applications, whether they be high temperature or static headspace runs, it is recommended that a different autosampler syringe (2-, 5-, or 10 µL) be installed in the autosampler. All solvent bottles should be empty while 1-µL injections of the headspace are done to avoid any solvent rinsing. Instead of gram quantities of analyte (in this case biodiesel), the sample size was reduced from 4.0 g to 0.25 g and measured to 0.0001 on an analytical balance. Finally, to make sure that the injector and column had been properly heated and prepared for subsequent headspace injections, the onâcolumn injector (in this case) was set at 90 °C, well above the reported boiling points for methanol (65 °C) and 2-Propanol (82 °C).
Method
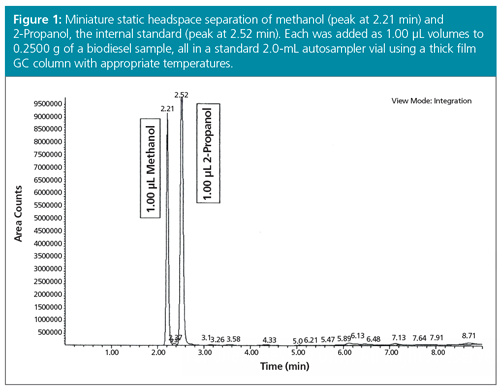
Using the existing GC–FID equipped with a standard 2-mL vial autosampler, coolâonâcolumn EPC-controlled injector, and flame ionization detector, a simple static headspace test for low levels of methanol in biodiesel, with 2-Propanol as the internal standard, using the method of standard addition was developed (4,5). The method of standard addition is essentially a serial spiking experiment in which increasing concentrations of the target analyte-in our case methanol-is added in different vials to the same amount of both the internal standard (2-Propanol) and the matrix (biodiesel). After suitable mixing, heating, and equilibration, temperature-dependent (Henry’s Law) proportions of the volatile analytes were portioned into the headspace of the small sampling vial. Consequently, a small but reproducible volume of the headspace was accurately injected by the autosampler into the injection port of the GC. It was found necessary to change to a heavily loaded (3–5 µm), thick film, megabore GC column, and use appropriately chosen injection and column temperatures. As shown in Figure 1, the two volatile components (methanol and 2-Propanol) were rapidly and baseline separated at a lower temperature. Suitable air blanks were injected to verify that there was indeed no analyte carryover.

Calibrations and Method Validation
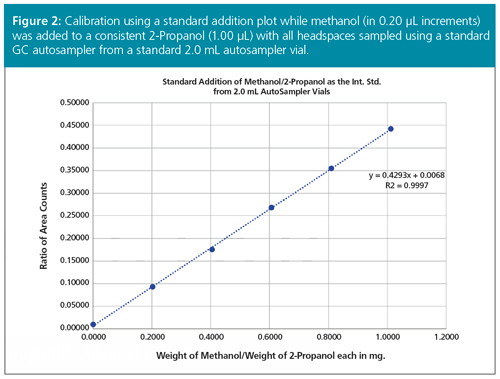
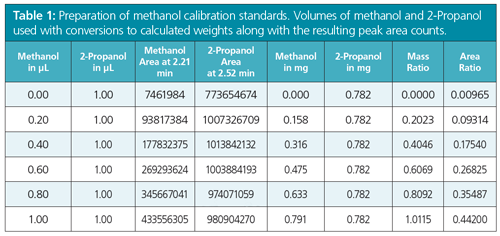
A plot of the ratio of analyte weights (x-axis) to ratio of peak areas (y-axis) was obtained generating a linear calibration line. Table 1 presents the actual data in area counts with the known weights of both the methanol and 2-Propanol entered into an Excel spreadsheet. Figure 2 shows the resulting linear regression plot with the calculated linear regression line having the high linear correlation coefficient of 0.9997. This result indicates that there was a high degree of certainty where the experimental factors of the y-axis (area counts) can be correlated to the more accurately measured factors of the x-axis (actual weights or volumes added). The “unweighted” regression line is calculated while extrapolating back to the point on the x-axis (xo), to obtain the y-value (actual area count to methanol:area count of 2-Propanol originally present in the biodiesel sample). This value was 0.00965 when read off the expanded Excel plot. Entering 0.00965 into the linear equation, y = 0.4293x + 0.0068, gives an x-value of 0.00644 for the weight ratio of methanol to 2-Propanol, when the extrapolated line passed the actual x-axis. Multiply this (x-value × wt. of 2-Propanol in mg) × 100 / weight of the sample in mg = % methanol in the original biodiesel sample. So (0.00644 × 0.782) × 100 / 258.8 = 0.0020% methanol in the biodiesel sample. Since the actual biodiesel sample was part of an ASTM Cross Check Programme, that programme reported that this biodiesel sample had a value of 0.004% (standard deviation of 0.006%) of methanol (n = 11) for runs done on a manual method, but a reported value of 0.000% (n = 23) when run by automated headspace methods for the same biodiesel sample, thus indicating the accuracy of the developed method.


Conclusions
The standard configuration of a GC–FID system equipped with an autosampler was adapted to accurately analyze low levels of methanol in a biodiesel matrix. The type of heavy filmed capillary column used and instrumental temperatures were optimized. This approach could possibly be suitable for other simple static headspace applications analysis, such as ethanol in blood or residual solvents in pharmaceutical products.
Acknowledgements
We thank Dr. Ming Chai of AmericanGreenFuels, Inc. for suggesting this application. We thank Gary Ulatowski and Phillip Caron for their technical supports.
References
- The Column11(18), 20–21 (2015).
- DIN EN 14110. Fat and oil derivatives. Determination of methanol content, adapted. European Standard, 10/01/2003.
- ASTM D6584-10a. Standard Test Method for Determination of Total Monoglycerides, Total Diglycerides, Total Triglycerides, and Free and Total Glycerin in B-100 Biodiesel Methyl Esters by Gas Chromatography, (ASTM International, West Conshohocken, Pennsylvania, USA), pp. 501–509 (2012).
- J.N. Miller and J.C. Miller, Statistics and Chemometrics for Analytical Chemistry, 6th ed., (Pearson Education Limited, 2010), OnâLine Edition, pp. 127–129.
- R.L. Grob and E.F. Barry, Eds., Modern Practice of Gas Chromatography (John Wiley & Sons, Hoboken, New Jersey, USA, 2004), 4th ed., pp. 571–2.
James D. Stuart obtained his Ph.D. (1969) in chemistry from Lehigh University, Bethlehem, Pennsylvania, USA. That year he joined the Department of Chemistry at the University of Connecticut retiring in 2003 as an Emeritus Professor of Analytical and Environmental Chemistry. He is currently a senior research scientist at CESE, where he started and conducts biofuel research and testing. He enjoyed sabbatical leaves working with L.B. (Buck) Rogers working on GC projects and with Csaba Horváth working on high performance liquid chromatography (HPLC) projects.
Anthony A. Provatas obtained his Ph.D. (2002) in chemistry from the University of Connecticut, Connecticut, USA. He has been with CESE as a project scientist since 2009. He is involved in various research projects including biofuels research and environmental organic analysis. Prior to joining the University of Connecticut and CESE he worked at Pfizer Inc. in Groton, Connecticut, for eight years. While at Pfizer Inc. he was actively involved in discovery research, high speed synthesis, purification, analysis, and high throughput screening. He has extensive experience in laboratory automation and various analytical instruments.
E-mail: james.stuart@uconn.edu
Website: www.cese.uconn.edu/

Polysorbate Quantification and Degradation Analysis via LC and Charged Aerosol Detection
April 9th 2025Scientists from ThermoFisher Scientific published a review article in the Journal of Chromatography A that provided an overview of HPLC analysis using charged aerosol detection can help with polysorbate quantification.
Analyzing Vitamin K1 Levels in Vegetables Eaten by Warfarin Patients Using HPLC UV–vis
April 9th 2025Research conducted by the Universitas Padjadjaran (Sumedang, Indonesia) focused on the measurement of vitamin K1 in various vegetables (specifically lettuce, cabbage, napa cabbage, and spinach) that were ingested by patients using warfarin. High performance liquid chromatography (HPLC) equipped with an ultraviolet detector set at 245 nm was used as the analytical technique.
Removing Double-Stranded RNA Impurities Using Chromatography
April 8th 2025Researchers from Agency for Science, Technology and Research in Singapore recently published a review article exploring how chromatography can be used to remove double-stranded RNA impurities during mRNA therapeutics production.


