Method Translation in Gas Chromatography
LCGC Europe
The advantages of using software to optimize GC methods with practical examples for pesticide analysis are described.
The benefits of using software to optimize GC methods with practical examples for pesticide analysis are described in this month's "Column Watch".
Everyone wants to improve productivity in their chromatography laboratory. In this month's "Column Watch", we will show how a software approach can be used in gas chromatography (GC) to shorten analysis time but preserve the elution order and the resolution. The calculations involved are a bit more complex than for LC because the mobile phase in GC is a gas, which is compressible, while LC solvents are less so. In both techniques the mobile phase viscosity is temperature-dependent.
There are various ways to reduce analysis time in GC:
- Increase the carrier gas linear velocity
- Increase temperature programme ramp rates
- Use hydrogen as a carrier gas (rather than helium or nitrogen)
- Reduce column length
- Decrease film thickness
- Perform isothermal analysis
Like any chromatographic method, there are trade-offs in any attempt to decrease analysis time. A balance between speed, capacity and resolution must be selected for each analysis to meet the laboratory's goals. Adapting methods for fast GC analysis can be complicated because peak reversals can occur and some fast GC methods may even decrease separation efficiency. Table 1 compares the benefits and drawbacks when changing to faster GC methods.

Table 1: Benefits and drawbacks when changing to fast GC methods. Adapted from Reference 1.
GC Method Translator
The GC Method Translation Software (1,2) is similar to the LC Method Translator, which will be discussed in the next column. This programme allows you to transfer a current GC method to another while ensuring that the relative retention order is maintained, that is, the peaks elute in the same order. It is free, stand-alone software that runs on a PC and will properly scale factors such as gas velocity and the temperature programme to make sure that the elution order is preserved. Users can easily translate to different column dimensions, faster flow-rates, switch carrier gases or a combination of all of these. One can do something as simple as change from a flame ionization detector (FID) to a mass spectrometry (MS) detector (operating under vacuum) or something as complex as changing the column length, i.d., detector type, carrier gas type, phase ratio (film thickness) and flow-rate (head pressure). The GC Method Translation software will generate a new method that will recommend a temperature programme, head pressure, and other parameter settings. The elution order will remain the same and the new method will attempt to maintain the resolution and selectivity of the original method. Peaks in the translated method do not have to be painstakingly identified. Thus, the GC Translation Software will reduce method development time or time to validate the new method. Furthermore, it will ensure that the new GC method is compatible with the hardware being used. Experimental parameters can be easily "tweaked" to speed-up the run time.
A couple of caveats should be considered when using the GC Method Translation Software. First, you must not change the stationary phase because the software cannot correct for changes in selectivity. Columns with 100% methylpolysiloxane or 5% phenylmethylpolysiloxane from different manufacturers can often be used interchangeably but more polar phases can vary significantly between manufacturers. Note that as a column "ages", the stationary phase may suffer oxygen damage at elevated temperatures or become contaminated with non-volatiles that affect peak elution order initially and over time. Also, if you are using flow programming, this parameter is not addressed in the software. You could investigate various flow-rates using the Method Translation Software and see how changes in flow may affect other parameters. After collecting data at several different flow-rates, the best set of conditions can be selected for the application.
The Method Translation tool operates in several modes:
Translate Only: Translates the current method to a new one based on a change of column dimensions, carrier gas type, outlet pressure and/or phase ratio. The elution order is preserved and the relative efficiency of the current method is maintained. This is useful for converting an established method to a column with different dimensions or a different phase ratio, or to change a detector with a different outlet pressure (e.g., a mass spectrometer).
Best Efficiency: Calculates new conditions (using your current column) that correspond to the theoretical optimum gas flow-rate for the best separation efficiency. The elution order remains the same but retention times may change.
Fast Analysis: Calculates temperature and pressure for your current column and carrier gas for a run that is twice as fast as the "Best Efficiency" mode; depending on the pressure drop across the column, run time will decrease by a factor of 1.5–2. The elution order of compounds will stay the same.
None: Allows you to change any parameter of interest; you can play with column dimensions, flowrate, head pressure, temperature programme rate and other parameters — even before you actually do any chromatography. You can use it with your current method to see how some parameters affect your results. For example, you can enter a smaller i.d. column to see the impact on run time; if your current method already has plenty of resolution, you can calculate optimum conditions for a shorter column operated at a higher flowrate and a different carrier gas. Thus, you can get a feel for the effect of each parameter adjustment on your chromatography.
Examples of Method Translation
The GC Method Translation Software is easy to implement. It allows one to make simple or complex changes in a GC method to speed-up the analysis, change column dimensions, film thickness, use different detectors, choose a different carrier gas and a multitude of other changes. Without running an experiment, one can actually make hypothetical changes and see how they affect the chromatography and help to determine if the proposed changes can be implemented with the current instrumentation. Although GC Method Translation Software can be used for method development, it is better served when one wants to improve or change an existing method. A major factor in using this tool is that the elution order remains the same, so one does not have to go back and identify each peak in the chromatogram.
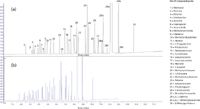
Figure 1: Capillary GC analysis of solvents in pharmaceuticals. Original chromatographic conditions (a): Column: DB-624, 30 m à 0.25 mm à 1.4 µm; carrier gas: Helium; injection temperature: 225 °C; pressure: 16.2 psi; split ratio: 25; split flow: 37; total flow: 42.2; flow: 1.5 mL/min; mode: constant flow; Oven temperature programme: 40 °C for 3.84 min, then 40â200 °C at 13.01°C/min, hold at 200 °C for 1.87 min; detector: FID, hydrogen flow: 40 mL/min; air flow: 400 mL/min; make-up flow: 20 mL/min. Translated chromatographic conditions, (b): Carrier gas: hydrogen; see Figure 2 for calculated method parameters.
We will illustrate how this works in practice with two examples: one very simple, one a bit more complex. Both screen captures and actual chromatograms will be used to show how to use this tool. The first example involves a complex sample mixture and simply changing the carrier gas. The sample mixture consists of potential residual solvents in pharmaceutical formulations, typical of the United States Pharmacopeia (USP) method 467.(4) Our initial chromatogram and chromatographic conditions are depicted in Figure 1(a). A screen capture of the GC Method Translation Software is shown in Figure 2. The chromatographic parameters under consideration are shown in the left hand column of the screen while the initial conditions of the original method are shown in the second column. Here we used a DB-624 column (Agilent Technologies, Santa Clara, California, USA) with a stationary phase of 6% cyanophenylpropyl/94% dimethylpolysiloxane. The carrier gas was helium and an FID was used.
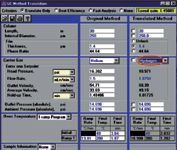
Figure 2: Screen capture: Solvents in pharmaceuticals.
Using a temperature-programmed run, a baseline separation was achieved in approximately 15 min on the 30 m × 0.25 mm i.d. column with a 1.4 µm film thickness. It was desirable to speed-up the separation without having to change the column or affect this nice resolution. Switching to hydrogen carrier gas, the right hand column of the screen capture in Figure 2 shows the conditions recommended by the Method Translation Software. Making these recommended changes in flow-rate and in the temperature programme, the chromatogram shown in Figure 1(b) now provides a 10 min baseline separation of the 30 solvents with little or no change in resolution. The entire new method was set up by the Method Translation Software without the user performing any manual calculations and without a change in the elution order of the solvent peaks. Other changes could be investigated without running another chromatogram such as increasing the flow-rate or shortening the column.
The second example involves systematic method changes looking at several chromatographic parameters. The sample this time is a mixture of 20 organochloro pesticides (OCPs). The determination of OCPs in environmental remediation samples is important, involving high-volume analyses in a competitive contract laboratory marketplace. A standard Contract Laboratory Protocol (CLP) pesticide method was used for these analyses. In many cases a laboratory will analyse large numbers of samples over the course of a given project, adding costs to both the laboratory and its client. It was desirable to decrease the analysis time by changing the carrier gas from helium to hydrogen and also decreasing the column diameter and shortening the column (but keeping the phase ratio the same).
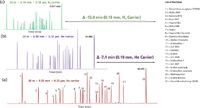
Figure 3: CLP pesticide method translation results. (a) Column: DB-35ms UI, 30 m à 0.25 mm i.d. 0.25 µm; carrier: He, constant flow, 45.17 cm/s at 110 °C; injector: splitless, 250 °C, ultra inert single taper liner with wool; oven: 110 °C for 0.638 min, 11.8 °C/min to 320 °C, hold time: 2.55 min; detector: µ-ECD, 330 °C, N2 makeup gas at 60 mL/min, (b) Column: DB-35ms UI, 20 m à 0.18 mm i.d. 0.18µm, carrier: He, constant flow, 50.0 cm/s at 110 °C; Injector: splitless 250 °C, ultra inert single taper liner with wool; oven: 110 °C for 0.384 min; 19.54 °C/min to 320 °C, hold time: 3.0 min; detector: µ-ECD, 320 °C, N2 makeup gas at 60 mL/min. (c) Column: DB-35ms UI, 20 m à 0.18 mm i.d. 0.18 µm; carrier: H2, constant flow, 78.2 cm/s at 110 °C; injector: splitless 250 °C, ultra inert single taper liner with wool; oven: 110 °C for 0.246 min, 30.55 °C/min to 320 °C, hold time: 2.0 min; detector: µ-ECD, 320 °C, N2 makeup gas at 60 mL/min.
Figure 3(a) shows the original method accomplished using DB-35ms UI (Ultra Inert) (Agilent Technologies), a 35% phenylmethylpolysiloxane phase designed to determine trace polar compounds, such as pesticides. High-content phenyl phases are known to have high selectivity for OCPs. As a result of its arylene backbone, the phase is also known for its thermal stability and high upper temperature limit (360 °C). The baseline separation of the 20 OCPs was accomplished in just over 18 min using a helium carrier gas and temperature programming conditions. A highly sensitive and halogen-selective electron capture detector (uECD) was used. The column dimensions were 30 m × 0.25 mm i.d. with a 0.25 µm film thickness. The first change investigated was moving to a shorter, smaller internal i.d. column with the same stationary phase. In GC, column efficiency is enhanced by using smaller i.d. columns at the expense of pressure increase. It is necessary to be aware of the column pressure at the high point of the temperature programme to avoid exceeding the rated pressure for the GC inlet.
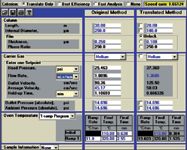
Figure 4: Screen capture: CLP pesticides method translation from 250 µm i.d. to 180 µm i.d. column using He carrier gas.
Typical gas chromatographs are usually pressure rated up to 100 psi. If this pressure is not exceeded, a method can be successfully translated to a smaller i.d. column. In our case, we also wanted to speed up the separation and a new, shorter column dimension was chosen (20 m). To keep the phase ratio the same the film thickness of the new column was estimated to be 0.18 µm. The GC Method Translation Software determines the optimum film thickness for commonly available in-stock columns for most manufacturers. Using the Translate Only mode of the software, Figure 4 shows the suggested experimental parameters for a new method, including column head pressure. The chromatogram in Figure 3(b) shows that using the suggested conditions and column (keeping He as the carrier gas), the separation time was reduced to just under 11 min: a saving of 7 min compared with the original method.
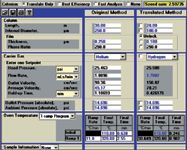
Figure 5: Screen capture: CLP pesticides method translation from 250 µm i.d. to 180 µm i.d. column using hydrogen carrier gas.
The second parameter investigated was a change in carrier gas from He to H2. As was shown in the first example, a further decrease in analysis time was determined by the GC Method Translation Software (see Figure 5 for the screen capture showing the original method and the new translated method involving both column dimensional changes and carrier gas changes). The chromatogram for the new method is depicted in Figure 3(c). Thus, a further reduction of the separation time to approximately 7 min gave a 60% reduction in time from the original method. Figure 6 shows a direct comparison of the chromatograms, emphasizing the equivalent resolution of the 22 CLP pesticide peaks under all three sets of conditions.
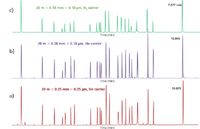
Figure 6: Comparison the of same three chromatographic conditions as Figure 4: Faster elution, same resolution.
Conclusion
The GC Method Translation Software is a free package available online or to download that helps the user to make changes to a GC method. Two examples were provided in this instalment of "Column Watch" to show how easy it is to use this software to convert, speed up and improve GC methods by changing the carrier gas and column dimensions. The tool can be used to simulate changes to other chromatographic conditions — even without performing any experiments. It also suggests experimental parameters within the scope of the instrumentation being used. For example, if you want to speed up a separation using a 0.05 mm i.d. column at a high flow-rate, the method translator would determine if the pressure required would exceed the 100 psi available from the standard gas chromatograph.
Ken Lynam is a senior applications chemist in the Chemistries and Supplies Division of the Chemical Analysis Group at Agilent Little Falls Site, Wilmington, Delaware, USA. He has worked in the pharmaceutical, environmental and industrial chemical sectors for more than 20 years developing applications using GC, GC–MS, HPLC and SFC techniques. His current focus is on application support for Agilent's capillary GC columns. "Column Watch" editor, Ronald E. Majors, is a senior scientist at the Columns and Supplies Division. Agilent Technologies, Wilmington, Delaware, USA and is a member of LCGC Europe's editorial advisory board. Direct correspondence about this column should be addressed to "Column Watch", LCGC Europe, 4A Bridgegate Pavilion, Chester Business Park, Wrexham Road, Chester CH4 9QH, UK or e-mail the editor, Alasdair Matheson, at amatheson@advanstar.com
References
1. L.M. Blumberg and M.S. Klee, Anal. Chem., 70(18), 3828–3839 (1998).
2. M.S. Klee and V. Giarrocco, "Predictable Translation of Capillary Methods for Fast GC", Agilent Technologies Application Note 5965-7673E, March, 2000.
3. http://www.chem.agilent.com/en-US/Support/Downloads/Utilities/Pages/GcMethodTranslation.aspx
4. USP general chapter <467>, Residual Solvents USP 30/NF 25 procedure, 2nd supplement, effective July 2008.
Detecting Hyper-Fast Chromatographic Peaks Using Ion Mobility Spectrometry
May 6th 2025Ion mobility spectrometers can detect trace compounds quickly, though they can face various issues with detecting certain peaks. University of Hannover scientists created a new system for resolving hyper-fast gas chromatography (GC) peaks.
Altering Capillary Gas Chromatography Systems Using Silicon Pneumatic Microvalves
May 5th 2025Many multi-column gas chromatography systems use two-position multi-port switching valves, which can suffer from delays in valve switching. Shimadzu researchers aimed to create a new sampling and switching module for these systems.
New Study Reviews Chromatography Methods for Flavonoid Analysis
April 21st 2025Flavonoids are widely used metabolites that carry out various functions in different industries, such as food and cosmetics. Detecting, separating, and quantifying them in fruit species can be a complicated process.

.png&w=3840&q=75)

.png&w=3840&q=75)


.png&w=3840&q=75)


.png&w=3840&q=75)
