Method Selection for Trace Analysis of Genotoxic Impurities in Pharmaceuticals
LCGC Europe
This article describes methods to quantitatively analyse genotoxic and potentially genotoxic impurities in pharmaceutical ingredients
This article gives an overview of methods that allow quantitative analysis of genotoxic and potentially genotoxic impurities in pharmaceutical ingredients at trace level. A method selection chart is presented. Depending on the solute characteristics, either gas chromatography (GC) or liquid chromatography (LC), both combined with a single quadrupole mass spectrometer as detector are used. Different sample preparation and sample introduction methods were evaluated in terms of automation, miniaturization, toxic solvent reduction and hyphenation. These methods were applied to different classes of genotoxic impurities covering a broad range of volatilities and polarities. Additional tools, such as capillary flow technology in GC, allowing back-flushing and heart-cutting, offer interesting possibilities for problem cases. Several applications illustrate the potential of the methods and the use of the method selection chart.
During the synthesis of active pharmaceutical ingredients (APIs) and the manufacturing of pharmaceutical products in general, reactive intermediates, catalysts, acids or bases are used. These compounds can potentially be present at trace levels in final drug products. Due to their chemical structure and reactivity, some of these solutes are recognized as genotoxic or potentially genotoxic. Recently, the possible presence of these genotoxic impurities (GTIs) or potential genotoxic impurities (PGIs) in active pharmaceutical ingredients (APIs) received increased attention1,2 and official guidelines are issued.3,4 A threshold of toxicological concern value (TTC) of 1.5μg/day (daily intake) was proposed as an acceptable risk.2,3 Based on the daily intake of the drug (dose), this translates into target limits of detection for the determination of these potential impurities in the drug substance below 1 ppm (< 1μg/g API). This is about 500 times lower than for classical impurity analysis in pharmaceutical quality control (1 ppm versus 0.05%).
As a very large number of solutes are used or tested in drug synthesis and development, no list of target solutes is available, but rather a list with "structural alert functionalities" is used.5 This list includes sulphonates (e.g., ethyl methane sulphonate), alkylhalides, arylamines, epoxides, Michael reactive acceptors and so on. It is clear that this covers an extremely broad range of polarities and volatilities. Moreover, some solutes are reactive by nature and can decompose or hydrolyse in GC or LC analysis. In combination with the large range of APIs and intermediates (water soluble, apolar, ionic, basic, acidic,...), the determination of GTIs and PGIs poses a real challenge to analytical laboratories.
KEY POINTS
Our laboratories have developed and evaluated several methods for different classes of impurities over the past few years. Rather than developing specific methods to determine a single (or a few) target analytes in a specific (known) API, the goal of our study was to develop a number of generic methods that could be applied to several impurities in a wide range of APIs. These methods form the basis for fine-tuned methods in specific cases within drug development. Developing each method on an individual basis would be incredibly time- and resource-consuming for AstraZeneca. The project, therefore, aimed at developing a strategic knowledge and approach to the whole area, which, when combined with the methods developed, would deliver significant efficiencies to the organization.
Based on our research, a method selection chart (decision tree) was constructed that is very useful to guide pharmaceutical QC scientists through the possibilities of trace analytical methods that can be applied in GTI/PGI analysis. Methods were developed using either gas chromatography (GC) or liquid chromatography (LC), both in combination with a single quadrupole mass spectrometer as detector because these techniques are commonly available in a routine QC environment. The same separation methods can, of course, also be applied using triple quadrupole instruments with multiple reaction monitoring (MRM) or using ion trap and time-of-flight (TOF) mass spectrometers.
Next, several sample preparation methods were tested on different classes of GTI/PGI in a selection of APIs, with different properties (polarity, functionalities,...). Attention is focused on sample preparation methods that are automated, robust and on-line coupled to GC or LC, while manual handling and solvent use are largely reduced or avoided.
The result of this research is the decision tree chart presented in Figure 1. Briefly, this chart starts by asking if the GTI/PGI is GC-amenable or not. If yes, the next question is whether the GTI/PGI has sufficient vapour pressure to be present in the headspace phase of a concentrated solution of the API (in water, DMSO or other low volatile solvent). If yes, static headspace (SHS), solid-phase micro-extraction (SPME) or dynamic headspace (DHS) can be used. In some cases, in situ derivatization can be applied to generate a volatile derivative of the GTI/PGI that can be analysed by SHS, SPME or DHS. If the solute is GC-amenable (stable and eluting from the GC column at moderate temperatures, e.g., < 320 °C), but not volatile enough for headspace techniques, a direct injection of a concentrated API solution in GC can be used. Attention should be paid to the volatility of the solutes and the matrix (API). Because the matrix is also introduced, the API, other API impurities and/or API decomposition products (e.g., formed in the hot GC inlet) can interfere with the target PGIs/GTIs or can influence the system performance (contamination). In this case, recently introduced techniques such as capillary flow technology (CFT) based back-flushing and two-dimensional GC (2D-GC, GC-GC) applying Deans switching can be used. In our experience, several GTI/PGI were found amenable to GC and because of the availability of robust and low cost GC–MS systems, this option should be evaluated first.
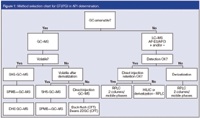
Figure 1
If the solutes are not amenable to GC, LC–MS is used. In selecting LC–MS, first a selection of the ionization mode is needed. Both atmospheric pressure electrospray ionization (AP-ESI) and atmospheric pressure chemical ionization (APCI), either operating in the positive ion (PI) or negative ion (NI) detection mode, can be evaluated in terms of sensitivity and selectivity. One mode can, for example, result in a higher absolute response, but combined with lower selectivity and/or higher background, the overall result might be that another ionization mode performs better for the given application. Flow injection of solutions of the GTI/PGI and MS acquisition in alternating + or – scan mode and the use of a multimode ESI/APCI source can be useful here.
Direct injection of a concentrated API solution, followed by reversed phase HPLC (RP-HPLC) is tested first. At very low retention of the solutes, hydrophobic interaction liquid chromatography (HILIC) or pre-column derivatization (into more hydrophobic derivatives) can be used as an alternative. All modes can be combined with MS, using either ESI or APCI. Although MS is often considered as a "universal" detection, some target solutes can give very low or non-selective response, either in ESI or APCI ionization. In these cases, derivatization prior to LC–MS can also be useful. In this article, the potential of the method selection chart is illustrated with several examples showing the trace analysis of GTIs/PGIs in APIs.
Experimental
Chemicals: A selection of APIs, commercially available from Sigma-Aldrich (Bornem, Belgium) were used as test matrices. Typically the API is dissolved at 50 mg/mL in an appropriate solvent [water, DMSO, water/DMSO (1/1) for headspace analysis, dichloromethane for direct GC analysis, acetonitrile for LC, etc.]. These solutions were spiked at low ppm level with various GTIs/PGIs (all available from Sigma). The GTIs/PGIs were diluted at 0.1–1 mg/mL and spiked in the API solutions.
Instrumentation: Various systems were used. Typical instrumental configurations are described below. Experimental details are given in the results and discussion section with the specific examples.
GC–MS methods were developed and validated on an Agilent 6890 or 7890 GC combined with a 5975 MSD (Agilent Technologies, Wilmington, Delaware, USA). The GC was equipped with a split/splitless inlet and a programmed temperature vapourizing inlet (CIS 4 PTV, Gerstel GmbH, Mulheim an der Ruhr, Germany). Injection was performed using a multipurpose sampler (MPS2, Gerstel), which allows liquid injection, SHS and SPME. The system could also be equipped with thermal desorption (TDU) and dynamic headspace (DHS) options (Gerstel).
LC–MS methods were developed on an Agilent 1100 or 1200 LC combined with a 1100 Series Quadrupole MSD (version SL) equipped with an electrospray ionization (ESI) source (Agilent Technologies, Walbronn, Germany). The HPLC system consisted of a binary pump, an automated liquid sampler, a thermostatted column oven equipped with a column switching valve and a diode array (DA) detector (optional). In the six-port/two position valve two columns were installed allowing unattended switching and column selection. A binary pump with solvent selection valve was used. Typically, the following mobile phases were used: A1: 10 mM ammonium acetate + 0.1% acetic acid in water; A2: 10 mM ammonium acetate in water; B1: acetonitrile; B2: methanol. In this way, gradients could be programmed combining A1/B1, A1/B2, A2/B1 and A2/B2. This results in eight possible column/mobile phase combinations.
The MSD was used in SIM mode either using positive or negative ion detection. During the elution of the API, the LC column effluent could be diverted to waste, not to contaminate the ionization chamber.
Results and Discussion
Analysis of organohalides: A first important class of GTI/PGI are the organohalides, which are used as alkylating agents in synthesis. Analytical methods for these solutes were reviewed by Elder et al.6 Most of the target solutes are stable, amenable to GC and are also volatile enough to allow headspace analysis. Typically, methods used for volatile organic solutes (VOCs) in environmental samples, can thus be used as a basis for this class of GTIs/PGIs. Using a dedicated column (60 m × 0.25 mm i.d. × 1.4 μm DB-VRX) and GC–MS operated in simultaneous scan/SIM mode, a generic method was developed and validated. A typical chromatogram (SIM trace) obtained for an API (promethazine) spiked with 28 solutes at 5 ppm (5 μg/g API) level is shown in Figure 2. The API (50 mg) was dissolved in 2 mL DMSO/water (1:1) and static headspace analysis was performed at 80 °C during 15 min. 1 mL headspace was injected in split mode (split ratio 1/10).
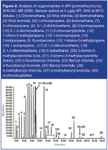
Figure 2
From the chromatogram it is clear that most solutes are well detected. Good linearity and repeatability were obtained and the limit of detection (LOD) was below 0.5 ppm for most solutes. It can also be observed that the relative response of the late eluting, less volatile compounds drops significantly, as can be expected from their lower vapour pressure. 4-methylbenzylbromide (solute 27) could not be detected at this level and also a more polar solute, such as iodoethanol (solute 19) was not detected with the SHS-GC–MS method.
Based on these results, however, it is clear that SHS-GC–MS is the first method to consider for the analysis of halides. In our study, several other GTI/PGI, such as epoxides (ethyloxirane, epichlorhydrine), mustards (2-chloroethyl methyl sulphide) and Michael reactive acceptors (acrylonitrile, methacrolein,...) could also be analysed using this generic SHS-GC–MS method.
To increase the sensitivity for some solutes, headspace solid-phase microextraction (HS-SPME) was also evaluated. A 75 μm/85 μm Carboxen/PDMS fibre was used because this fibre is recommended for the analysis of VOCs. Headspace-SPME was performed at 80 °C during 20 min. GC–MS conditions were identical to the SHS-GC–MS method. The analysis of promethazine, spiked at 0.5 ppm level, obtained by SPME and SHS respectively are compared in Figure 3. It is now clear that the late eluting solutes, with favourable PDMS-air partitioning coefficients (KPDMS/air), are concentrated in the fibre and enriched, resulting in very low detection limits. This is clearly illustrated for the solutes eluting after 12 min (peaks 16–28). 4-methylbenzylbromide (peak 27) could now be detected. Also iodo-ethanol (peak 19) could be detected, but repeatability was not good (see further). In any case, it is clear that SPME is complementary to SHS and for solutes typically eluting after toluene on an apolar column (log KPDMS/air > 3), SPME leads to higher sensitivity. It should, however, be noted that for the very volatile solutes [e.g., chloromethane (1), vinylchloride (2)], SHS is superior to SPME because no enrichment on the fibre is obtained.
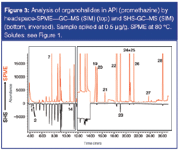
Figure 3
Another option to increase sensitivity is the use of dynamic headspace.7 In this method, the sample (50 mg in 2 mL DMSO/water placed in a 20 mL headspace vial) was purged at 20 °C during 5 min at 30 mL/min. The volatile solutes were trapped on a Tenax trap. Next, the Tenax trap was desorbed at 250 °C and the released solutes were analysed by GC–MS. Separation was performed on a 20 m × 0.18 mm i.d. × 1 μm DB-VRX. The profile (extracted ion chromatogram at m/z = 105 from scan-MS file) is shown in Figure 4. The bottom trace shows a blank API (promethazine), the top trace shows the chromatogram of the sample spiked at 2 ppm level. 4-methyl-benzylbromide (peak 27), that was not detected by static headspace GC–MS (in SIM mode) can now be detected in scan mode. Limit of detections (LODs) in SIM mode were below 0.05 ppm. Thus, dynamic headspace GC–MS can also be considered as complementary to SHS for problem cases (less volatile solutes and/or extremely high sensitivity required).
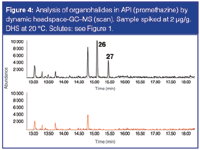
Figure 4
Analysis of sulphonates: Methyl-, ethyl- and isopropyl esters from methanesulphonic acid (mesylates), benzenesulphonic acid (besylates) and tolylsulphonic esters (tosylates) are probably the best known class of GTIs. These esters can potentially be formed from volatile alcohols (used as solvent) and sulphonic acids used to produce API-salts. The analysis of sulphonate esters is not straightforward. Methods were recently reviewed by Elder et al.8 Sulphonate esters cannot be analysed directly by headspace techniques because the vapour pressure is too low.
Moreover, direct injection in GC or HPLC is difficult and prone to artefacts such as possible formation of the GTIs by decomposition of the API-salts (false positives), hydrolysis of the sulphonates (e.g., in aqueous media) and/or API interference. An elegant method was described by Alzaga et al.9 using in situ derivatization — SHS-GC–MS. In this method, the sulphonates are derivatized (and thereby also stabilized) by reaction with pentafluorothiophenol. The methyl-, ethyl- or isopropyl- derivatives are stable and volatile and can be analysed by SHS-GC–MS. Isotope-labelled solutes, prepared in-house from deuterated alcohols reacting with sulphonic acids or sulphonyl chlorides, are used as internal standards. This method was completely automated on a dual rail autosampler (Gerstel) and could also be applied to study sulphonate ester formation kinetics.10 An example of a chromatogram obtained by the derivatization — SHS-GC–MS method for the analysis of ampicillin spiked at 1 ppm level with methyl methanesulphonate (MMS) and ethyl methanesulphonate (EMS) is shown in Figure 5. The isotope labelled standards (50 ng) were spiked in the headspace vial containing 50 mg API in 4 mL DMSO/water (1/1) (concentration = 1 ppm). Derivatization was performed by addition of 100 μL pentafluorothiophenol-solution (6.4 mg/mL in 1 N sodium hydroxide). After 15 min incubation at 105 °C, 1 mL headspace was injected (1/10 split) and analysed on a 60 m × 0.25 mm i.d. × 1.4 μm DB-VRX column. Detection was done in SIM mode at m/z = 214 (MMS-derivative), 217 (d3-MMS-derivative), 228 (EMS-derivative) and 233 (d5-EMS-derivative).
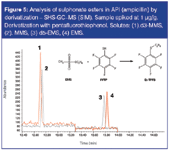
Figure 5
Analysis of S- and N- mustards: Mustards are β-halogenated dialkylsulphides [S-mustards, e.g. bis(2-chloroethyl)-sulphide] or β-halogenated amines (N-mustards). These compounds are also used as alkylating reagents in chemical synthesis. Some of these GTIs, such as 2-chloroethyl methyl sulphide, could be analysed by static headspace GC–MS. N-mustards (or "mustard-like" solutes), with a primary or secondary amine functionality, however, do not have sufficient vapour pressure to be analysed by headspace techniques. For these solutes, derivatization followed by SHS or SPME can be used. Successful analysis of these solutes could be achieved by in situ acylation using ethylchloroformate. For this analysis, 100 mg API (doxylamine) was dissolved in 2 mL solvent mixture (water/ethanol/pyridine, 2/1/1). 50 μL ethylchloroformate was added. Reaction was performed at room temperature during 15 min, followed by SPME extraction during 10 min at 80 °C using a 100 μm PDMS fibre. Analysis was performed using split (1/10) injection at 250 °C, followed by separation on a 60 m × 0.25 mm i.d. × 1.4 μm DB-VRX column. Detection was done by MS in SIM mode. The chromatogram (EIC of SIM) obtained for an API sample (doxylamine) spiked at 0.5 ppm level is shown in Figure 6. The acyl-derivatives of trifluoro-ethylamine (CF3EtNH2) (ion 144), 2-chloroethylamine (Cl-EtNH2) (ion 102), 3-chloropropylamine (IS) (ion 102) and bis (2-chloroethyl)amine (bisClEtNH) (ion 164) can be detected.
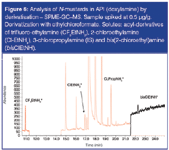
Figure 6
Analysis of halo-alcohols and epoxides: As described previously, some more polar halogenated compounds such as iodo-ethanol could not be extracted from an API solution using headspace techniques and/or bad peak shape and low repeatability/linearity were obtained (see compound 19, Figures 2 and 3). In situ derivatization of these solutes, followed by headspace analysis was also not successful. Because most of these solutes are GC amenable, direct analysis by GC was considered. In contrast to HS techniques, the APIs are hereby also introduced in the analytical system and they (or their more abundant impurities and/or degradation compounds) can interfere with GTI/PGI determination and, moreover, contaminate the analytical system (GC column, MS detector). For this reason, heart-cutting two-dimensional GC was evaluated as an alternative.11 A concentrated solution of the API is injected on an apolar first dimension column. The fraction containing the GTI/PGI is heart-cut using a capillary flow technology Deans switching device (Agilent Technologies) installed in a 7890 GC, to a second dimension column, placed in a separate low thermal mass column oven module (LTM, Agilent Technologies). The target solutes are further separated on the second dimension from interferences and detected by MS (scan/SIM mode). The main solutes (API, derivatization reagents, solvent, etc.) are not introduced in the second column, avoiding overloading and contamination of this column and of the MS source. The use of the low thermal mass oven enables an independent temperature control of the second dimension column and consequently more flexibility in method optimization.
The application of Deans switching is illustrated by the analysis of two halo-alcohols (bromo-ethanol, iodo-ethanol) and an epoxide (glycidol, 2,3-epoxy-1-propanol) in carbamazepine. Carbamazepine was dissolved in dry pyridine at 50 mg/mL. From this solution, 100 μL (= 5 mg carbamazepine) was placed in a 2 mL vial and spiked with 5 μL of the PGI test mixture (= 5 ng PGI, corresponding to 1 ppm). Then, 100 μL BSTFA was added. The vial was heated at 70 °C for 30 min. After cooling, 500 μL dichloromethane and 500 μL water were added. The mixture was vortexed and injection (1 μL in splitless mode) was performed from the lower organic layer. This sample preparation could be fully automated on an MPS2 autosampler.
The first dimension separation was done on a 30 m × 0.25 mm i.d. × 0.25 μm HP-5MS column (in GC oven). The profile obtained on a monitor FID detector after this first dimension is shown in Figure 7(a). The PGI cannot be detected, while solvent, residual silylating agent and API (also derivatized) overload this column. The fraction eluting between 8–14 min (containing the target GTIs/PGIs) was heart-cut and further analysed on a 30 m × 0.25 mm i.d. × 0.25 μm DB-17 column (in LTM oven). The chromatogram in Figure 7(b) shows the detection of the halo-alcohols and glycidol free from interferences. The 2D-GC approach is, therefore, very useful for problem cases where no headspace extraction was possible. Also some less volatile Michael reactive acceptors could be successfully analysed using this approach.11
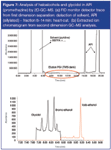
Figure 7
Analysis of aziridines, arylamines and aminopyridines: For solutes not amenable to GC, LC–MS methods were developed using a single quadrupole mass spectrometer with electrospray ionization and operating in the selected ion monitoring (SIM) mode. Of course, the same methodology can be applied using triple quadrupole instruments with multiple reaction monitoring (MRM).
For a known API with only one or a limited number of GTIs/PGIs possibly present, selective sample preparation methods based on (micro-) liquid–liquid extraction or solid-phase extraction can be developed. For generic methods, however, a concentrated solution of the API is directly injected. The major problem, hereby, is the elution of the (main) API that can interfere with the GTIs/PGIs and suppress detection (ionization). For this reason, it is not possible to develop a single HPLC method that is applicable to all analyses. We therefore developed in parallel a number of HPLC methods based on two columns, each with (minimum) two mobile phase combinations, resulting in four methods that can be applied in an automated sequence during method selection/optimization. In this way, scouting runs can be made to select the optimal column/phase combination for a given set of PGIs/GTIs in a given API. Either 2 RP-HPLC columns (e.g., C18 + phenyl) or a RP-LC and hydrophobic interaction liquid chromatography (HILIC) method can be combined. HILIC is very complementary to RP-LC, especially for more polar solutes that are eluting after the (less polar) API.
The RP-LC/HILIC approach is illustrated for the analysis of four aziridines. For this application, the HPLC system was equipped with a Alltima HP C18 column (15 cm × 3 mm i.d. × 3 μm, Grace, Lokeren, Belgium) and a Prevail Silica HILIC column (15 cm × 4.6 mm i.d. × 3 μm, Grace). Mobile phase A was 0.1% ammonium acetate + 0.1% acetic acid in water, mobile phase B was acetonitrile. The RP-LC method was using a gradient from 10% B to 100% B in 10 min (5 min hold) at 0.5 mL/min. The HILIC method was using a gradient from 100% B (2 min hold) to 50% B in 13 min (1 min hold) at 1 mL/min. Detection was done by MS using ESI in positive ion monitoring mode. The chromatograms (EIC from SIM) for a Vitamin C sample, dissolved at 100 mg/mL in acetonitrile/water (9/1), and spiked at 1 ppm level with the four solutes, are given in Figure 8. Test compounds 1 and 2 (most volatile, lowest mass) are not retained on RP-LC and are measured by the HILIC method. Test solutes 3 and 4 show more retention in RP-LC and can be separated from the API. For all solutes excellent signal-to-noise ratios are obtained, no interference from API was observed and the method could be validated.

Figure 8
A similar approach was applied to the analysis of arylamines and aminopyridines.12 In this case, direct analysis of target solutes was possible using two RP-LC methods. For the solutes with low retention, pre-column derivatization was used.
Analysis of aldehydes and ketones: Some GTIs/PGIs can be analysed either with GC or with LC. In these cases, method selection is based on ease-of-use of the method, robustness and possible automation. A typical group of solutes that can be analysed with GC and LC are aldehydes and ketones. For these solutes, the separation itself is not critical but detection is difficult. Formaldehyde elutes very fast in GC–MS and no specific ions are present for sensitive and selective detection. Therefore derivatization is often applied, both in GC and LC.
In our study, pre-column derivatization using 2,4-dinitrophenylhydrazine (DNPH) was applied for solutes with carbonyl functionality. This method allowed the analysis of relatively volatile solutes (e.g., C1–C10 aldehydes) and less volatile solutes (e.g., 4-hydroxybenzaldehyde) using the same method. Isotopically labelled aldehydes were used as internal standards to improve the repeatability and accuracy of the method. The separation was performed on a Zorbax Stablebond Phenyl column (15 cm × 3 mm i.d. × 3.5 μm, Agilent), using a 10 mM ammonium acetate in water (solvent A)/acetonitrile (solvent B) gradient from 36% B to 100% B at 12.5 min with a 0.65 mL/min flow rate. Derivatization was automated in the 1100 series ALS. The sample was dissolved in a mixture of methanol/acetonitrile/water (2/1/1) at 50 mg/mL. Internal standard was added at 0.5 ppm level. From the sample solution, 4 μL was drawn in the sampler, followed by 1 μL DNPH solution (500 mg 2,4-dinitrophenylhydrazine is dissolved in 10 mL methanol, 1 mL conc. sulphuric acid is added and the solution is diluted to 50 mL with methanol, resulting concentration: 1%). Detection is done by MS using electrospray ionization in the negative ion monitoring mode.
The analysis is demonstrated on a metoclopramine sample spiked with a set of aldehydes at 1 ppm level. The resulting chromatogram is shown in Figure 9. Metoclopramide elutes before 4 min. The derivatized aldehydes are clearly detected in the extracted ion chromatograms. The most volatile aldehyde (formaldehyde) can also be detected at this level without API interference.
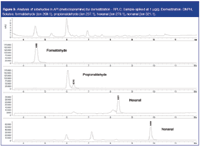
Figure 9
Analysis of hydrazines: The same methodology was applied for the analysis of hydrazines. In this case, hexylchloroformate was used as pre-column derivatization reagent, resulting in N-acyl derivatives showing higher retention in RP-LC and good detectability by MS. An example is shown in Figure 10. Vitamin C was dissolved at 100 mg/mL in acetonitrile and spiked with 1-methylhydrazine, acetohydrazide, 2-hydrazinoethanol and phenylhydrazine at 1 ppm level. To the sample, 7 mL borate buffer (15 mM sodium tetraborate, pH 9.5 in 10% acetonitrile) was added, followed by 0.5 mL hexylchloroformate solution (2% in acetonitrile). After reaction during 15 min at room temperature, the reaction is stopped by adding 0.5 mL phosphoric acid (17% in water) and injection was performed. The separation was performed on a Zorbax Eclipse Plus column (15 cm × 3 mm i.d. × 3.5 μm, Agilent Technologies), using 0.05% formic acid in water (solvent A)/acetonitrile (solvent B) gradient from 15% B to 100% B at 19 min with a 0.5 mL/min flow rate. Detection is done by MS in SIM mode using ESI in positive ion monitoring mode.
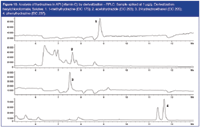
Figure 10
Conclusions
The chart shown in Figure 1 offers an interesting tool for method selection for the determination of GTIs/PGIs in APIs. Static headspace in combination with GC–MS can be used for the most volatile organohalides. SPME and DHS can be used to extend the headspace extraction to less volatile solutes and also offer very high sensitivities. For non-volatile solutes, such as sulphonate esters and N-mustards, derivatization-SHS or derivatization-SPME can be used.
Haloalcohols were analysed after derivatization and direct injection. Heart-cutting 2D-GC was used to avoid solute interference and MS source contamination. Non-volatile compounds are analysed by LC–MS. An automated selectable column approach using two RP-LC or a RP-LC/HILIC approach was used for aziridines, arylamines and aminopyridines. Solutes with low retention in RP-LC can also be analysed after pre-column derivatization. Derivatization is also useful to increase detectability in MS, as demonstrated by the analysis of aldehydes and hydrazines.
Acknowledgements
The authors would like to thank all the individuals and technical groups within AstraZeneca who contributed to the set up and running of this project, in particular Hans Jurgen Federsel and the members of Global Process R&D External Sciences Leadership Group.
Frank David is R&D manager at the Research Institute for Chromatography (RIC) and visiting professor at the Ghent University, Belgium.
Karine Jacq is GC specialist at RIC, Belgium.
Gerd vanhoenacker is liquid phase specialist and LC product manager at RIC, Belgium.
Pat Sandra is director of RIC and professor at the Ghent University, Belgium.
Andrew Baker works for AstraZeneca R&D within Analytical Chemistry at Loughborough, UK.
References
1. T. McGovern et al., Trends in Analytical Chemistry, 25(8), 790 (2006).
2. L. Muller et al., Toxicol. Pharmacol., 44, 198 (2006).
3. European Medicines Evaluation Agency, Committee for Medicinal Products for Human Use, Guideline on the limits of genotoxic impurities, CPMP/SWP/5199/02, London, 28 June 2006 (http://www.emea.europa.eu/pdfs/human/swp/519902en.pdf)
4. Guidance for Industry. Genotoxic and Carcinogenic Impurities in Drug Substances and Products: Recommended Approaches. US Department of Health and Human Services, FDA, Center for Drug Evaluation and Research (CDER), December 2008.
5. Information on structural alert functionalities can be found at: http://ecb.jrc.ec.europa.eu/documents/QSAR/EUR_23844_EN.pdf.
6. D.P. Elder, A.M. Lipczynski and A. Teasdale, J. Pharm. Biomed. Anal., 48, 497 (2008).
7. DHS brochure Gerstel GmbH, http://www.gerstel.com/en/dynamic-headspace.htm
8. D.P. Elder, A. Teasdale and A.M. Lipczynski, J. Pharm. Biomed. Anal., 46, 1 (2008).
9. R. Alzaga et al., J. Pharm. Biomed. Anal., 45, 472 (2007).
10. K. Jacq et al., J. Pharm. Biomed. Anal., 48, 1339 (2008).
11. F. David et al., Anal. Bioanal. Chem., 2009, submitted.
12. G. Vanhoenacker et al., J. Chrom. A, 1216, 3563 (2009).

Polysorbate Quantification and Degradation Analysis via LC and Charged Aerosol Detection
April 9th 2025Scientists from ThermoFisher Scientific published a review article in the Journal of Chromatography A that provided an overview of HPLC analysis using charged aerosol detection can help with polysorbate quantification.
Removing Double-Stranded RNA Impurities Using Chromatography
April 8th 2025Researchers from Agency for Science, Technology and Research in Singapore recently published a review article exploring how chromatography can be used to remove double-stranded RNA impurities during mRNA therapeutics production.


