Kinetic Plots Made Easy
Guest "LC Troubleshooting" columnist Uwe Neue unravels the mysteries surrounding kinetic plots to make them accessible to everyone
Kinetic plots have recently become the tool to compare different liquid chromatography (LC) columns, particles and particle sizes with each other. Questions about performance, column length and the merits of very high pressures have also been tackled using the same tools. However, the discussion of kinetic plots has been limited to only a few authors and even between them one can see a multitude of different versions of the kinetic plots, together with often very different interpretations. The understanding has remained limited to a few experts. However, this does not need to be so. In this month's "LC Troubleshooting", we will develop the principle of these kinetic plots from scratch so that they become accessible to everyone. The content of this article is based on a presentation from Pittcon 2009.1
The very first example of a kinetic plot — although not called by this name — was shown by Giddings in 1965 in a "comparison of theoretical limit of separation speed in gas and liquid chromatography".2 A paper in German by Halász and Görlitz,3 unread by later investigators, outlined the complete theory of kinetic plots, without the use of this expression, which was created by Desmet and coworkers around 2005.4,5 Later, and apparently independently, Poppe used kinetic plots to explore the compromises between speed and efficiency in LC.6 The credit for the modern resurrection of these "Poppe plots" probably goes equally to Schoenmakers for the use of Poppe plots in size exclusion chromatography7 and to Desmet and coworkers, who published two important papers4,5 that laid the foundation for the modern use of kinetic plots. Wang expanded the Poppe plot to gradient conditions.8
Desmet followed up with many papers using the kinetic plots for a range of comparisons between different devices or chromatographic conditions, from monoliths9 to elevated temperature,10,11 to very small particles.12–14 His views have been summarized in reference 15 with an outlook on the future technology and designs of column support formats. A recent publication by Carr elaborated the math of kinetic plots and related optimizations.16 In more practically oriented papers, the conditions required to reach 100000 plates,17 the validity of kinetic plots under ultrahigh-pressure liquid chromatography (UHPLC) conditions,18 the influence of analyte properties19 and the properties of different packings20 have been examined using the kinetic plot tools.
Many chromatographers are not very familiar with kinetic plots, so we decided to present a simple, but accurate, description of this technique. We have chosen to minimize the mathematical complexity; however, the underlying math can be found in a sidebar. To describe the technique, we will start with plots of plate number N versus analysis time, which have been used frequently to explain column performance.21–24 The limiting form of these plots is one basic version of a kinetic plot. We then show how the basic kinetic plot changes as we change the particle size. Finally, we will briefly cover other versions of these plots and explain why and under what circumstances they are useful.
A Simple Kinetic Plot
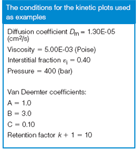
Figure 1 is a plot of the plate number as a function of the analysis time for a 100 mm-long column packed with 3.5 μm particles. The curve was calculated for a fixed retention factor of k + 1 = 10. At short analysis times (high flow rates), the plate number is low and increases as we reduce the flow rate, that is, as the analysis time increases. A maximum plate number is reached as we further increase the analysis time (by reduction of the flow rate). Then the column performance declines as we get into the diffusion-controlled range of the van Deemter curve for this particle size at very low flow rates. The curve stops at the left at the point where the pressure limit of the LC instrument is reached. We have chosen a value of 400 bar (6000 psi), corresponding to the upper pressure limit of conventional LC equipment. The point where the limiting pressure is reached is one point of the kinetic plot curve.

Figure 1
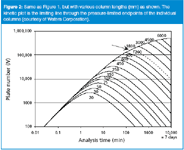
We can generate the same curve for a range of different column lengths, all packed with the same particle size. This is shown in Figure 2. Here, the column length is varied from 20 to 6000 mm (6 m). The pressure limit is kept at 400 bar for all column lengths. This means that we can run the fastest analysis on the shortest column: with a 20 mm column, the analysis time is 2.5 s, with a plate number of 175 plates. The speed of the analysis changes quickly with the column length (remember that the pressure is fixed at 400 bar).The 50 mm column reaches about 1000 plates in 15 s at 400 bar, whereas the 150 and 250 mm-long columns generate 8000 and 19000 plates, respectively, at the pressure limit. At the other end of the graph, approximately 400000 plates can be achieved in 1.5 days with a 4500 mm-long column. The upper limit of the time axis was arbitrarily set to 10000 min, or about 7 days.

Figure 2
A kinetic plot is simply the line drawn through the individual column graphs at the point where each column reaches the pressure limit that we have selected. This corresponds to the heavy line on the left side of the graph. It tells us what plate number is achievable at a particular analysis time for the selected particle size at the preselected pressure. In the kinetic plot view of the world, the column length is freely adjustable. Thus, it shows directly the compromise between the analysis time and the plate number that can be reached with the given particle size and pressure limit. This pressure limit is often that of the LC instrument; in most cases 400 bar, as selected here.
Comparison of Particle Sizes
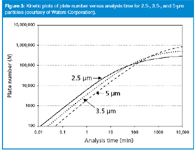
Now that we have seen the origin of the kinetic plot, let's compare kinetic plots for different particle sizes. Figure 2 shows the kinetic plot for 3.5 μm particles. Figure 3 compares kinetic plots for 5, 3.5 and 2.5 μm particles. We see that for short analysis times, for example, <30 min, the 2.5 μm particle columns always outperform the 3.5 μm columns, which in turn give higher plate numbers than 5 μm columns. However, at analysis times > 5 h (300 min), the highest performance is achieved with the largest particle size. This is due to the fact that the diffusion-controlled section of the kinetic plot is reached at a longer analysis time than for smaller particles. This corresponds to flow rates smaller than those at the minimum of the van Deemter curve for a given particle size. In agreement with the classical findings by Guiochon,25,26 a larger particle will, at the given pressure, outperform the smaller particle at a longer analysis time than at this point. This is the reason for the better performance of the larger particles at long analysis times in Figure 3. Also, the crossover point between 2.5 μm particles and 3.5 μm particles in Figure 3 is ≈80 min; at longer analysis times, columns packed with 3.5 μm particles are preferred, and for faster analyses, the 2.5 μm particles are the better choice. For fast analysis, one will always get an improvement with the smaller particle size.

Figure 3
Other Forms of Kinetic Plots
The plots of plate number versus analysis time are, in our view, the simplest way to understand kinetic plots and the best way to see what kinetic plots can teach us. However, they are not the classical kinetic plots as used by Poppe. The conversion from the plots discussed earlier to a Poppe plot is shown in Figure 4. First, we invert the axes, showing the plate number on the x-axis and the time on the y-axis [Figure 4(a)]. We also replace the analysis time with the retention time for an unretained peak (that is, the column dead-time, t0). This form of the kinetic plot was shown in some articles by Desmet, for example.4 Next, we divide the dead time by the plate number to obtain the "plate time", as it was called by Poppe6 — the amount of time it takes to generate one theoretical plate.

Figure 4
A plot of plate time versus plate number is shown in Figure 4(b) for columns packed with 2.5 μm and 3.5 μm particles. We see that a smaller plate time is reached with the smaller particle size. We also see that the highest plate number achievable is limited by the particle size. In our opinion, this is the ingenuity of the Poppe plot: one recognizes immediately the limits of a given particle size both with respect to the speed that can be reached at very short analysis time and the ultimate maximum plate number achievable at infinitely long analysis times. However, Figure 3 gives a better understanding of the true merits of different particle sizes under intermediate conditions, which are of relevance for the practising chromatographer.

How to generate kinetic plots.
There is one small but important flaw in the Poppe plot and this becomes critical if one wants to compare particles of different porosities. There is no direct link between the back pressure required for operating a column and the column dead-time. The reason for this is that there is only flow in the interstitial fraction of a packed bed — that is, between the particles (reference 22, page 15); for a comparison of particles with different porosities one should use the interstitial velocity, not the linear velocity, as used by Poppe. Alternatively, one can convert a Poppe plot into a plot at a fixed ratio of analysis time to interstitial time, and the "plate time" becomes an "analysis time per plate". This is equivalent to the idea with which we started: in Figure 2, we plotted the plate number versus the analysis time.

The conditions for the kinetic plots used as examples
The Desmet team expanded and refined the Poppe plot further, following the idea of separation impedance E first proposed by Knox:28

At a fixed pressure Δp, and a fixed mobile phase with the viscosity η, the second fraction in Equation 1 is constant, so plots of t0/N2 versus the plate number N are equivalent to plotting the separation impedance as a function of the achievable plate number.
The Desmet team also inverted the plate number axis, to make this plot resemble a van Deemter curve (higher mobile phase velocities and lower plate counts to the right). Such a kinetic plot is shown in Figure 4(c) for the 2.5 μm and 3.5 μm particles. In this case, curves of columns of equal overall quality reach the same lowest point and this point is the equivalent of the point indicated by the arrow in Figure 2. It is the point where the kinetic plot reaches the van Deemter minimum for the selected particle size. The value of t0/N2 at this point depends upon the selected pressure and the mobile phase viscosity (see Equation 1). Lower (better) values are obtained with columns with a higher permeability or that are packed better. On the right side of the graph, the high speed side, one also sees that the smaller particles reach lower (better) values. On the left side of the graph, the plots end at the plate-number limit for the chosen particle size. This side of the graph also depends upon the axial diffusion term in the van Deemter equation, similar to the situation in the van Deemter plot itself. As already pointed out in the discussion of Figure 3, the highest plate numbers are achieved with the larger particles, albeit at analysis times that are outside the interest range of practical chromatography. The most important application of the separation impedance kinetic plot is a comparison of different technologies, such as packed beds versus monoliths versus open-tubular chromatography, or for the comparison of micromachined ordered or disordered pillar arrays.9,15,29 Other versions of kinetic plots exist, as well. For example, in a recent review paper,4 more sophisticated forms of kinetic plots were discussed. A detailed description of such forms is outside our intention, which was an introduction into the thought process behind kinetic plots.
Conclusions
It should be noted that in all the comparisons shown in this discussion, the retention factor k of the analyte was kept constant. However, all the kinetic plots are a function of the retention factor, primarily due to the fact that the diffusion term of the van Deemter equation increases with increasing retention. The consequence of this is the nagging realization that kinetic plots are not universal, but depend upon the details of the implementation. Also, the axes of the kinetic plots depend upon the viscosity of the mobile phase, and, most of all, they depend upon the pressure that we allow. Thus, kinetic plots for very high pressure LC (> 400 bar) are different from kinetic plots for conventional LC (< 400 bar). And, of course, they also depend upon the properties of the analytes that have been chosen, especially on the analyte diffusion coefficient. It is worthwhile to keep these items in mind when comparing kinetic plots obtained by different authors.
Sometimes manufacturers' literature and other sources of column information make it difficult to compare the performance of different column configurations. Kinetic plots are a useful tool to compare the performance of different columns and particle sizes in a manner that uses a "level playing field". For example, in several plots shown here, it is easily seen that 2.5 μm particles out-perform 3.5 μm particles for fast analyses, but for very long analyses, larger particles have the advantage. In other applications, one can determine the best particle size, flow rate and column length to generate a particular plate number at a chosen pressure. Kinetic plots are one more tool that practising chromatographers can use to compare separation conditions and to make the best column choice for an application.
Uwe Neue is Corporate Fellow with Waters Corporation, Milford, Massachusetts.
E-mail: Uwe_Neue@waters.com
"LC Troubleshooting" editor John W. Dolan is vice president of LC Resources, Walnut Creek, California, USA; and a member of the Editorial Advisory Board of LC GC Europe. Direct correspondence about this column to "LC Troubleshooting", LC GC Europe, Park West, Sealand Road, Chester CH1 4RN, UK.
For an ongoing discussion of LC Troubleshooting with John Dolan and other chromatographers, visit the Chromatography Forum discussion group at www.chromforum.org
References
1. U.D. Neue, et al., Paper 1760-1, Pittcon 2009, Chicago, Illinois, USA.
2. J.C. Giddings, Anal. Chem., 37, 60–63 (1965).
3. I. Halász and G. Görlitz, Angew. Chem., 94, 50–62 (1982).
4. H. Poppe, J. Chromatogr. A., 778, 3–21 (1997).
5. S.-T. Popovici and P.J. Schoenmakers, J. Chromatogr. A., 1073, 87–91 (2005).
6. G. Desmet, D. Clicq and P. Gzil, Anal. Chem., 77, 4058–4070 (2005).
7. G. Desmet et al., Anal. Chem., 78, 2150–2162 (2006).
8. X.Wang et al., J. Chromatogr. A., 1125, 177–181 (2006).
9. S. Eeltink et al., J. Chromatogr. A., 1130, 108–114 (2006).
10. D. Cabooter et al., J. Chromatogr. A., 1143, 121–133 (2007).
11. D. Clicq et al, J. Chromatogr. A., 1146, 193–201 (2007).
12. J. Billen et al., J. Chromatogr. A., 1161, 224–233 (2007).
13. D. Cabooter et al., J. Chromatogr. A., 1204, 1–10 (2008).
14. S. Heinisch et al., J. Chromatogr. A., 1203, 124–136 (2008).
15. J. Billen and G. Desmet, J. Chromatogr. A., 1168, 73–99 (2007).
16. P.W. Carr, X. Wang and D.R. Stoll, Anal. Chem., 81, 5342–5353 (2009).
17. D. Cabooter et al., J. Chromatogr. A., 1212, 23–34 (2008).
18. D. Cabooter et al., J. Chromatogr. A., 1216, 3895–3903 (2009).
19. A. de Villiers, F. Lynen and P. Sandra, J. Chromatogr. A., 1236, 3431–3442 (2009).
20. Y. Zhang et al., J. Chromatogr. A., 1216, 4597–4605 (2009).
21. U. Neue, Waters Column IV (1993), 1–5 (Waters Corporation).
22. U.D. Neue, HPLC-Columns — Theory, Technology, and Practice (Wiley-VCH, 1997).
23. Pharmaceutical Analysis by HPLC, M. Dong and S. Ahuja, Eds. (Academic Press, Elsevier, Amsterdam, 2005), pp. 77–122.
24. U.D. Neue et al., HPLC Columns and Packings, in "HPLC. Method Development for Pharmaceuticals", S. Ahuja and H. Rasmussen, Eds., Separation Science and Technology Series, Vol. 8 (Elsevier, Amsterdam, 2007) pp. 45–83.
25. M. Martin, C. Eon and G. Guiochon, J. Chromatogr. A., 99, 357–376 (1974).
26. M. Martin, C. Eon and G. Guiochon, J. Chromatogr. A., 108 (1975) 229–241.
27. M. Martin, C. Eon and G. Guiochon, J. Chromatogr. A., 110 (1975) 213–232.
28. P.A. Bristow and J.H. Knox, Chromatographia, 10, 279–288, (1977).
29. P. Gzil et al., Anal. Chem., 75, 6244–6250 (2003).

New TRC Facility Accelerates Innovation and Delivery
April 25th 2025We’ve expanded our capabilities with a state-of-the-art, 200,000 sq ft TRC facility in Toronto, completed in 2024 and staffed by over 100 PhD- and MSc-level scientists. This investment enables the development of more innovative compounds, a broader catalogue and custom offering, and streamlined operations for faster delivery. • Our extensive range of over 100,000 high-quality research chemicals—including APIs, metabolites, and impurities in both native and stable isotope-labelled forms—provides essential tools for uncovering molecular disease mechanisms and exploring new opportunities for therapeutic intervention.
New Guide: Characterising Impurity Standards – What Defines “Good Enough?”
April 25th 2025Impurity reference standards (IRSs) are essential for accurately identifying and quantifying impurities in pharmaceutical development and manufacturing. Yet, with limited regulatory guidance on how much characterisation is truly required for different applications, selecting the right standard can be challenging. To help, LGC has developed a new interactive multimedia guide, packed with expert insights to support your decision-making and give you greater confidence when choosing the right IRS for your specific needs.

.png&w=3840&q=75)

.png&w=3840&q=75)


.png&w=3840&q=75)


.png&w=3840&q=75)


