Method Development for the Qualitative and Quantitative Analysis of Pesticides by Direct Injection Liquid Chromatography– Tandem Mass Spectrometry (LC–MS/MS)
This modification of ASTM method D8026 for pesticides in environmental matrices includes more pesticides and lowers the reporting limits, thus increasing throughput and measurement capacity for a large surface-water monitoring project.
Qualitative and quantitative assessment of pesticides in stream resources is required to provide information on target pesticides and to characterize the conditions of water resources. The goal of this study was to modify a method for pesticides in environmental matrices (ASTM D8025) to include more pesticides and lower the reporting limits. This modified ASTM method would then be used to analyze samples at the Region 5 Analytical Services Branch.
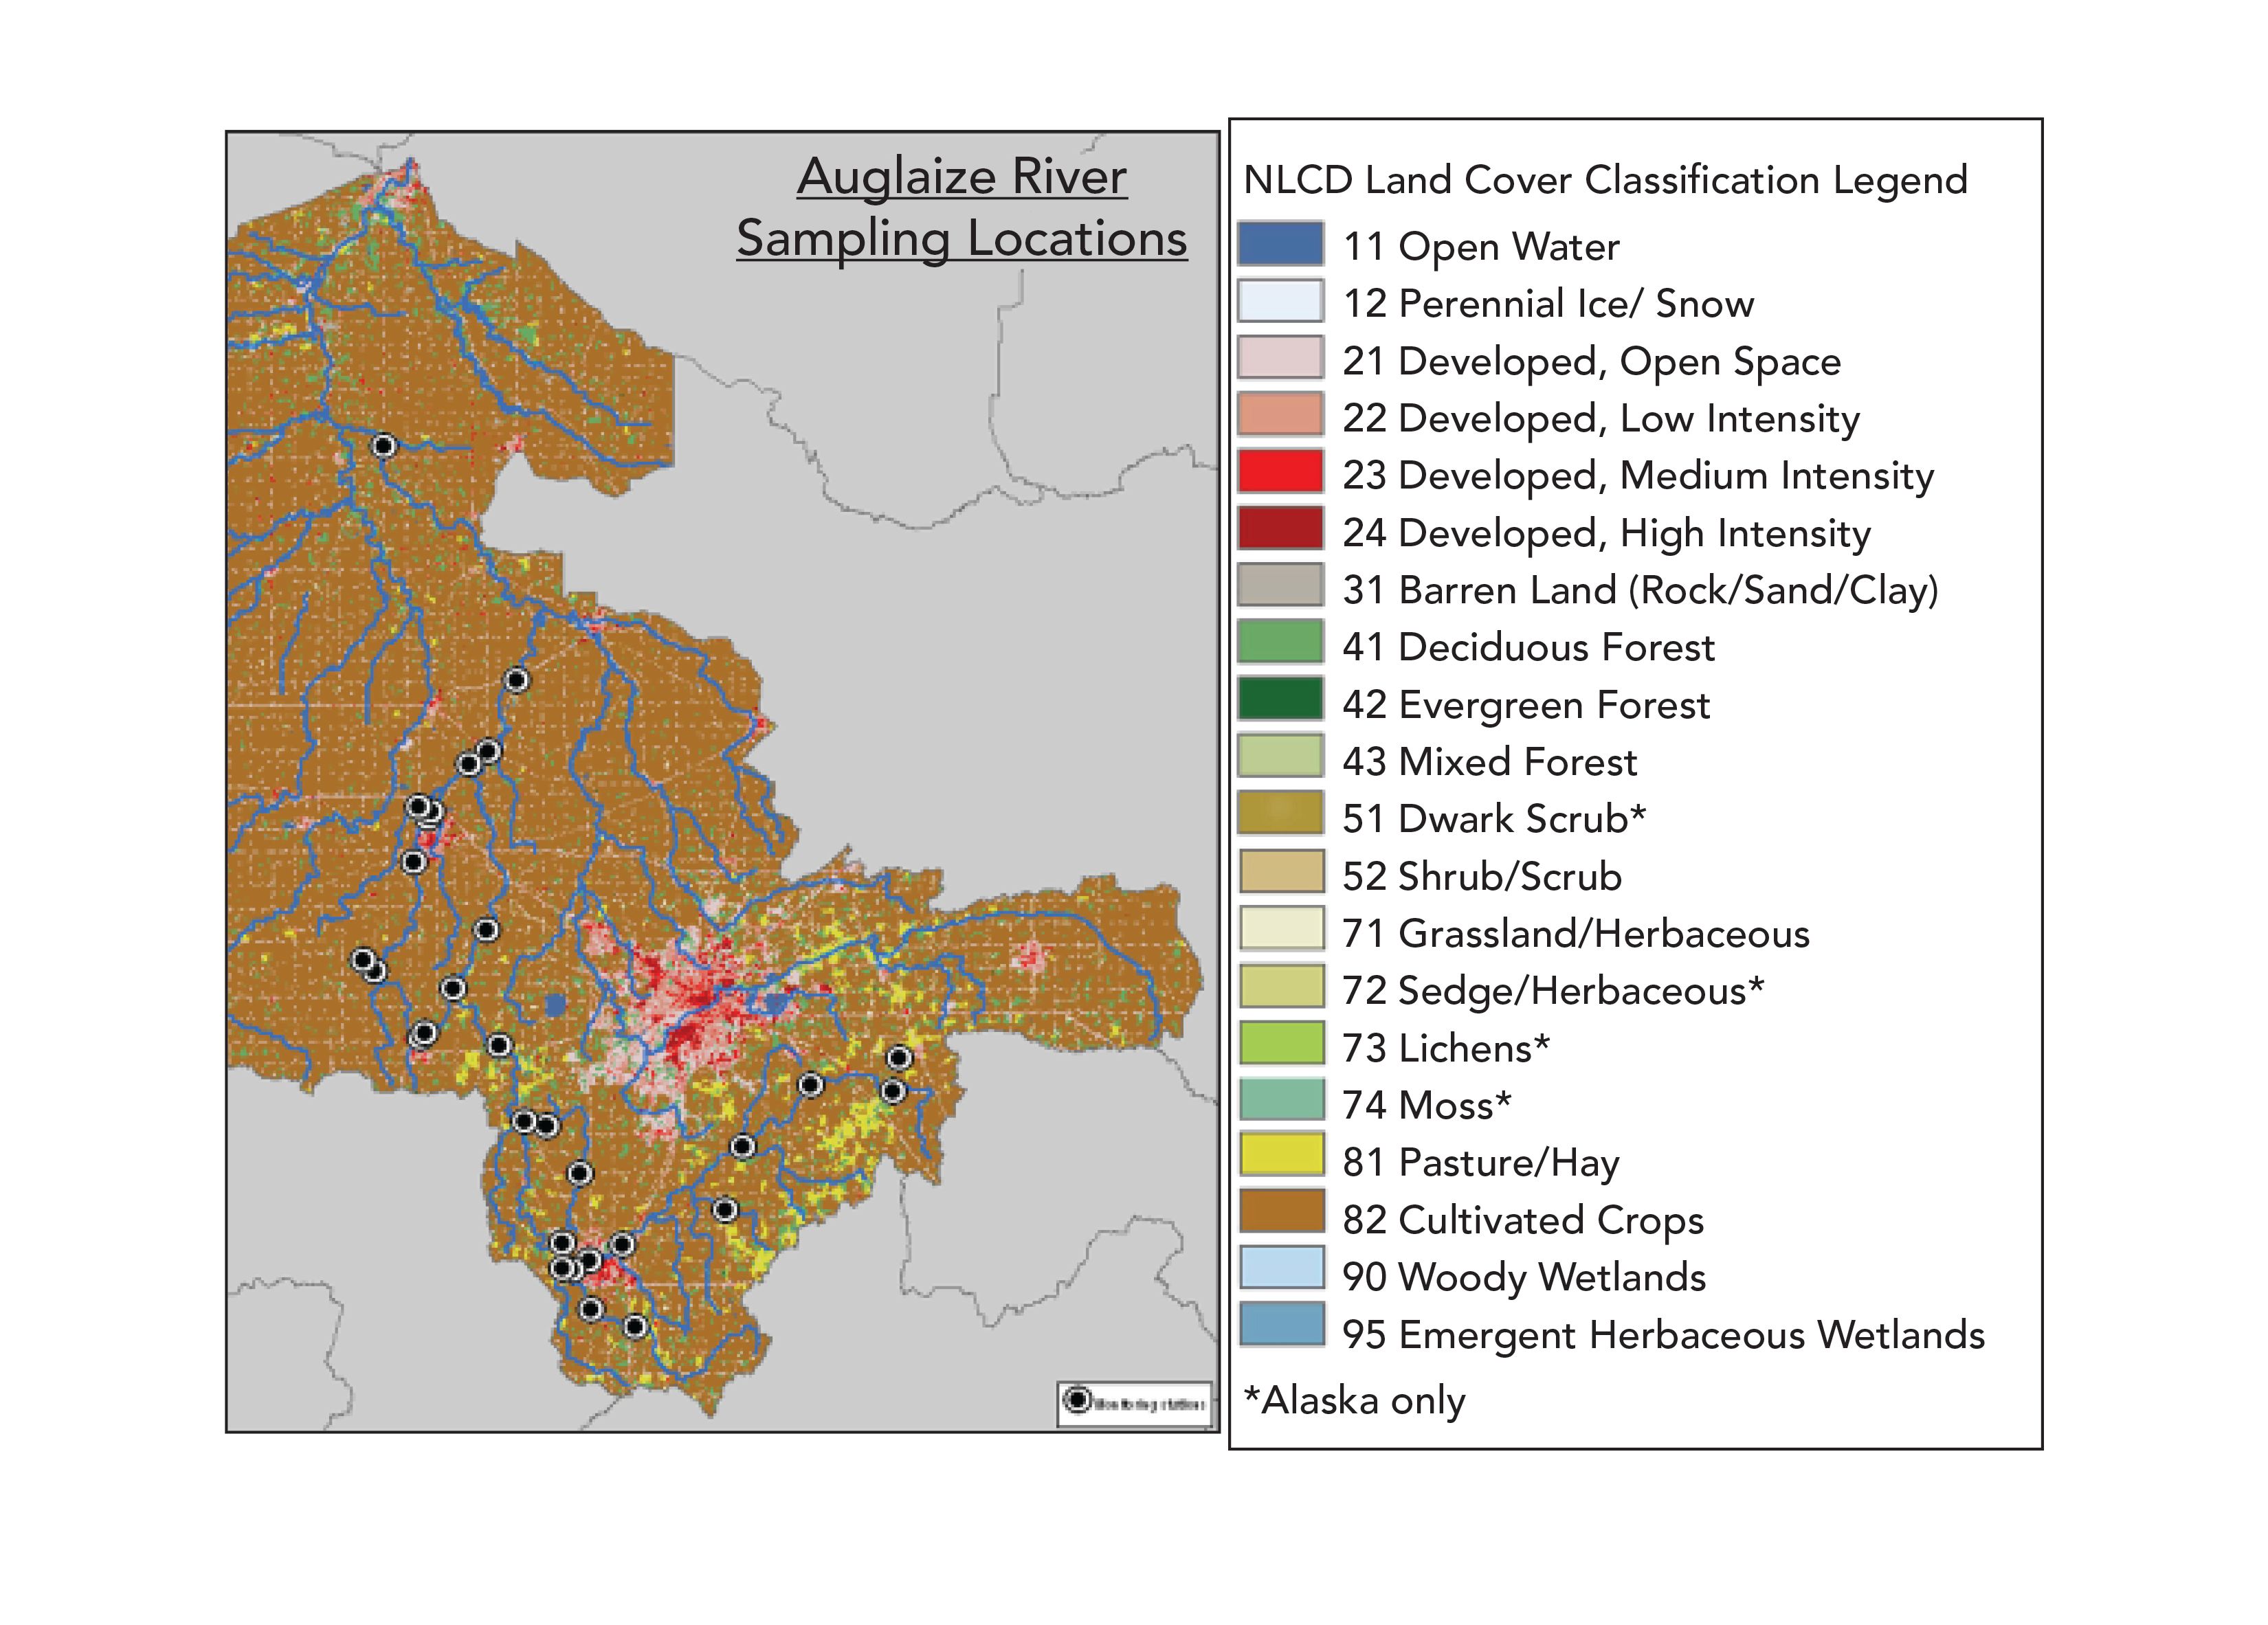
In 2015 and 2016, Region 5 (Land and Chemicals Branch, Water Quality Branch, and Analytical Services Branch) collaborated with the Illinois Environmental Protection Agency (IEPA), and in 2018, with the Ohio Environmental Protection Agency (OEPA), to collect and analyze water samples for pesticides. The samples were collected from IEPA ambient surface water monitoring sites, primarily from rivers and streams in the Chicago Metropolitan area. Samples collected in 2018 were from the Cuyahoga River Watershed. The most recent pilot project for the Ohio Auglaize Basin was sampled by the Ohio EPA between June and September 2019 (see Figure 1 for sample locations). A modified version of ASTM D8025 (1), Standard Test Method for Determination of Select Pesticides in Water by Multiple Reaction Monitoring Liquid Chromatography Tandem Mass Spectrometry, was utilized.
Figure 1: Auglaize Watershed and classification legend.
The ASTM test method covers the analysis of selected pesticides in a water matrix by addition of a water-miscible organic solvent, filtration, and analysis with liquid chromatography (LC) or electrospray ionization (EI) tandem mass spectrometry (MS/MS) analysis. This method was developed for the watershed and agricultural runoff study, not for low concentrations of pesticides in drinking water. This method was modified for lower-level analysis, along with the inclusion of more analytes of interest. These modifications are explained in this paper. The analytes are qualitatively and quantitatively determined by this method.
The goal of this paper is to make users aware of this comprehensive, streamlined analysis method for analysis of pesticides in environmental matrices. This modified method uses more sensitive and robust instrumentation that was not available several years ago, when the ASTM method was originally published.
Materials and Methods
The method described here is derived from ASTM D8025-16 (please refer to the ASTM method for detailed analytical descriptions). The rationale of ASTM D8025-16 was to develop a pesticide method that eliminates time-consuming extraction and derivatization, decreases the sample volume and reagent usage, and is easy enough that an experienced analyst can prepare multiple batches of samples in as short a time possible and in the smallest amount of bench space possible. By decreasing sample size and solvent usage, along with eliminating the need for extensive sample preparation, the method meets an ASTM obligation to United Nations sustainability waste reduction goals (2).
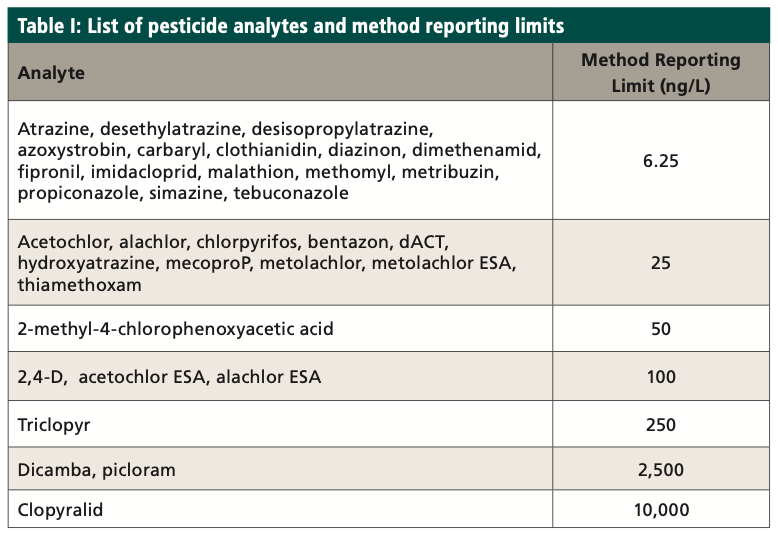
ASTM D8025 includes 27 targeted pesticides and 14 isotopically labeled surrogates. Eight mL of sample is spiked with surrogate and mixed with 2 mL of methanol in a glass vial. Samples are hand shaken for 2 min, filtered, and analyzed using liquid chromatography–triple quadrupole mass spectrometry (LC–MS/MS). The original method was expanded to 34 pesticides, and method reporting limits were greatly lowered, to meet the new chronic toxicity benchmark levels. Modifications were made following ASTM Guide E1488 (3) and validated using ASTM Guide E2857 (4). Table I shows the expanded list of analytes, along with the method reporting limits. The same LC conditions in ASTM D8025 were used in the modified method to meet EPA data quality objectives.
An external calibration technique is used to monitor the primary and confirmatory multiple reaction monitoring (MRM) transitions of each analyte. The instrument software conducts the quantitation of the target analytes and surrogates using the primary MRM transition. The primary–confirmatory MRM transition area ratio should be within 35% of the individual laboratory’s accepted primary–confirmatory MRM transition area ratio. The primary MRM transition of each analyte is used for quantitation, and the confirmatory MRM transition is used for confirmation. This approach gives added confirmation by isolating the precursor ion, forming two product ions by means of fragmentation, and relating the precursor ion to the retention time in the calibration standard. Concentrations were calculated using the instrument software to generate a linear regression. The point of origin is excluded, and a fit weighting of 1/x is used to give more emphasis to the lower concentrations.
Equipment and Materials
Briefly, the method was developed using a Waters Acquity UPLC H Class System equipped with a reversed-phase C18 column. A Waters Xevo-TQS was initially used in the development of ASTM D8025. The updated expanded pesticide list shown in this paper (Table I), along with the lower reporting limit method, utilized a Xevo-TQXS instrument. These minimum reporting concentrations of the target analytes were decided upon as being equal to, or lower than, the chronic health effect concentrations. With modern LC–MS/MS instrumentation, even lower reporting limits are achievable.
Sample Collection
Grab samples were collected in 40 mL amber glass volatile organic analysis (VOA) vials with polytetrafluoro-ethylene-lined caps. Field blanks are needed to follow conventional sampling practices. It is best to collect an 8.0 mL sample in a 20- or 40-mL amber glass VOA vial in the field and use the entire sample in the laboratory to eliminate the subsampling step. This will allow the entire sample to be analyzed. If this is done, each sample should be taken in at least duplicates, and any sample that is used for the matrix spike, matrix spike duplicate, and duplicate must also be taken in separate tubes. All samples are iced or refrigerated at <6 °C from the time of collection until sample analysis. At the laboratory, all samples are always stored in the refrigerator at <6 °C while not being analyzed.
Because holding times have not yet been established for these analytes in the various matrices, a default holding time of 28 d is used. Quality control (QC) samples are included with every batch of samples and include field blanks, equipment blanks, method blanks, method reporting limit samples, blank spike samples, and matrix spike samples.
Method Reporting Limit
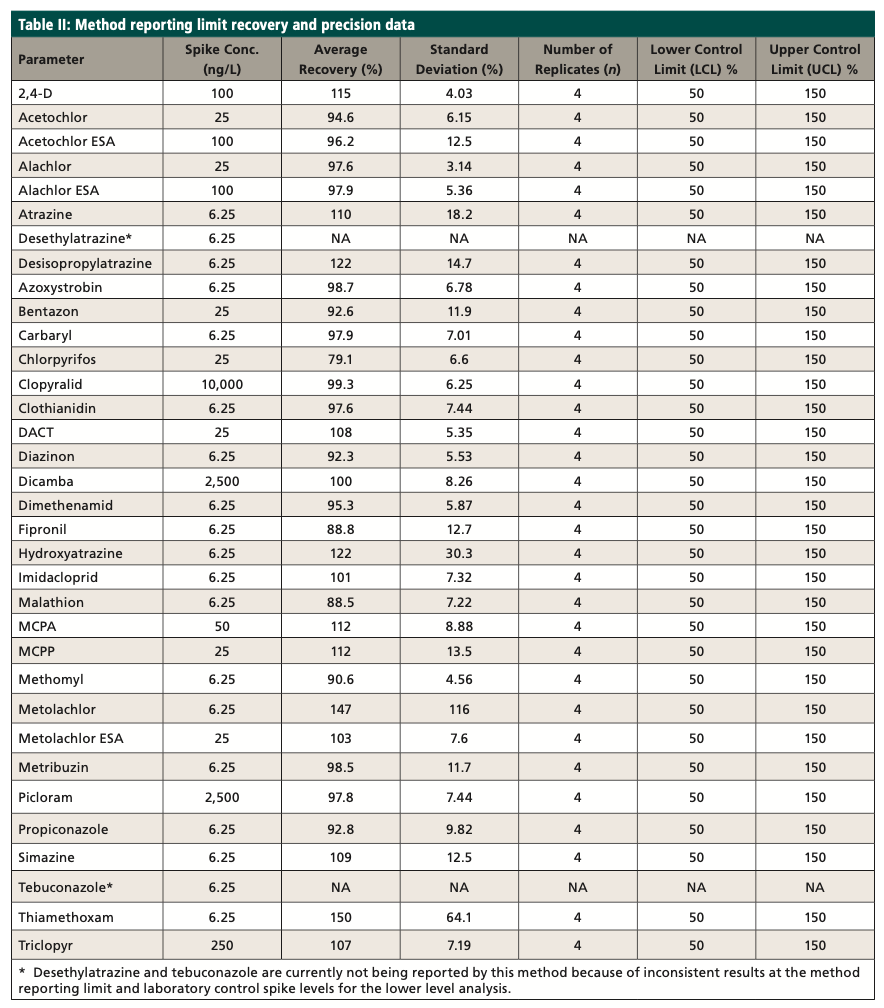
A method reporting limit (MRL) study was conducted during the development of the method, and an MRL check was analyzed from each batch within the 24-h analysis window to ensure the reporting limit was achieved. The reporting limit check sample (RLCS) is spiked at or near (1–2 times) the reporting limit and processed like a laboratory control sample. The concentration of the RLCS may be reported below the reporting limit, because the spike is at or near the reporting limit. The RLCS is to ensure if the analytes were present at the reporting limit that they would be identified. The recovery limits for the RLCS are 50 to 150%. Table II shows the initial reporting limit study data.
Laboratory Control Sample and Matrix Spike Sample Check
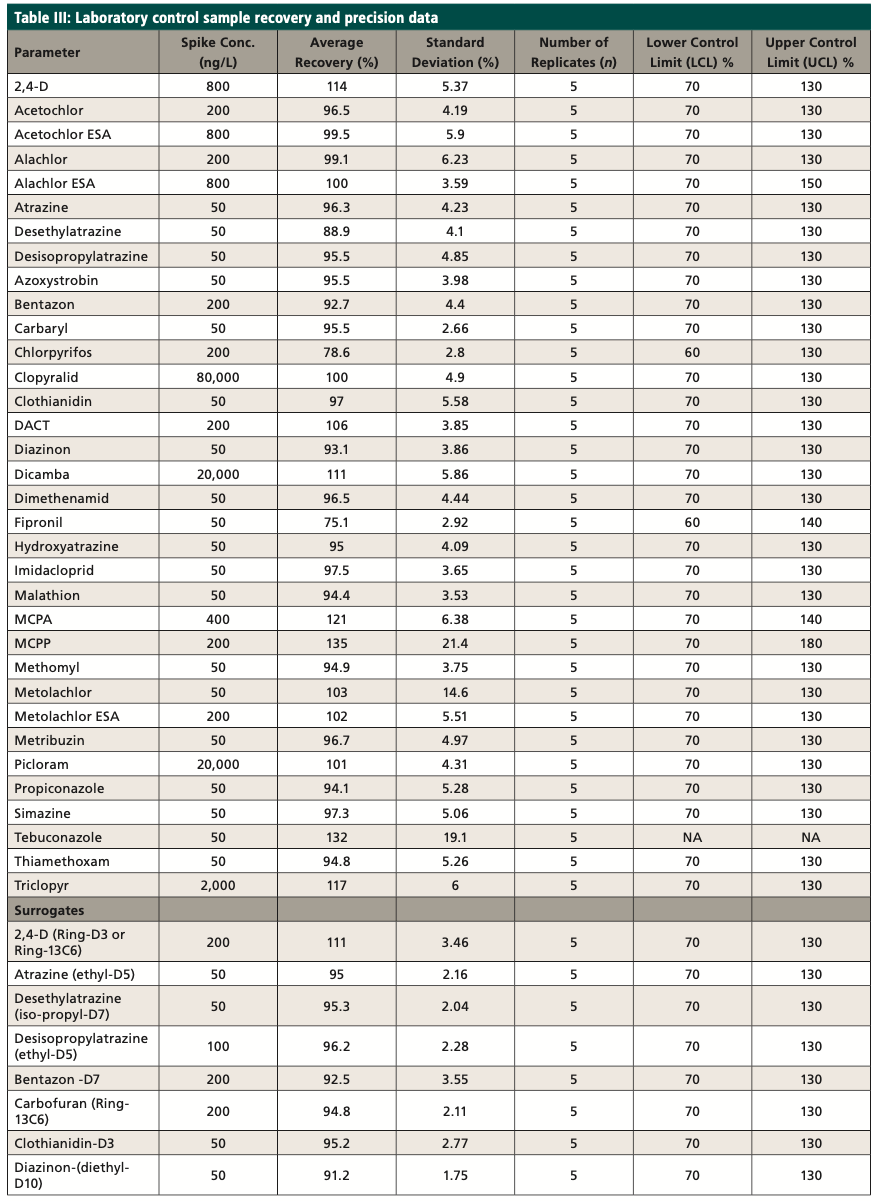
A laboratory control sample (LCS) study was conducted during the development of the method, and an LCS sample was analyzed from each batch within the 24-h analysis window to ensure the laboratory control sample percent recovery was achieved. The LCS was spiked at or near the midpoint of the method calibration. The recovery limits for the LCS were 70 to 130%. Table III shows the initial laboratory control sample study data, along with the isotopically labeled surrogates. The matrix spike sample (MS) was extracted like an LCS, with sample used instead of reagent water. Each batch must contain a MS sample.

Mass Spectrometer
Experiment Conditions
A Waters Xevo-TQXS mass spectrometer was used for the modified method, enabling us to meet the lower reporting limits required. With this instrument, the method accurately, qualitatively, and quantitatively detects pesticide concentrations at or below the chronic toxicity levels.
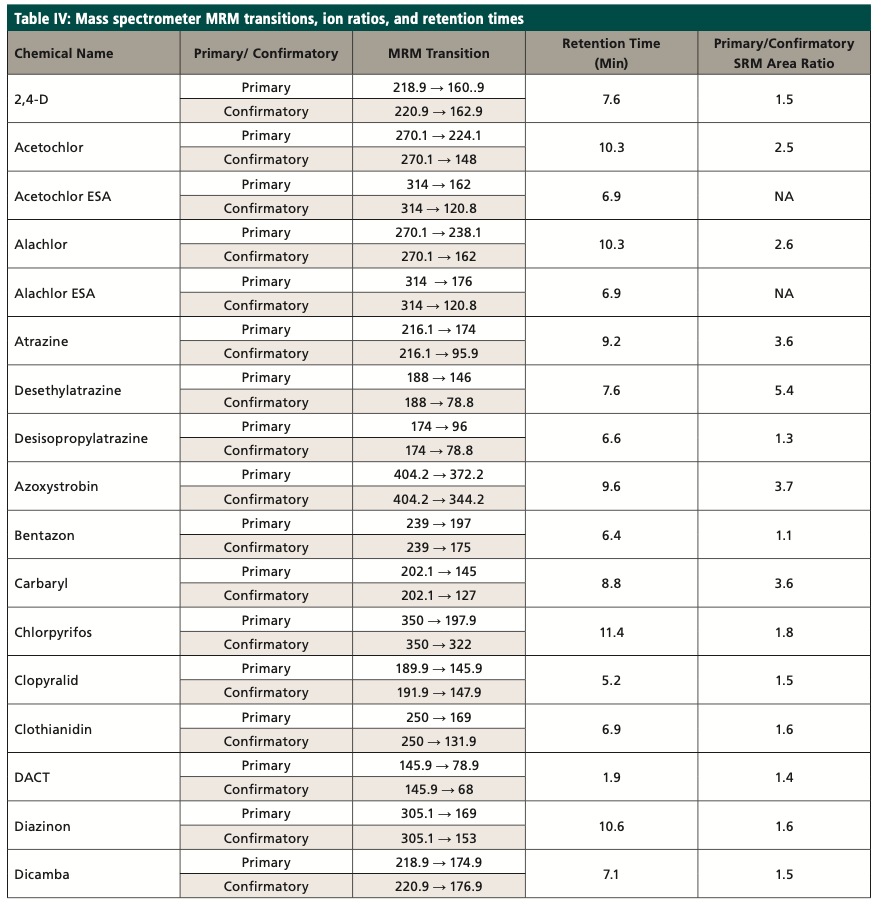
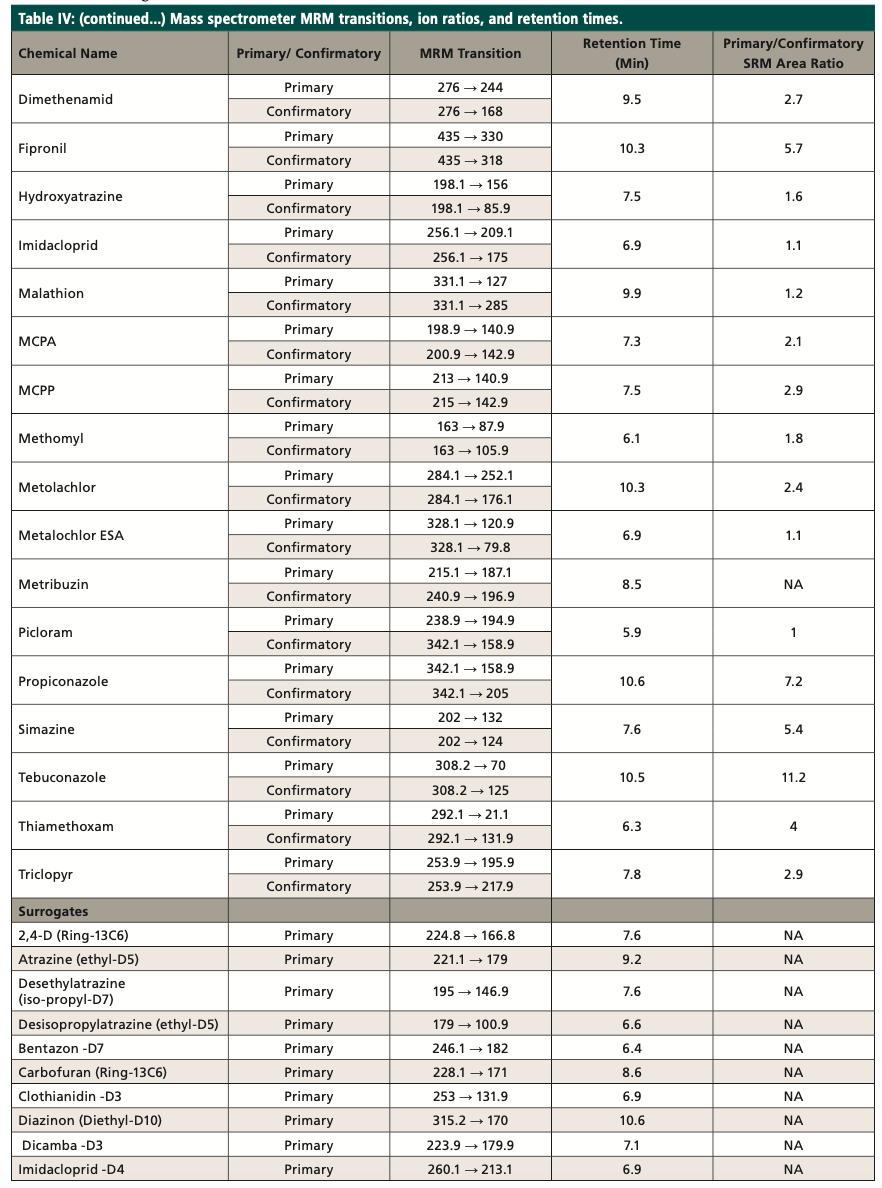
The target compounds are identified by comparing the MRM transitions in the sample to the MRM transitions in the standard. A confirmatory transition is available for most of the analytes (Table IV). The retention time (tR) for the analytes of interest must also agree with the tR of the mid-level standard by ±5%. The MRM analysis provides qualitative identification by isolating the precursor ion and fragmenting it into the product ions. The MRM transition area counts are then used to calculate ion ratios that can be compared between samples and standards to confirm the identification of the analyte. The target compounds are quantitated using the MRM transitions of the target compounds, utilizing an external standard calibration. As an additional quality control measure, recovery levels of isotopically labeled surrogates (Table III) are monitored; the percent recovery of each should fall within the control limits of the method. The primary and confirmatory MRM ion ratios shall meet the criteria set in the quantitation method by ±30% of the average of the primary and confirmatory MRM ion ratios calculated from the calibration levels on the day of analysis.

Results and Discussion
The aquatic life benchmarks for freshwater species and ambient water quality criteria for registered pesticides in the United States are provided on the EPA website (5). State, tribal, and local governments use these benchmarks in their interpretation of water monitoring data. Comparing a measured concentration of a pesticide in water to an aquatic life benchmark can be helpful in interpreting monitoring data and identifying and prioritizing sites and pesticides that may require further investigation. The benchmarks are based on toxicity values from scientific studies that the EPA has reviewed and used to estimate risk for pesticides and their degradates in their most recent publicly available ecological risk assessments and preliminary problem formulations written in support of pesticide registration. The toxicity studies are specified in U.S. Code of Federal Regulations (40 CFR 158) (6). The EPA uses “Harmonized Test Guidelines” and the “Evaluation Guidelines for Ecological Toxicity Data in the Open Literature” to evaluate the quality and utility of the studies.
The most recent pilot project for the Ohio Auglaize Basin was sampled by Ohio EPA between June and September 2019. The Auglaize River sampling locations and the National Land Cover Database (NLCD) Land Classification Cover Classification Legend is shown in Figure 1. The sampling locations chosen were overwhelmingly located near cultivated crops. One hundred and seventy water samples were taken between June and September 2019 in the Auglaize River basin. To illustrate the results of the methods used we provide examples (Figures 2 and 3) of the analysis of four pesticides from the Auglaize River basin, comparing them to the reporting limits and the Office of Pesticide Programs (OPP) benchmarks for aquatic life. A neo-nicotinoid, imidacloprid, was the most frequently detected insecticide in the study. Many detections were found above the chronic OPP Aquatic Life benchmark values, and some pesticides were detected above the acute benchmark value.
Figure 2: Imidacliprid and clothianidin results from Auglaize Watershed 2019 samples.
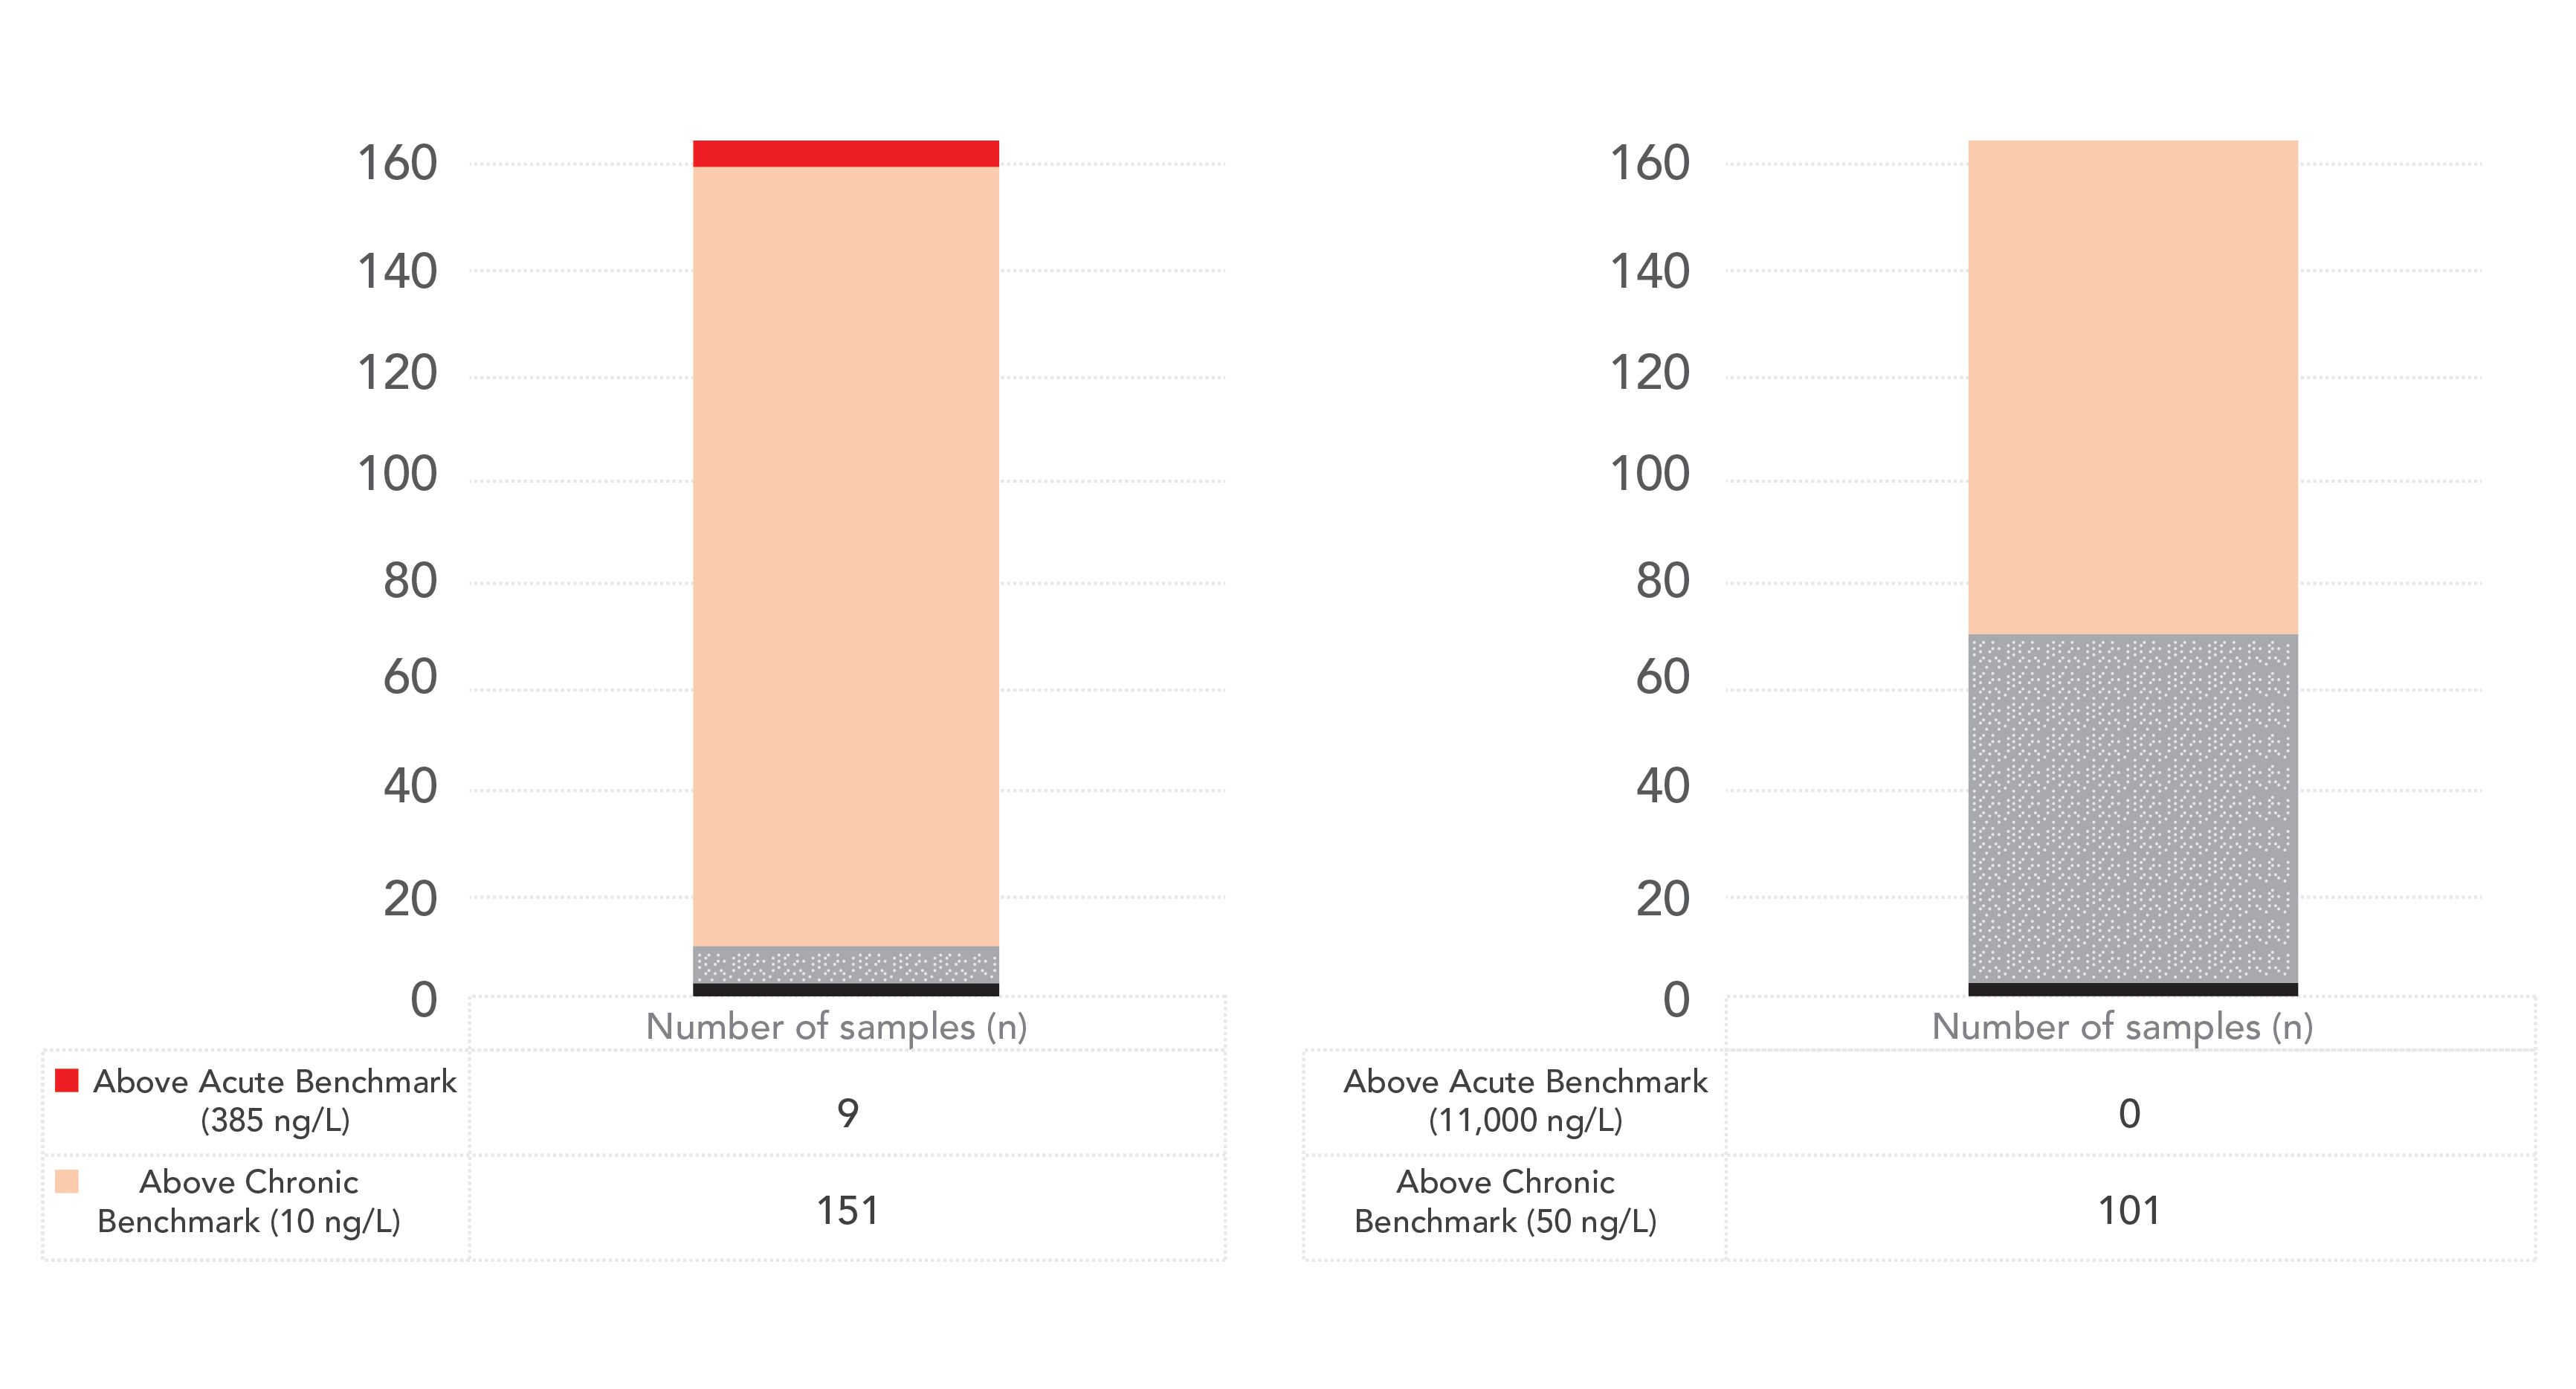
Figure 3: Fipronil and thiamethoxam results from Auglaize Watershed 2019 samples.
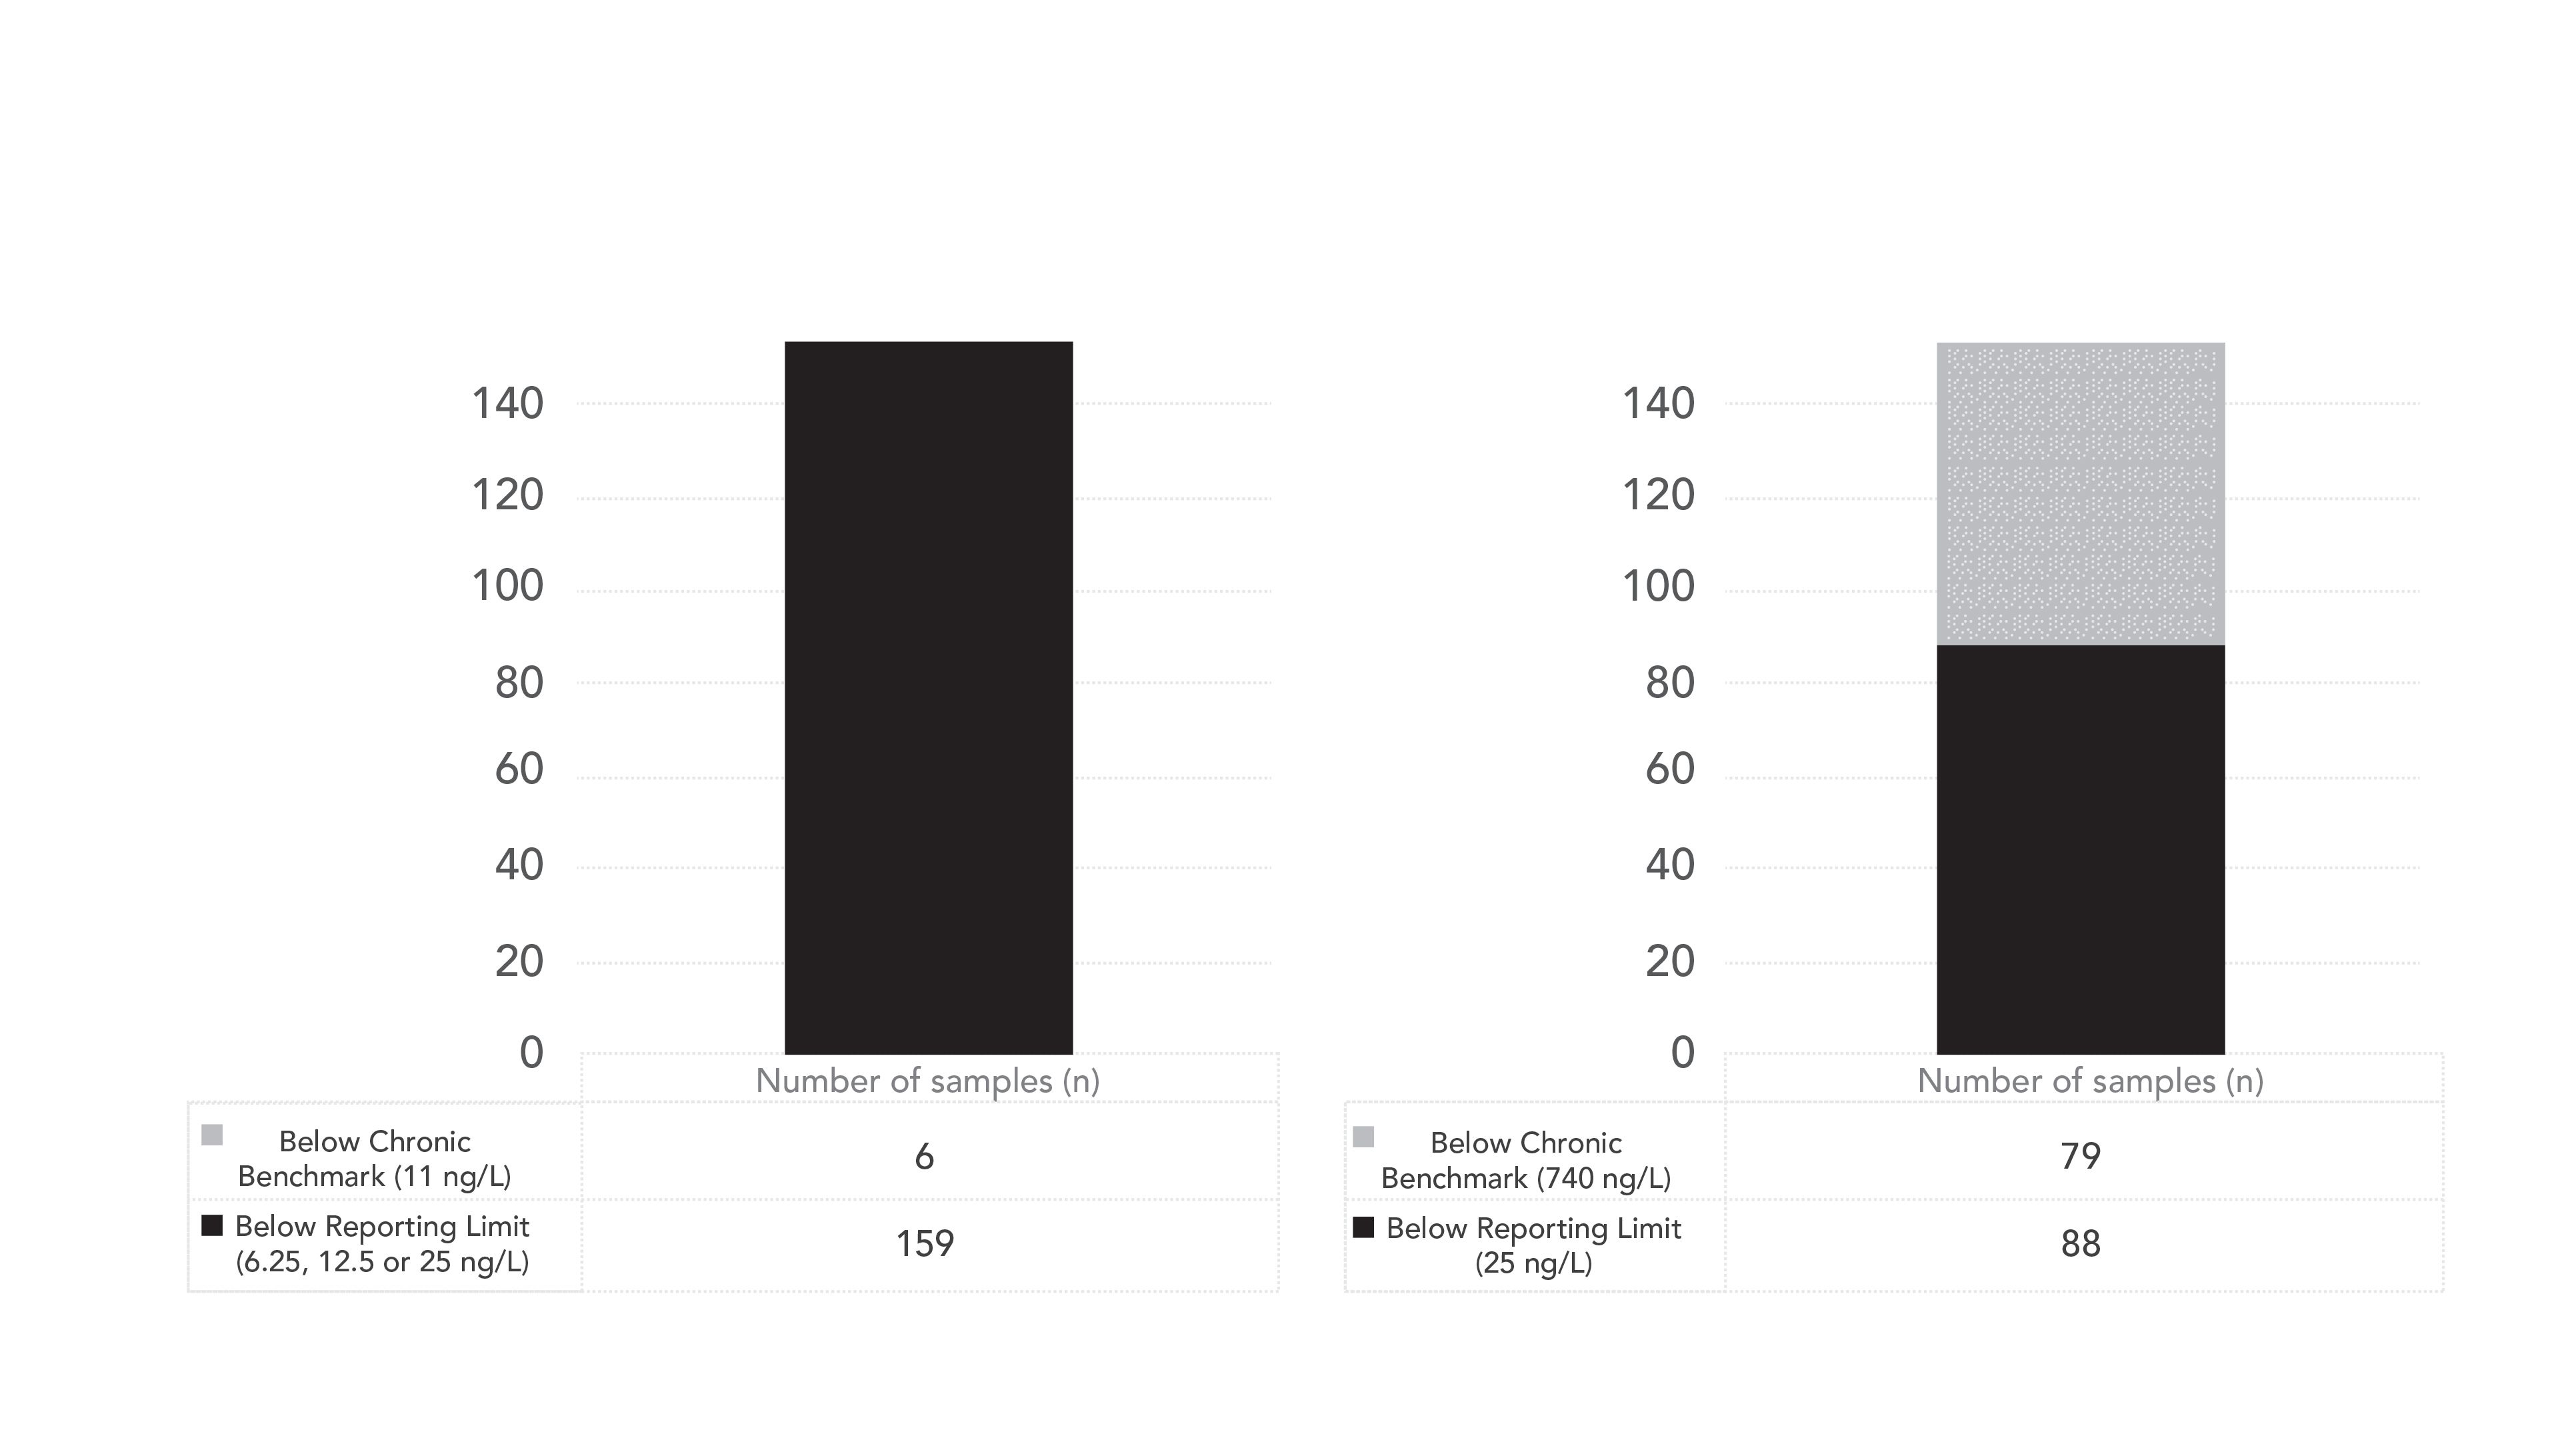
For the three neonicotinoids analyzed in this study (imidacloprid, clothianidin, and thiamethoxam), approximately 94, 2, and 52% of the samples were below the reporting limits, respectively, while 4, 39, and 47%, respectively, were above the reporting limit but below the chronic toxicity benchmark, and 94, 59 and 2%, respectively, were above one or more benchmarks. For fipronil, 94% of the samples were below the reporting limits, whereas 4% were above the reporting limit but below the chronic benchmark, and 3% were above the chronic benchmark.
Conclusion
The goal of this study was met by advancing data analytical techniques to further refine a comprehensive, streamlined analysis method (ASTM D8025) for analysis of pesticides in environmental matrices for a monitoring project to improve the data interpretation and monitoring program efficiency and effectiveness. The data generated from the pesticide analysis in select watersheds using a modified version of ASTM D8025 with an expanded pesticide list and lower reporting limits met the data quality objectives for our studies. The minimal modifications made fall within the performance-based criteria of the method. This ASTM method provides laboratories a rapid and reliable technique to determine trace pesticides in water samples.
References
(1) ASTM D8025-16, Standard Test Method for Determination of Select Pesticides in Water by Multiple Reaction Monitoring Liquid Chromatography Tandem Mass Spectrometry, ASTM International, West Conshohocken, Pennsylvania (2015), www.astm.org
(2) https://www.un.org/sustainabledevelopment/sustainable-consumption-production (2020)
(3) ASTM E1488-12(2018), Standard Guide for Statistical Procedures to Use in Developing and Applying Test Methods, ASTM International, West Conshohocken, Pennsylvania (2018), www.astm.org,
(4) ASTM E2857-11(2016), Standard Guide for Validating Analytical Methods, ASTM International, West Conshohocken, Pennsylvania (2016), www. astm.org
(5) https://www.epa.gov/pesticide-science- and-assessing-pesticide-risks/aquatic-life-benchmarks-and-ecological-risk#aquatic-benchmarks (2020)
(6) https://ecfr.io/Title-40/Part-158 (2020)
Larry Zintek, Larisa Leonova, Susan Rittenhouse, Jonathan Burian, Ed Hammer, and Danielle Kleinmaier are with the United States Environmental Protection Agency, Region 5, in Chicago, Illinois. William C. Lipps is with Shimadzu Scientific Instruments, Inc., in Columbia, Maryland. Direct correspondence to: zintek.lawrence@epa.gov

Common Challenges in Nitrosamine Analysis: An LCGC International Peer Exchange
April 15th 2025A recent roundtable discussion featuring Aloka Srinivasan of Raaha, Mayank Bhanti of the United States Pharmacopeia (USP), and Amber Burch of Purisys discussed the challenges surrounding nitrosamine analysis in pharmaceuticals.
Advances in Non-Targeted Analysis for PFAS in Environmental Matrices
March 27th 2025David Megson from Manchester Metropolitan University in Manchester, UK, spoke to LCGC International about the latest developments in non-targeted analysis (NTA) of per- and polyfluoroalkyl substances (PFAS) in environmental matrices based on a recent systematic review paper he has collaboratively published (1).


