Maximizing the Peak Production Rate in Off-line Comprehensive Two-Dimensional Liquid Chromatography with MS Detection
LCGC Europe
An optimization strategy to obtain the best possible performance in the shortest analysis time for comprehensive off-line 2D-LC.
In the past decade high performance liquid chromatography (HPLC) has emerged as a technique for the separation of complex proteomic samples because of its outstanding chromatographic resolving power,1–3 the possibilities to automate the analysis (ease-of-use and outstanding reproducibility)4 and its compatibility with mass-spectrometric (MS) detection using electrospray (ES) interfacing.5–6
A good performance criterion for the gradient separation of peptides is peak capacity, which is defined as the maximum number of peaks that can be separated with a resolution of 1 and elute in the applied gradient window.7 The maximum peak capacity obtained in one-dimensional (1D) LC is mainly determined by the column technology (column length and particle size) and the duration of the gradient. The maximum allowable column length is determined by the permeability of the chromatographic bed and the maximum pressure drop of the HPLC instrumentation.8–9 Whereas fast separations are typically obtained on short columns packed with small (<2 μm) silica particles, high-efficiency 1D-LC separations are obtained on long columns packed with a slightly larger particle size applying long gradients.10–11
Whereas 1D-LC allows the separation of hundreds of analytes, multidimensional separation approaches have the potential to separate thousands of components.12–13 Of all the 2D-LC techniques, off-line 2D-LC (or LC×LC) offers the most flexibility in terms of separation modes and LC conditions, because matching eluents, flow-rates and transfer volumes are less critical than in on-line 2D-LC.14 Moreover, off-line 2D-LC allows re-analysis of samples when partial injection of the fractions is applied. Because peptides can be pre-concentrated and desalted between the two dimensions, external band-broadening due to the second-dimension injection volume must be minimized.15 Consequently, for proteomics separations a large (1 mm) i.d. first-dimension column is typically applied, providing high sample capacity, and a small (75 μm) i.d. column is applied as second-dimension column, providing high mass sensitivity and easy coupling with MS.
To use the full peak capacity offered by comprehensive LC×LC the separation mechanism used in the first dimension should be independent of the retention mechanism in the second-dimension separation and none of the separation achieved should be lost due to undersampling (i.e., transferring too few fractions to the second-dimension column). In this case, the maximum 2D-LC peak capacity (2Dnc) that can be obtained is:

where 1nc is the peak capacity obtained in the first dimension and 2nc the peak capacity obtained in the second dimension.
This article describes an optimization strategy to obtain the best possible performance in the shortest analysis time — called the peak production rate — for comprehensive off-line two-dimensional LC.
Experimental
Chemicals and materials: Acetonitrile (ACN, HPLC supra-gradient quality) and trifluoroacetic acid (TFA, ULC–MS quality) were purchased from Biosolve (Valkenswaard, The Netherlands). Sodium dihydrogenphosphate (·2 H2O) and sodium chloride (analytical reagent grade) were purchased from Sigma-Aldrich (Steinheim, Germany). Ortho-phosphoric acid (85%) was obtained from Bio Lab (Jerusalem, Israel).
For column testing (determination of peak capacity) a digest of cytochrome c and a six-protein-mixture digest containing tryptic peptides of transferrin, bovine serum albumin, β-galactosidase, alcohol dehydrogenase, lysozyme and cytochrome c (Dionex) were used as test samples. For 2D-LC experiments a nine-protein tryptic digest of the six proteins listed above plus β-casein, myoglobin and a monoclonal antibody (MAb) was used, as well as an Escherichia coli (E. coli) digest (BioRad, Paisley, UK).
Key Points
Acclaim PepMap nanoLC columns (150 and 500 mm length; 75 μm i.d.) packed with 3 μm, 100 Å C18 particles (Dionex) were used for reversed-phase peptide separations. Peptide pre-concentration and desalting were performed prior to a second-dimension separation on a 5 × 300 μm i.d. mm trap column packed with Acclaim PepMap 5 μm, 100 Å C18 particles. A 1 × 150 mm i.d. column packed with polypeptide-coated strong-cation-exchange silica particles packed of either 3 or 5 μm average diameter with 300 Å pores was used for the IEX experiments.
Instrumentation, configuration and LC conditions: All HPLC experiments were performed using an UltiMate 3000 Proteomics MDLC system (Dionex)) equipped with a membrane degasser, ×2 dual-gradient pump, a thermostatted flow manager, a well-plate sampler and two UV detectors. MS–MS data were generated with an ion-trap mass spectrometer (HCTultra, Bruker, Bremen, Germany) coupled on-line to the LC system via an ESI source. The mass spectrometer was operated in the positive ionization (PI) mode in the scan range from m/z = 300–1600, using a dry-gas stream of 4 L/min, nebulizer gas at 138 kPa, drying temperature of 300 °C and a target mass set to m/z = 800. Proteins were identified through a peptide search using the MASCOT software package (Matrix Science, London, UK).
In the 1D-LC set-up, the nanoLC column was placed in the column compartment and connected with 20 μm i.d. tubing between the injector and the UV detector (containing a 3 nL Z-shaped detector flow cell). Injection volume = 1 μL, flow-rate = 300–1000 nL/min, mobile phase A = 0.05% aqueous TFA, mobile phase B = 80:20 ACN:H2O containing 0.04% TFA; gradient = 4–55% B, UV detection at 214 nm.
Figure 1 represents the schematic diagram of the 2D-LC system. The workflow for automated off-line 2D-LC includes:
- A first-dimension ion-exchange separation using the well-plate sampler for both injection and automated fraction collection.
- Repeated cycles of injection, preconcentration and desalting of the peptide on a trap column, and second-dimension reversed-phase separations of all the fractions. Tandem mass-spectrometric detection was performed to identify the peptides.
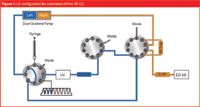
Figure 1: LC configuration for automated off-line 2D LC.
Detailed 2D-LC conditions: After injection of 2–10 μL (10 pmol) of a complex mixture of tryptic peptides, a linear salt gradient 0–600 mM NaCl in 5 mM phosphate buffer was applied at a flow-rate of 50 μL/min. Mobile phase A = 95:5 H2O:ACN, 5 mM NaH2PO4 buffer pH = 3, mobile phase B = mobile phase A + 1 M NaCl, gradient = 0–60% B, column temperature = 25 °C, UV detection with 45 nL flow cell at 214 nm. In three different series of experiments 50 μL fractions were collected every 1, 2 and 5 min.
The second-dimension separation included 5 min on-line sample pre-concentration and desalting of the peptides using a trap column at a flow of 40 μL/min, followed by the reversed-phase separation of the peptides on a 15 cm long nanoLC column. Injection volume = 20 μL, flow-rate = 750 nL/min, mobile phase A = 0.05% aqueous TFA, mobile phase B = 80:20 ACN:H2O containing 0.04% TFA; gradient = 2–55% B, gradient time = 20 min, wash step at 90% B for 2.5 min; equilibration time = 12.5 min, column temperature = 60 °C.
Results and discussion
Optimization of the 1D SCX separation: Peak capacity in ion-exchange (IEX) chromatography is mainly determined by the IEX conditions, such as gradient slope and time and the column technology applied. The strong-cation-exchange (SCX) separation of a six protein mix digest was performed on a 150 mm column packed with 5 μm peptide-coated SCX particles applying a gradient time of 20 min [Figure 2(a)]. Most of the tryptic peptides were doubly and triply and positively charged. Figure 2(b) and (c) show the SCX separation executed on a 250 mm long column packed with 3 μm particles and applying gradient times of 20 and 33 min, respectively. When applying the same gradient time, while increasing the column length and decreasing the particle size, a significant increase in peak capacity was obtained. When scaling the gradient time in proportion to t0 to 33 min the peak capacity was further increased.

Figure 2: Strong cation-exchange separation of a six protein mix digest on a 15 cm column packed with 5 μm particles applying a gradient of 20 min (a) and a separations on a 25 cm column packed with 3 μm particles applying a gradient time of 20 (b) and 33 min (c), respectively.
Tanaka et al.16 showed that the sampling time applied for the second dimension (2D separation) should be adjusted to 2–4 times the standard deviation of a first-dimension (1D) peak (i.e., one or two 'cuts' per 1D peak). This yields the best compromise between the time available for the 2D separations and maintaining separation obtained in the first dimension. Table 1 gives an overview of the effects of column length, particle size and gradient times on the optimal sampling time. The application of a 20 min gradient using a 150 mm column packed with 5 μm particles results already in a very high number of fractions (60) that need to be analysed in the second dimension. Even when applying short 10 min 2D gradients this results in a total analysis time of more than 10 h, not taking into account the gradient delay volume, column equilibration time, desalting time, etc.

Table 1: Effect of column properties and gradient time on sampling time (2 cuts per peak) and the number of 1D fractions collected.
When the first-dimension separation is 'undersampled', for example when the resolution obtained in the first-dimension is partially lost by the fraction collecting rate, the first-dimension peak capacity (1nc) cannot be higher than the number of fractions taken and is defined as:17

where 1tG is the gradient duration in the first-dimension and st the sampling time. In case of undersampling, the easiest way to achieve a higher effective 1D peak capacity is by reducing the sampling time. Improving gradient time/slope or column technology is less effective than increasing the sampling time.
Optimization of the 2D RP separation: A reversed-phase (RP) separation in the second-dimension ensures excellent solvent compatibility for interfacing to a mass spectrometer using electrospray ionization (ESI). To maximize the orthogonality between the two dimensions, 5% acetonitrile was added in the mobile phase of the 1D SCX separation. In this way hydrophobic interactions were suppressed.
The (second-dimension) peak capacity (2nc) in gradient-elution chromatography can be approximately defined as:7

where 2tG is the duration of the second-dimension reversed-phase gradient, W the average peak width (which is approximately equal to four times the standard deviation, at σ), L the column length, tr the retention time and H the plate height. Equation 3 shows that peak capacity in gradient-elution chromatography depends on column technology (column length and plate-height value, H. The latter parameter mainly reflects the particle size and the quality of the column) and LC conditions such as gradient time, and parameters that affect H, such as flow-rate and column temperature.
The effects of the column temperature, gradient time and flow-rate on the 2D peak capacity were systematically investigated using 150 and 500 mm long nanoLC columns packed with 3 μm silica C18 particles. When increasing the column temperature the mass-transfer in the mobile and stationary phases was enhanced, leading to narrower peaks and consequently higher peak capacities. The maximum peak capacity was obtained at a column temperature of 80 °C. With increasing column temperature a decrease in retention was observed, which can easily be counteracted by adjusting the initial and final compositions of the gradient. However, the trapping efficiency during desalting on a trap column was also decreased. This could potentially lead to break through of hydrophilic peptides. In addition, the column (chemically bonded phase and silica particles) may degrade more rapidly at high column temperature. Therefore, a column temperature of 60 °C was selected for further experiments — see Figure 3 for a typical separation example of a six protein mix digest.
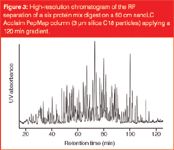
Figure 3: High-resolution chromatogram of the RP separation of a six protein mix digest on a 50 cm nanoLC Acclaim PepMap column (3 μm silica C18 particles) applying a 120 min gradient.
In general, longer gradient times yielded higher peak capacities. A strong increase in peak capacity was obtained when using relatively short gradients and operating the column at high flow-rates. The peak capacity was higher than that obtained when the column was operated at a flow-rate close to the optimum of the van Deemter curve, which may possibly be attributed to peak-compression effects. At longer gradient times the rate of increase in peak capacity was less steep. The maximum peak capacity of 390 on 15 cm columns was obtained at a flow-rate around the optimum of the van Deemter curve when applying a 120 min gradient. The peak production rate on a 50 cm column was significantly higher at all gradient times than that obtained on a 15 cm column. However, it should be noted that the required column-equilibration time also increases with column length.
Figure 4 shows the effect of the 2D gradient time on the 2D-LC peak production rate using 150 and 500 mm 2D columns. The peak capacity was estimated from experimental data by averaging the peak width at 4σ for at least five peptides and applying Equation 3. The total analysis time was calculated by summation of the 1D (ion-exchange) gradient time (10 min) and the product of number of fractions multiplied with the 2D time, taking into account the different pre-concentration/desalting times of 2 and 5 min, respectively, the gradient time, a wash step at high acetonitrile concentration for 2.5 min and the column equilibration times for the 150 mm (12.5 min) and 500 mm column (41.7 min), respectively.
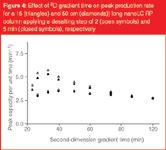
Figure 4: Effect of 2D gradient time on peak production rate for a 15 (triangles) and 50 cm (diamonds)) long nanoLC RP column applying a desalting step of 2 (open symbols) and 5 min (closed symbols), respectively
The highest peak production rate is obtained for the 150 mm column when applying a 20 min 2D gradient (Figure 4). For shorter 2D gradients the peak production rate is dominated by the time needed to desalt the peptide fractions. For longer 2D gradients the peak production rate decreases. The peak capacity increases slowly in this range, because of an increase in the average peak width of peptides at longer gradient times. The optimum peak production rate for the 500 mm column is significantly lower than that obtained with the 150 mm column and the optimum is observed at a longer gradient time. The desalting time is less important because both the gradient duration and the equilibration time are longer for the 500 mm columns.
Figure 5 shows the effect of sampling time on the 2D-LC performance for the SCX/×/RP separation (where the / indicates that this is an off-line approach) of a digest of a mixture of nine proteins, containing approximately 1000 peptides. A first-dimension gradient of 10 min was applied and fractions were collected applying sampling times of 5, 2 and 1 min, respectively. The fractions were pre-concentrated and desalted on a trap column and analysed on a 150 mm RP nanoLC column applying 20 min 2D gradients with UV and MS–MS detection. Figure 5 clearly shows the improved chromatographic performance (peak capacities around 400, 1000 and 2000) with decreasing sampling time, though obtained at the expense of analysis time.

Figure 5: Effect of sampling time on the 2D-LC separation of a tryptic digest of a nine-protein mixture. Sampling times are (a), 5 min (b) 2 min and (c) 1 min respectively.
Although a 25% decrease in total ion score was observed when decreasing the fraction collection time from 5 minutes to 1 minute, all proteins could positively be identified with a sequence coverage >29%. This is explained by the fast cycle time of the mass spectrometer; the cycle time is the time needed to isolate a precursor ion (MS) and measure the fragments after collision induced dissociation (MS–MS). When applying a cycle time of 2 s and analysing two precursor ions in MS–MS mode, the mass spectrometer can identify co-eluting peptides enhancing protein identification.
Trade-off between 1D- and 2D-LC: Figure 6 illustrates the trade-off between the 1D-LC performance of proteomics separation on 150 and 500 mm long columns packed with 3 μm particles and the off-line 2D-LC performance under 'undersampling' conditions, applying optimized 2D gradients. It is evident that the use of longer columns in 1D-LC always yield higher peak capacity separations. However, it should be noted that in practice the column equilibration time also increases with column length. Under the applied conditions, 1D-LC is superior to 2D-LC for separations requiring a peak capacity of 400 (tG = 80 min) or less. Higher peak capacities can be generated in 1D-LC using longer gradients. However, the gain in peak capacity per time unit is less than what can be obtained using 2D-LC.
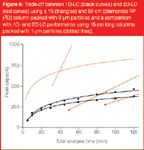
Figure 6: Trade-off between 1D-LC (black curves) and 2D-LC (red curves) using a 15 (triangles) and 50 cm (diamonds) RP (2D) column packed with 3 μm particles and a comparison with 1D- and 2D-LC performance using 15 cm long columns packed with 1 μm particles (dotted lines).
Figure 6 also illustrates how the trade-off between the 1D-LC and 2D-LC performance may possibly be affected by future UHPLC column technology (assuming the use of 150 mm long columns packed with 1 μm particles). Theoretical peak capacities were calculated following an approach described by Neue et al.18 The effect of solvent composition on the retention factor was determined for 3 μm packed columns and its value was used to calculate the 1D-LC performance with 1 μm packed columns. The 1D-LC performance that theoretically can be obtained better than that currently offered by a factor of 2–3. In addition, the point where 1D-LC and 2D-LC show similar performance is shifted to shorter analysis times (40 min). When using shorter 2D columns this effect is further enhanced.
Conclusions
An SCX/×/RP separation approach was developed using the micro-fractionation option of the autosampler, which allowed automatic fractionation of peptides after a first-dimension separation and re-injection, pre-concentration/desalting and separation of the fractions in the second-dimension. The LC conditions and column technology were optimized to maximize the peak production rate. When 'undersampling', changing 1D column technology (particle size and or column length) or LC conditions (gradient time/slope) have smaller effects than increasing the sampling time. The highest peak production rate in the 2D-LC mode was obtained when applying second-dimension RP gradients of 20 min duration on a 150 mm long column packed with 3 μm particles. The optimal 2D gradient time is strongly influenced by the column equilibration time; when increasing column length, the equilibration time also increases, decreasing the peak production rate in 2D-LC.
For separations requiring a peak capacity higher than 400, off-line SCX/×/RPLC was found to be superior to 1D-LC in terms of analysis time. For less-demanding samples it is more profitable to use 1D-LC with long columns.
Sebastiaan Eeltink obtained his PhD from the University of Amsterdam. After a post-doctoral research project on column and chip technology at UC Berkeley (California, USA) he joined Dionex, where he is now a chromatography scientist focusing on the development of novel stationary phases and separation techniques.
Bas Dolman is application specialist nanoLC and two-dimensional chromatography within Dionex.
Mario Ursem is managing director of Dionex Corporation Amsterdam. His interests include column technology and application development.
Remco Swart heads the R&D and product management department at Dionex Benelux and is responsible for application development in the field of proteomics and protein analysis.
Fraser McLeod heads the product marketing department of the life science business group within Dionex. He joined Dionex after working in various roles in the pharmaceutical industry. After leading the software marketing group within Dionex he is now in charge of LC hardware, software and application marketing. His interests include rapid separation LC and chromatography information technology.
Peter Schoenmakers is professor and at the University of Amsterdam heading the Polymer-Analysis Group. The group develops methods and techniques for the separation and characterization of natural and synthetic macromolecules, exploring LC, SEC, CE, HDC and FFF. The research is focused on two-dimensional separations and nanoscale separations.
References
1. Y. Shi et al., J. Chromatogr. A, 1053, 27–36 (2004).
2. H. Chen et al., Anal. Chem., 77, 2323–2331 (2005).
3. H. Liu et al., J. Chromatogr. A, 1147, 30–36 (2007).
4. Y. Ishihama, J. Chromatogr. A, 1067, 73–84 (2005).
5. M. Wilm, G. Neubauer and M. Mann, Anal. Chem., 68, 527–533 (1996).
6. W.M.A. Niessen, U.R. Tjaden and J. van der Greef, J. Chromatogr., 554, 3–26 (1991).
7. J.W. Dolan et al., J. Chromatogr. A, 857, 1–20 (1999).
8. H. Poppe, J. Chromatogr. A, 778, 3–21 (1997).
9. G. Desmet, D. Clicq and P. Gzil, Anal. Chem., 77, 4058–4070 (2005).
10. S. Eeltink et al., J. Chromatogr. A, 1104, 256–262 (2005).
11. G. Desmet and D. Cabooter, LCGC Europe, 22(2), 70–77 (2009).
12. D.R. Stoll et al., J. Chromatogr. A, 1168, 3–43 (2007).
13. C. Delahunty and J.R. Yates III, Methods, 35, 248–255 (2005).
14. A.P. Kohne and T. Welsch, J. Chromatogr A, 845, 463–469 (1999).
15. P.J. Schoenmakers, G. Vivo-Truyols and W.M.C. Decrop, J. Chromatogr. A, 1120, 282–290 (2006).
16. K. Horie et al., Anal. Chem. 79, 3764–3770 (2007).
17. X. Wang et al., J. Chromatogr. A, 1125, 177–181 (2006).
18. U.D. Neue, J. Chromatogr. A, 1184, 107–130 (2008).

Common Challenges in Nitrosamine Analysis: An LCGC International Peer Exchange
April 15th 2025A recent roundtable discussion featuring Aloka Srinivasan of Raaha, Mayank Bhanti of the United States Pharmacopeia (USP), and Amber Burch of Purisys discussed the challenges surrounding nitrosamine analysis in pharmaceuticals.


