Liquid Chromatography’s Complementary Role to Gas Chromatography in Cannabis Testing
Special Issues
Liquid chromatography (LC) is proving to be a valuable complementary technique to gas chromatography (GC) in cannabis testing for the analysis of cannabinoids, mycotoxins, and pesticides.
The absence of consensus methods for cannabis testing is a challenging, but refreshing opportunity for analytical chemists in the field because it enables the incorporation of the newest technologies and best practices without the restrictions imposed by legacy approaches that often impede method development in other industries. Liquid chromatography (LC) is proving to be a valuable complementary technique to gas chromatography (GC) in cannabis testing for the analysis of cannabinoids, mycotoxins, and pesticides. The industry is emerging during a time when superficially porous particles (SPPs) and ultrahigh-pressure liquid chromatography (UHPLC) have become market standards. This article discusses the adoption of LC technology and its role in cannabis testing.
With the legalization of recreational marijuana in the state of California, cannabis and cannabis-infused products are facing a new level of scrutiny. California regulations require that cannabis and cannabis-infused products are tested for cannabinoids, pesticides, mycotoxins, residual solvents, terpenes (verification of label claims), heavy metals, microbiological contaminants, filth and foreign material, moisture content, and water activity (1). All of these requirements have created a new level of demand for analytical techniques that are capable of meeting regulatory requirements. Gas chromatography (GC) and liquid chromatography (LC) have largely filled the needs of analytical chemists in what has become almost equal utilization of both techniques. LC has taken a predominant role in the analysis of cannabinoids, mycotoxins, and pesticides, and GC has set industry standards for the analysis of residual solvents, terpenes, and the remaining pesticides that are not amenable to LC–tandem mass spectrometry (MS/MS).

(IMAGE CREDIT: FABRIKASIMF / SHUTTERSTOCK.COM)
Due in large part to the federal illegality of cannabis in the United States, strict method requirements imposed in other industries have not been applied to cannabis testing. Instead, the results provided by each laboratory rely on methods developed in-house, typically following acceptance criteria used by the food industry when state requirements are unavailable. The absence of consensus methods and strict method requirements has allowed analytical chemists to explore the more recent technological advances in liquid chromatography that improve the speed, sensitivity, and cost of existing analytical methods. Herein, the use of recent advances in LC technology for the analysis of cannabinoids, mycotoxins, and pesticides as they pertain to the cannabis industry is presented.
Cannabinoids
The term cannabinoids refers to a class of compounds that have the capability to act on cannabinoid receptors in the brain. The term phytocannabinoid is specific to those compounds found in cannabis and other plants. Within the cannabis industry, these two terms are used interchangeably. Cannabinoids are of great interest for their therapeutic value because cannabis has been indicated for the treatment of pain, glaucoma, nausea, depression, and neuralgia. Cannabinoids have been classified into the following 11 main types: (–)-delta-9-trans-tetrahydrocannabinbol (Δ9-THC), (–)-delta-8-trans-tetrahydrocannabinbol (Δ8-THC), cannabigerol (CBG), cannabichromene (CBC), cannabidiol (CBD), cannabinodiol (CBND), cannabielsoin (CBE), cannabicyclol (CBL), cannabinol (CBN), cannabitriol (CBT), and miscellaneous-type cannabinoids. The cannabinoid profile of a cannabis strain is of great interest because the medicinal and psychotropic value can vary significantly between cultivars (2).
The analysis of cannabinoids was initially dominated by GC-based techniques until it was discovered that the hot injection port of a GC results in the incomplete decarboxylation of acidic cannabinoids. Although GC-based techniques are still used for the analysis of cannabinoids, derivatization before injection must be performed to protect the carboxylic acid functional groups (3,4). Because of the additional sample preparation steps required for GC analysis, LC-based techniques are preferred for the determination of cannabinoids in testing laboratories. Ultraviolet (UV) detection is most frequently paired with LC analysis based on low initial cost, ease of use, and robustness.
As states began to legalize medical and recreational marijuana, analytical laboratories turned to existing publications for guidance on method development. C18-based stationary phases quickly found traction in potency testing because their associated hydrophobic interactions and shape-selective characteristics enabled the separation of cannabinoids. Coincidentally, as the demand for testing increased, column manufacturers began releasing applications on superficially porous particles (SPPs). The increased speed and improved resolution with the use of SPPs compared to traditional fully porous particles (FPPs) of the same particle size met the needs of the cannabis testing industry. By pairing C18-based stationary phases with SPPs, the speed and resolution capabilities of cannabinoid separations have been significantly improved. The baseline separation of 16 cannabinoids by LC–UV with a 9-min cycle time has been reported (Figure 1) (5).
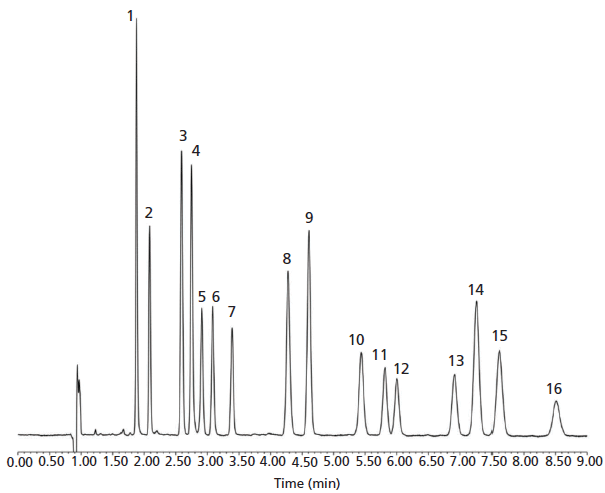
Figure 1: The separation of 16 cannabinoids by HPLC–UV. Column: 150 mm × 4.6 mm, 2.7-µm Raptor ARC-18; mobile-phase A: water, 0.1% formic acid (v/v), 5 mM ammonium formate; mobile-phase B: acetonitrile, 0.1% formic acid (v/v); elution: isocratic at 75% B over 9 min; flow rate: 1.5 mL/min; injection volume: 5 µL; oven temperature: 30 °C; detection: UV absorbance at 228 nm. Peaks: 1 = cannabidivarinic acid (CBDVA), 2 = cannabidivarin (CBDV), 3 = cannabidiolic acid (CBDA), 4 = cannabigerolic acid (CBGA), 5 = cannabigerol (CBG), 6 = cannabidiol (CBD), 7 = tetrahydrocannabivarin (THCV), 8 = tetrahydrocannabivarinic acid (THCVA), 9 = cannabinol (CBN), 10 = cannabinolic acid (CBNA), 11 = Δ9-tetrahydrocannabinol (Δ9-THC), 12 = Δ8-tetrahydrocannabinol (Δ8-THC), 13 = cannabicyclol (CBL), 14 = cannabichromene (CBC), 15 = Δ9-tetrahydrocannabinolic acid (THCA), 16 = cannabichromenic acid (CBCA).
Beyond SPPs compatible with 400-bar instrumentation, sub-2-µm SPPs have been introduced by a number of LC column manufacturers. The decreased particle size requires instrumentation to be capable of handling system pressures of 1000 bar or more. Additionally, minimal extracolumn volumes in the valves, connecting tubing, and flow cell are required for acceptable separation performance because of their contributions to dispersion. Low-volume flow cells (approximately 1 µL) are of particular importance because of the large contribution to band broadening that occurs in standard flow cells (6). Effective pairing of sub-2-µm SPPs with appropriate ultrahigh-pressure liquid chromatography (UHPLC) instrumentation enables faster separations with sharper peaks compared to the use of larger particles with traditional systems (Figure 2) (7). These characteristics decrease the amount of mobile phase solvent required per analysis, facilitate higher detection sensitivity, and improve productivity.
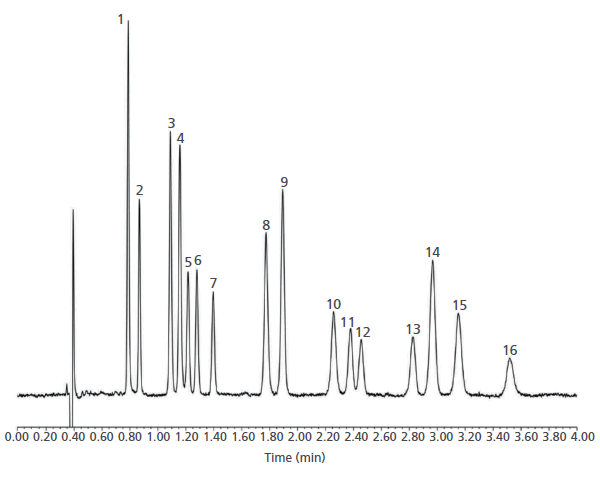
Figure 2: The separation of 16 cannabinoids by UHPLC–UV. Column: 100 mm × 3.0 mm, 1.8-µm Raptor ARC-18; mobile-phase A: water, 0.1% formic acid (v/v), 5 mM ammonium formate; mobile-phase B: acetonitrile, 0.1% formic acid (v/v); elution: isocratic at 75% B over 4 min; flow rate = 1.0 mL/min; injection volume: 1 µL; oven temperature: 30 °C; detection: UV absorbance at 228 nm. Peaks: 1 = CBDVA, 2 = CBDV, 3 = CBDA, 4 = CBGA, 5 = CBG, 6 = CBD, 7 = THCV, 8 = THCVA, 9 = CBN, 10 = CBNA, 11 = 9-THC, 12 = Δ8-THC, 13 = CBL, 14 = CBC, 15 = THCA, 16 = CBCA.
Although LC–UV has found its place in routine cannabis testing, the complexity of the matrix can complicate analysis. Namely, more than 100 cannabinoids have been isolated from C. sativa (2), which makes UV detection impractical because of the limited spectral deconvolution abilities and LC column resolving capabilities. For these reasons, the use of tandem mass spectrometric techniques have been proposed to overcome peak capacity limits. The use of a triple-quadrupole MS/MS system in multiple reaction monitoring (MRM) mode makes baseline resolution unnecessary, provided that the compounds or matrix interferences are not isobaric with the cannabinoids of interest. Unfortunately, the high cost of instrumentation and maintenance coupled with the need for more advanced personnel training generally prohibits the adoption of LC–MS/MS for routine analysis. If these barriers to entry were overcome, MS techniques could be used for the analysis of new cultivars to identify potential sources of UV interference that may impact routine testing.
Beyond high performance liquid chromatography (HPLC) and UHPLC, ultrahigh-performance supercritical fluid chromatography (UHPSFC) has found utility in cannabinoid analysis because of advances in instrumentation. As with UHPLC, the combination of sub-2-µm particle columns and photodiode array–mass spectrometry (PDA-MS) detection enables efficient and rapid separations. UHPSFC uses compressed carbon dioxide in combination with both polar and nonpolar cosolvents to separate a wide array of compounds. Classic polar phases such as bare silica, cyano, and amino are typically used for polar solutes. For low polarity solutes, reversed-phase columns such as C18, C8, C4, and biphenyl are sometimes used. In the past few years, a number of stationary phases have been developed specifically for SFC and include ethylpyridines as well as several proprietary phases. The retention order in SFC is roughly the opposite of that in reversed-phase LC, which makes the techniques highly orthogonal. The complementary nature of SFC and LC make them powerful techniques when combined, allowing a full characterization capable of identifying coelutions. Using UHPSFC–PDA, the baseline separation of 11 cannabinoids in less than 10 min can be achieved, making SFC another powerful analytical tool compatible with routine testing laboratories (8).
Additionally, enantioselective UHPSFC (eUHPSFC) methods have been developed using an inverted chirality columns approach to determine the enantiomeric excess of (–)-Δ9-THC (9). Most endogenous cannabinoids in the plant are chiral and predominantly occur as a single-enantiomer (10). The compatibility of enantiomers with cannabinoid receptors can lead to interesting effects, where one isomer is psychotropically active and the other devoid of any psychotropic effects. The characterization of the enantiomers of the cannabinoids could have profound effects in medical research where a positive patient outcome is desired without undesirable psychotropic effects. Although eUHPSFC is not applicable to routine testing laboratories, the technique would be critical to the pharmaceutical industry where the efficacy of single-molecule cannabinoid formulations could be highly dependent on stereochemistry.
To screen for the more than 500 components in cannabis (2), two-dimensional (2D)-LC has also been shown to have utility. In comparison to one-dimensional (1D)-LC or LCxLC (heart-cutting), comprehensive 2D-LC is capable of providing much more information about sample composition. Comprehensive 2D-LC most often pairs two orthogonal stationary phases to separate complex mixtures or resolve difficult coelutions observed in 1D-LC. The power of 2D-LC becomes more apparent as the complexity of the sample increases. The 1D-LC approaches cannot reach the same effective peak capacities within practical time constraints. Online 2D-LC requires fractions of the 1D effluent to be transferred to the 2D column using transfer volumes larger than the peak volumes to avoid undersampling. This technique requires that the second dimension separation be performed in the order of seconds. The main challenge associated with comprehensive 2D-LC is the impact of solvent strength mismatch. For example, if the effluent of the first dimension is stronger than the mobile phases used in the second dimension, significant changes in retention, selectivity, and peak shape may result. Approaches to address peak focusing include such techniques as online dilution of the 1D effluent, temperature modulation, and the use of trapping media (11).
2D-LC can also be applied in an offline configuration, where the 1D fractions are collected and reinjected. Using offline mode, instruments designed specifically for 2D-LC are not required and the user is no longer obligated to employ rapid 2D separations. The offline mode makes the technique more accessible providing that appropriate software is available. In the cannabis industry, this technique could be applied to generate detailed chemical fingerprints for each cultivar, which could prove to be an invaluable technique for strain identification. This technique has already found utility in the screening of cannabinoids in industrial-grade hemp (12). Although online 2D-LC has various approaches to mitigate solvent mismatches, the offline technique affords the ability to perform full evaporation on the collected 1D fractions followed by reconstitution to tailor the diluent specifically for the 2D analysis.
Currently, requirements for potency testing vary from state to state. Many jurisdictions only require that products be tested for total THC and total CBD. California requires that the cannabinoid profile of samples are evaluated for THC, tetrahydrocannabinolic acid (THCA), CBD, cannabidiolic acid (CBDA), CBG, and CBN (1). As more states begin to legalize medical and recreational marijuana, additional cannabinoids may become regulated. Furthermore, regulatory requirements are not the only driving factor for improved cannabinoid profiling. Expanding medical research could place significant value on minor cannabinoids. By updating legacy methods with improved analytical instrumentation, column technology, detection, and analytical techniques, the cannabis testing industry will not only be able to exceed current requirements, but also meet the needs of future research.
Mycotoxins
Mycotoxins, secondary metabolites produced by fungi, are among the major contaminants in agricultural products that can cause disease and death in humans and other animals. Techniques for controlling mycotoxins are largely preventative. Careful control of temperature and humidity prevents mycotoxin-producing fungi from flourishing (13). Cannabis is particularly susceptible to the growth of molds and fungi during post-harvest curing, when moisture content must be well-controlled. Unlike cannabinoids that have only recently become the subject of regulations, the health concerns associated with exposure to mycotoxins through the ingestion of contaminated foods and feeds have prompted the U.S. Food and Drug Administration (FDA) to enforce strict regulatory limits since 1985. A number of official methods have been published for their analysis such as AOAC method number 2008.2 (14). This method measures aflatoxin B1, B2, G1, G2, and ochratoxin A in ginseng and ginger (14).
Much like cannabinoid testing, requirements for mycotoxin testing in cannabis vary from state to state. Not all states require testing for mycotoxins, but those that do require testing for the same five: aflatoxin B1, B2, G1, G2, and ochratoxin A (Figure 3). Acceptable levels of mycotoxins in samples are currently set at <20 µg/kg for total aflatoxins (summation of B1, B2, G1, and G2) and <20 µg/kg for ochratoxin A in the state of California (1). The detection of mycotoxins is possible by various analytical methods: GC–MS with preinjection derivatization, HPLC in combination with post-column reaction and fluorescence detection, enzyme-linked immunosorbent assay (ELISA), or LC–MS/MS. LC–MS/MS is considered the gold standard since derivatization is not required, some mycotoxins lack fluorescence, and ELISA may be susceptible to false positives.
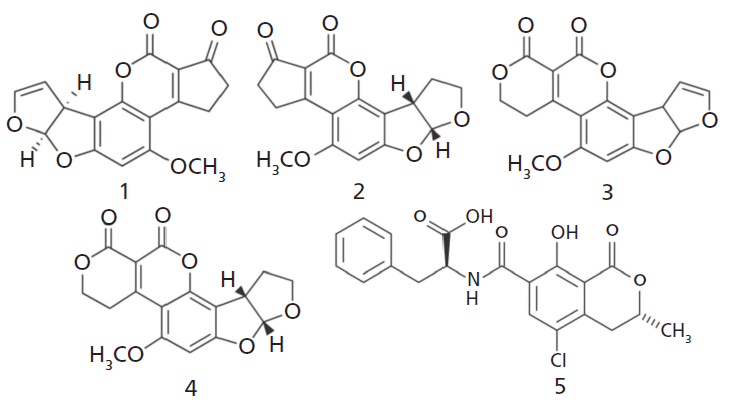
Figure 3: Chemical structures of aflatoxins and ochratoxin A: (1) aflatoxin B1, (2) aflatoxin B2, (3) aflatoxin G1, (4) aflatoxin G2, and (5) ochratoxin A.
In the analysis of mycotoxins, using immunoaffinity columns (IACs) to reduce matrix effects and eliminate potential sources of interference for LC–MS/MS analysis is common. These columns contain monoclonal antibodies that are cross reactive towards specific mycotoxins resulting in highly selective sample cleanup. Connection of these columns in tandem has been shown to be a cost-effective solution for multimycotoxin analysis by LC–MS/MS. IACs that target the mycotoxins of interest in cannabis testing are commercially available. When not used, significant matrix interferences have been shown to be eluted near target mycotoxins, which resulted in an adverse effect on measured ion ratios (15).
Although IACs are effective for sample cleanup, online sample preparation techniques are attractive from the standpoint of increased throughput. To the best of our knowledge, no methods have been published that pair IACs to an online workflow. Beyond IAC cleanup, multiple heart-cutting 2D-LC has been shown to be a viable technique for the analysis of aflatoxin B1, B2, G1, G2, and ochratoxin A in smokeless tobacco (16). This technique could be modified to find applicability in routine cannabis testing laboratories. Trap columns, in particular, could play a vital role in bringing the workflow online (Figure 4).
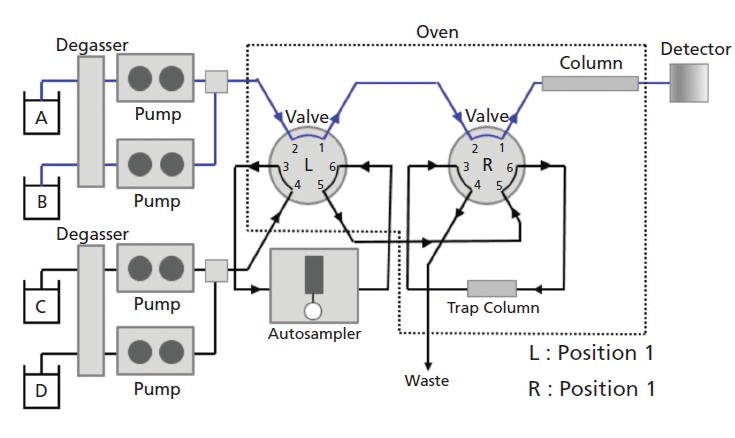
Figure 4: Example system configuration for the trap-and-elute technique. The addition of valve L allows for the rapid transition between routine, single dimension analysis and a trap-and-elute configuration.
Pesticides
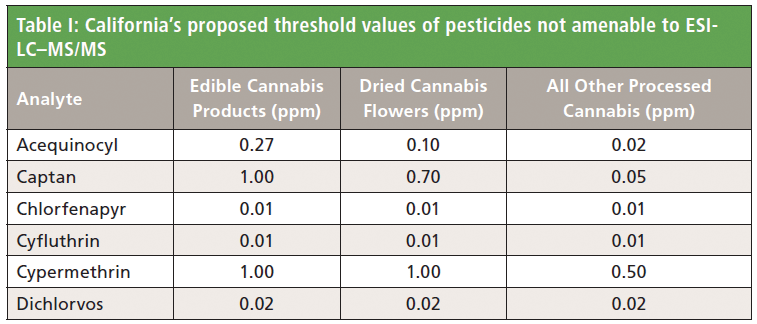
Akin to mycotoxins, multiresidue pesticide methods have been established in food safety testing for many years. MS/MS is the gold standard for detection, and both LC and GC have their places because of sample complexity, compound amenability, and technique orthogonality. LC–MS/MS is a much more versatile and universal technique compared to GC–MS/MS, but organochlorine pesticide residues, for example, are notoriously difficult to ionize by electrospray LC–MS/MS (Table I). Exploiting the overlap in pesticide residues that are amenable to both techniques is a powerful strategy for confirmation analysis. Regulatory requirements for pesticide testing in cannabis vary significantly from state to state, not only in the number of residues monitored, but also in allowable tolerances. These differences heavily influence the sample preparation, instrumentation, and techniques performed in each state. In California, 66 pesticide residues have been proposed for regulation with levels of detection as low as 10 ppb (1). This is the largest panel of pesticide residues and the lowest detection threshold requirements proposed for state regulation to date.
Not only is sensitivity a concern for multiresidue pesticide analysis, but also the retention and selectivity of pesticides that have different charge states, functional groups, and varying amounts of hydrophobicity. Highly polar residues such as daminozide (Figure 5) are difficult to retain using reversed-phase mechanisms. HPLC stationary phases with polar functionalities have been developed for the retention of polar pesticides, but peak shapes for different classes of residues could be adversely affected and result in an overall loss in sensitivity. Two interesting strategies that have been used for multiresidue pesticide analysis both employ the use of two analytical columns with orthogonal stationary phases, but are not true comprehensive 2D-LC techniques. The first technique requires two UHPLC systems to allow for the simultaneous injection of sample onto two separate, orthogonal stationary phases, after which the effluent is combined before detection by MS/MS (17). The second technique uses the combination of a hydrophilic-interaction chromatography (HILIC) column, a reversed-phase trap column, and a reversed-phase analytical column. Pesticides not retained on the HILIC column are diverted to the reversed-phase trap column at the beginning of the run. After the initial fraction is trapped, the valve switches to MS detection, which allows the completion of the HILIC analysis. The trap is then backflushed onto the reversed-phase analytical column for the analysis of more-nonpolar pesticides (18).
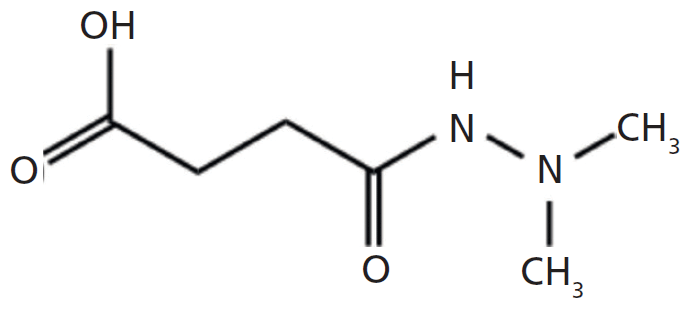
Figure 5: Chemical structure of a highly polar pesticide requiring analysis in the state of California per proposed regulations: daminozide.
Although the chromatographic analysis of pesticide residues in solvent can be challenging on its own because of a wide range of polarities, complex matrices add a new level of difficulty. Cannabis itself contains cannabinoids, terpenes, fatty acids, sugars, flavonoids, and pigments (2), but the matrix is further complicated when added to cannabis-infused products. This matrix complexity presents a huge challenge during method development since every new product type that is received for testing may require a unique sample preparation. There are numerous products that are commercially available for the many facets of sample cleanup, but a universal method such as homogenization followed by solvent extraction is highly desired.
Looking beyond sample preparation alone, chromatography could be the enabling technology that allows for a universal method. Simply "diluting out" matrix interferences has been proposed as a viable means of effective sample preparation (19). This approach requires both state-of-the-art mass spectrometers and careful consideration of the chromatography. One possible solution to improve the sensitivity with electrospray is to downscale the size of the liquid separation to improve the ionization efficiency associated with reduced flow rates. The application of nanoflow liquid chromatography has successfully been applied to veterinary drugs in food samples of animal origin using a 100-fold dilution factor, which resulted in the complete removal of matrix effects (20). Removing all influences from matrix allows for the use of solvent-based calibration curves, which is both convenient and cost-saving. Advances in nano LC columns (<0.1 mm i.d.) have resulted in performance, robustness, and ease of use comparable to those of standard HPLC columns (21).
In addition to modified LC–MS/MS-based techniques, SFC–MS/MS is an alternative, orthogonal approach that has also had success for the quantification of pesticides. A powerful aspect of this approach is the ability to analyze a wider range of polarities than currently available by GC–MS/MS or LC–MS/MS (22).
Summary
The need for cannabis testing has increased rapidly over the past several years, requiring testing laboratories to swiftly adapt to increased demand and develop methodologies that meet or exceed the expanding requirements of state regulations. Recent LC technology has already found its utility in the field through the use of SPPs for the analysis of cannabinoids. SFC is also emerging as a technique that could address analysis needs for both cannabinoid profiling and pesticide testing. The successful application of hyphenated techniques for the analysis of pesticides and mycotoxins in the food industry could serve as a foundation for the utilization of technology advancements in cannabis testing. The use of multidimensional chromatography for cannabis has already begun to appear in literature and is an encouraging sign for the rapid adoption of new technology in this budding industry.
References
(1) California Code of Regulations, "Chapter 5. Testing Laboratories," Bureau of Marijuana Control Proposed Text of Regulations (CA Code of Regulations, Title 16, Div. 42).
(2) M. ElSohly and W. Gul, in Handbook of Cannabis, 1st ed., R.J. Pertwee, Ed. (Oxford University Press, Oxford, United Kingdom, 2014), pp. 3–22.
(3) F.E. Dussy, C. Hamberg, M. Luginbuhl, T. Scherzmann, and T.A. Briellmann, Forensic Sci. Int. 149, 3–10 (2005).
(4) T.J. Raharjo and R. Verpoorte, Phytochem. Anal. 15, 79–94 (2004).
(5) "16 Cannabinoids on Raptor ARC-18 2.7 µm by LC-UV," http://www.restek.com/chromatogram/view/LC_GN0578 (accessed Mar 23, 2018).
(6) J. De Vos, K. Broeckhoven, and S. Eeltink, Anal. Chem. 88, 262–278 (2016).
(7) "16 Cannabinoids on Raptor ARC-18 1.8 µm by LC-UV," http://www.restek.com/chromatogram/view/LC_GN0579 (accessed Mar 23, 2018).
(8) M. Wang, Y. Wang, B. Avula, M.M. Radwan, A.S. Wanas, Z. Mehmedic, J. van Antwerp, M.A. ElSohly, and I.A. Khan, J. Forensic Sci. 62, 602–611 (2017).
(9) G. Mazzoccanti, O.H. Ismail, I D'Acquarica, C. Villani, C. Manzo, M. Wilcox, and A. Cavazzini, Chem. Commun. 53, 12262–12265 (2017).
(10) J.M. Finefield, D.H. Sherman, M. Kreitman, and R.M. Williams, Angew. Chem. Int. Ed. 51, 4802–4836 (2012).
(11) D.R. Stoll and P.W. Carr, Anal. Chem. 89, 519–531 (2017).
(12) J. Pandohee, B.J. Holland, B. Li, T. Tsuzuki, P.G. Stevenson, N.W. Barnett, J.R. Pearson, O.A.H. Jones, and X.A. Conlan, J. Sep. Sci. 38, 2024–2032 (2015).
(13) J.W. Bennett and M. Klich, Clin. Microbiol. Rev. 16, 497–516 (2003).
(14) AOAC Official Method 2008.02, Aflatoxins B1, B2, G1, and G2 and Ochratoxin A in Ginseng and Ginger. Multitoxin Immunoaffinity Column Cleanup and Liquid Chromatographic Quantitation (First Action 2008, Final Action 2013).
(15) J. Wilcox, C. Donnelly, D. Leeman, and E. Marley, J. Chromatogr. A 1400, 91–97 (2015).
(16) D. Qi, T. Fei, H. Liu, H. Yao, D. Wu, and B. Liu, J. Agric. Food Chem . 65, 9923–9929 (2017).
(17) J. Robles-Molina, B. Gilbert-López, J.F. Garcĺa-Reyes, and A. Molina-Dĺaz, J. Chromatogr. A 1517, 108–116 (2017).
(18) S. Kittlaus, J. Schimanke, G. Kempe, and K. Speer, J. Chromatogr. A 1283, 98–109 (2013).
(19) H. Stahnke, S. Kittlaus, G. Kempe, and L. Alder, J. Anal. Chem. 84, 1474–1482 (2012).
(20) J. Alcántara-Durán, D. Moreno-González, B. Gilbert-López, A. Molina-Dĺaz, and J.F. Garcĺa-Reyes, Food Chem.245, 29–38 (2018).
(21) L. Rieux, E.J. Sneekes, and R. Swart, LCGC North Am. 29, 926–934 (2011).
(22) D. Baker, A. Barnes, C. Titman, J. Horner, and N. Loftus, "Application of SFC-MS/MS for the Quantification of Highly Polar Pesticides in a Range of Food Samples," https://www.shimadzu.com/an/literature/lcms/ego117080.html (accessed Mar 27, 2018).
Justin Steimling and Ty Kahler are with Restek Corporation in Bellefonte, Pennsylvania. Direct correspondence to: Justin.Steimling@restek.com

Detecting Hyper-Fast Chromatographic Peaks Using Ion Mobility Spectrometry
May 6th 2025Ion mobility spectrometers can detect trace compounds quickly, though they can face various issues with detecting certain peaks. University of Hannover scientists created a new system for resolving hyper-fast gas chromatography (GC) peaks.
University of Oklahoma and UC Davis Researchers Probe Lipidomic Profiles with RP-LC–HRMS/MS
May 6th 2025A joint study between the University of Oklahoma Health Sciences Center (Oklahoma City, Oklahoma) and the UC Davis West Coast Metabolomics Center (Davis, California) identified differentially regulated lipids in type 2 diabetes (T2D) and obesity through the application of reversed-phase liquid chromatography-accurate mass tandem mass spectrometry (RP-LC-accurate MS/MS).
Automated Sample Preparation (ISO 20122) for MOSH/MOAH in Seasoning Oils
May 6th 2025This work presents an Automated Sample Preparation procedure for MOSH/MOAH analysis of Seasoning Oils. We compare results from a manual epoxidation procedure compliant with DIN 16995 with results based on fully automated sample preparation (epoxidation and saponification) compliant with ISO 20122. In both cases, online clean-up via activated aluminum oxide (AlOx) are used to remove interfering n-alkanes from the MOSH fraction during the HPLC run. Automated data evaluation using a dedicated software (GERSTEL ChroMOH) is presented.

.png&w=3840&q=75)

.png&w=3840&q=75)


.png&w=3840&q=75)


.png&w=3840&q=75)


