On-Line Two-Dimensional Liquid Chromatography (2D-LC) for the Analysis of Pharmaceuticals
LCGC Europe
On-line two-dimensional liquid chromatography (2D-LC) embracing mainly comprehensive LC (LC×LC) and multiple heart-cutting LC (mLC–LC) offers new opportunities for in-depth characterization of pharmaceuticals. Reversed-phase LC × reversed-phase LC using different column chemistries and mobile phases provides good orthogonality for a wide range of applications related to small molecule drugs. Moreover, hardware configurations and software are now commercially available to perform LC×LC and mLC–LC measurements in a reproducible manner.
Photo Credit: Science Photo Library/Getty Images
Pat Sandra1, Gerd Vanhoenacker1, Mieke Steenbeke1, Frank David1, Koen Sandra1, Claudio Brunelli2, and Roman Szucs2, 1Research Institute for Chromatography, Kortrijk, Belgium, 2Pfizer Global R&D, Analytical R&D, Sandwich, Kent, United Kingdom
On-line two-dimensional liquid chromatography (2D-LC) embracing mainly comprehensive LC (LC×LC) and multiple heart-cutting LC (mLC–LC) offers new opportunities for in-depth characterization of pharmaceuticals. Reversed-phase LC × reversed-phase LC using different column chemistries and mobile phases provides good orthogonality for a wide range of applications related to small molecule drugs. Moreover, hardware configurations and software are now commercially available to perform LC×LC and mLC–LC measurements in a reproducible manner.
Liquid chromatography (LC) is by far the most powerful technique in pharmaceutical analysis. At the end of the 20th century, LC was more or less considered a mature technology for the characterization of active ingredients and impurities, as well as for research and development (R&D) and quality assurance/quality control (QA/QC). Incorporation of “sensational” LC technological developments were relatively scarce, and the most exciting was the breakthrough of LC hyphenated to mass spectrometry (MS). The main key words at that time, in the pharmaceutical laboratories and at instrument manufacturers, were related to ruggedness, regulations, validations, good manufacturing practice (GMP), and good laboratory practice (GLP).
At the beginning of the 21st century, tremendous improvements were made in LC column technology and instrumentation. The introduction of sub-2-µm porous and superficially porous particles (down to 1.3 µm) in combination with LC instrumentation that could operate at pressures over 1000 bar opened new horizons in terms of throughput (analyses in minutes) and resolution (peak capacities [nc] of about 500 in 1 h). Moreover, during that period, developments in mass spectrometry were exploding as well (including accurate mass, high resolution, MS/MS, and ion mobility), resulting in very powerful systems to cope with the qualitative and quantitative analytical work in the contemporary pharmaceutical laboratory.
Another recent development recognizing momentum is on-line two-dimensional LC or 2D-LC. The recent commercialization of robust 2D-LC instrumentation has given a boost to its application, and more and more analytical challenges are being tackled with 2D-LC.
Two-Dimensional Liquid Chromatography and Main Formats
In 2D-LC, peaks, parts, or the whole chromatogram are subjected to two different separation mechanisms. The features of the first two techniques performed in an off-line mode have been known for more than 50 years, but are not discussed in this contribution because contemporary on-line 2D-LC is highlighted. For interested readers, the pros and cons of on-line versus off-line 2D-LC have been described by Guiochon et al. (1), while the principles and practical applications of on-line 2D-LC have been summarized by P.W. Carr and D.R. Stoll (2).
On-line 2D-LC can be divided into two main types. In comprehensive two-dimensional LC (LC×LC) the whole stream of effluent of the first (1D) column is transferred in a number of small fractions to the second (2D) column. In heart-cutting LC (LC–LC), one peak or one part of the chromatogram is transferred to the second column. Multiple peaks or multiple parts of the chromatogram can also be selected for transfer to the second column (mLC–LC).
In recent years, LC×LC has received the greatest attention because of the high peak capacity it offers. The theoretical total peak capacity is about 60% of the product of the 1D and 2D column peak capacities, while the total analysis time is nearly equal to the analysis time on the first column (+ ca. 1 min). The most widely used interface is the loop type interface. Various valve configurations are possible and one elegant way is based on a two-position eight-port switching valve equipped with two storage loops of identical volume (Figure 1[a]). Typically, a narrow bore column is applied as the 1D column (1-mm or 2-mm i.d. operated at a flow rate <100 µL/min) and a conventional 3- or 4.6-mm column as the 2D column (operated at 2.5 mL to 5 mL/min flow). The loop volumes are 40 µL to 100 µL and modulation times are typically 20–30 s. The highest orthogonality (optimum occupancy of the 2D-space) is theoretically obtained by combining different modes of LC (reversed-phase LC, normal-phase LC, hydrophilic interaction LC [HILIC], hydrophobic interaction chromatography [HIC], ion exchange chromatography [IEX], size-exclusion chromatography [SEC], and supercritical fluid chromatography [SFC]). Reversed-phase LC is often applied in the second dimension because of the availability of highâquality reversedâphase LC columns and its compatibility with MS. We recently described the possibilities of using LC×LC as a novel tool for peptide mapping of therapeutic protein biopharmaceuticals (monoclonal antibody originators and biosimilars) in both R&D and routine (QA/QC) environments (3). Several LC modes were combined, such as strong cation exchange chromatography (SCX) × reversed-phase LC, HILIC × reversed-phase LC, and reversed-phase LC × reversedâphase LC; surprisingly, the latter mode was very powerful, with the lower orthogonality largely compensated for by superior peak capacity in both dimensions (reversed-phase LC has a much higher nc than SCX and HILIC). Obviously, in reversed-phase LC × reversed-phase LC different column and mobile phase selectivities have to be combined. Moreover, reversed-phase LC × reversed-phase LC is very robust because of the solvent compatibility and can form the basis for the development of robust generic methods in the pharmaceutical industry. The features of LC×LC are illustrated with the analysis of the taxanes in a Taxus sp. extract and with the analysis of forced degradation products of omeprazole.
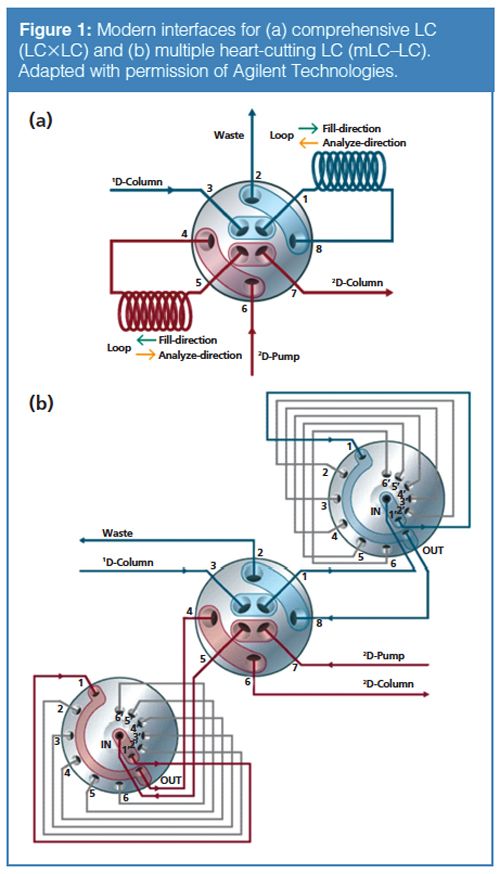
The second on-line 2D-LC mode that, thanks to recent hardware and software developments, is ready to be implemented in routine environments is mLC–LC. In this configuration, the two loops of the LC×LC setup are replaced by two parking decks (valves), each holding six sample loops (Figure 1[b]). Twelve fractions (peaks or parts of the chromatogram) eluting from the 1D column can thus be stored and subsequently analyzed on the second column, which can be a conventional high peak capacity column. The total peak capacity of mLC–LC is equal to the number of collections multiplied by the peak capacity of the second column (nc2). For example, if eight transfers are performed on the first column and nc2 is 250 under the conditions applied, the total peak capacity (nct) is 2000, while the total analysis time is the analysis time on the 1D column plus the analysis time on the 2D column multiplied by the number of collections.
mLC–LC is ideally suited for method development in impurity analysis of active pharmaceutical ingredients (APIs) because overlapping can easily be elucidated (4). We recently applied the technique to the characterization of the antibody-drug conjugate ado-trastuzumab emtansine (5). In this contribution, a very original method based on mLC–LC, and developed in the Pfizer laboratories, is described and concerns the evaluation of degradation in LC as a result of artefacts originating from on-column or mobile phase degradation.
LC×LC in the Determination of the Antitumour Activity of Taxus sp. Extracts
Taxanes are a group of diterpenes, first isolated from the bark of Taxus brevifolia (Pacific yew tree) in 1971 (6). They show mitotic inhibitory activity and are therefore applied in cancer therapy. One of the taxanes, namely taxol (paclitaxel), shows excellent anti-tumour activity and is used in the treatment of breast, lung, and pancreatic cancers. The taxol content of the bark is, however, low and a lot of research has been devoted to the synthesis of this diterpene bearing 11 chiral centres (see the insert in Figure 2[a]). Total synthesis proved possible, but this was not a commercially sound route. Semisynthesis from more abundant precursors (10-deacetylbaccatin-III, baccatin-III, and cephalomannine) and plant cell fermentation are now the main sources of therapeutic taxol (7). Accurate analysis of the amounts of taxol and its precursors is therefore necessary but challenging as a result of their low concentration in the complex plant extract. Moreover, the matrix constituents can interfere in ultraviolet (UV) and MS detection, making correct quantification of the target compounds difficult. An efficient way to increase peak capacity significantly is to perform LC×LC and to also use MS detection for confirmation of the identity of detected taxanes in Taxus sp. extracts.
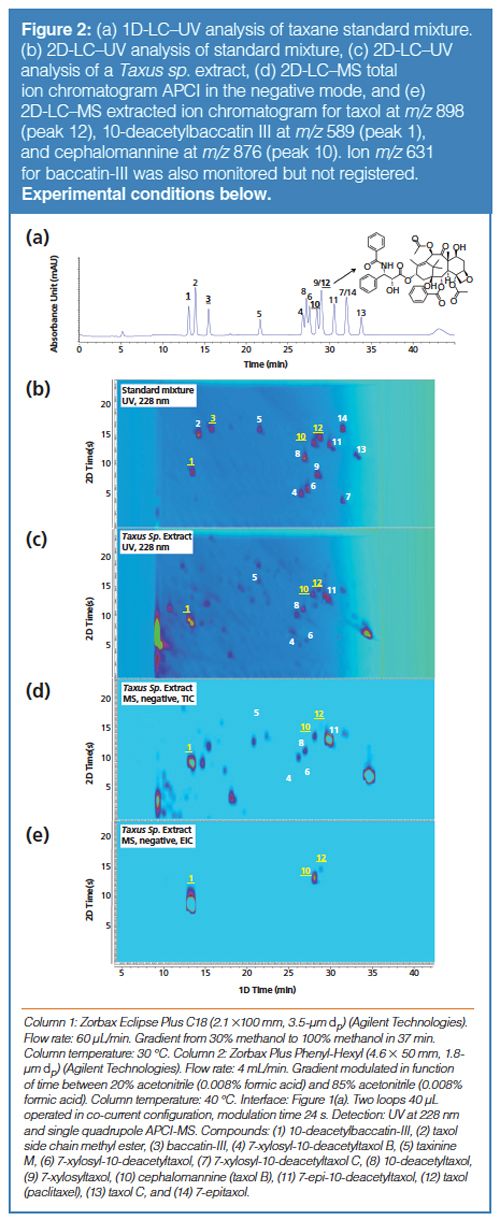
Figure 2(a) shows the 1D-LC analysis of a set of 14 taxanes consisting of taxol, precursors, and analogues. Under the selected LC conditions, some peak overlap (9/12 and 7/14) occurred that can be solved eventually by selecting other LC separation conditions. However, this will not solve the limited peak capacity space for the complex plant extract. Figure 2(b) shows the contour plot of the 2D-LC separation using the same column (C18) and conditions as in the 1D separation (C18) in the first dimension and another short reversedâphase (phenylâhexyl) LC column in the second dimension. Orthogonality in reversed-phase LC × reversedâphase LC is thus achieved by using different column chemistries and mobile phases, such as water-methanol gradient in dimension 1 and water-acetonitrile gradient in dimension 2 (or vice versa). In the contour plot all compounds, including taxol (peak 12) and its precursors (peaks 1, 3, and 10), are separated and nicely distributed over the 2D space. The method was applied to the analysis of an extract of Taxus sp. (Figure 2[c]) and taxol (peak 12), 10-deacetylbaccatin III (peak 1), and ephalomannine (peak 10) were detected, while baccatin III (peak 3) was absent. The identity of these spots was further confirmed by mass spectrometry and the total ion chromatogram (TIC) recorded in the negative mode is shown in Figure 2(d). By using ion extraction of the formate adduct ions (Figure 2[e]), only the relevant solutes are highlighted (taxol at m/z 898 [peak 12], and the precursors 10-deacetylbaccatin III at m/z 589 [peak 1] and cephalomannine at m/z 876 [peak 10]). The figures of merit of LC×LC for the quantitative determination of taxol and precursors were described elsewhere (8).
LC×LC in Stress Testing Studies with Omeprazole as an Example
Stress testing, also called forced degradation study, is one of the most important analyses in the pharmaceutical laboratory. The inherent stability of the API and other drug products should be evaluated and the degradation pathways revealed. Stress testing also helps to establish the intrinsic stability of the API. Stress testing includes a number of experiments, such as the effect of temperature, humidity, oxidation, photolysis, or hydrolysis at different pH values, as outlined, for example, by the World Health Organization (9). Forced degradation studies can introduce minor modifications, such as isomerization of the API and high resolution separations, which are mandatory to elucidate all forced degradation products.
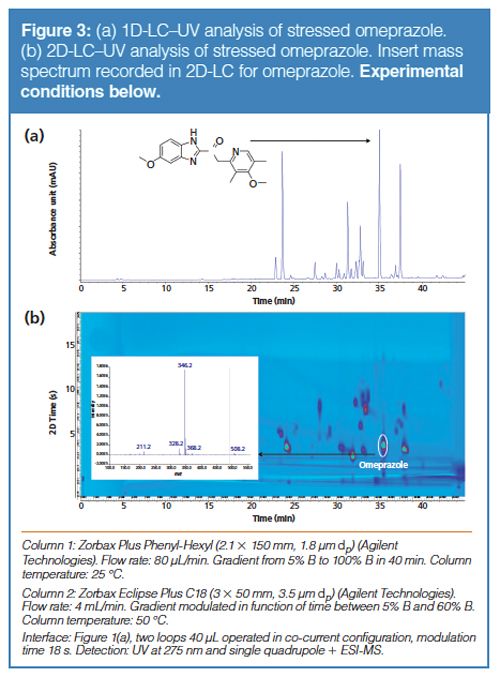
This is illustrated in Figure 3(a), which shows the 1D-LC analysis of a heavily stressed (temperature, UV irradiation, and organic solvent) omeprazole tablet. One has the impression that in this analysis the omeprazole peak (at 35 min) is corresponding to only one product, the API, but recording a mass spectrum indicated that several solutes are coeluting in the peak. Increasing the resolution by using longer columns or smaller particles is not a realistic approach because not enough peak capacity can be created to resolve the solutes in the main peak (zero resolution). Selection of another stationary phase is an option, but the risk that other peaks will now overlap is realistic. By far the best solution is to combine different selectivities in an LC×LC combination - even if the two mechanisms are similar; for example, reversed-phase LC × reversed-phase LC but using different stationary phases and mobile phases. The 2D-LC plot of the sample on the same column in the first dimension and a second, different C18 column in the second dimension is shown in Figure 3(b). The first dimension column was operated with a mobile phase composed of 0.2% ammonium acetate (mobile phase A) and methanol (mobile phase B), while the second dimension separation was performed with 0.1% formic acid (mobile phase A) and acetonitrile (mobile phase B). More than 50 spots are visible in the plot and the omeprazole peak is resolved in the second dimension in four well-defined products. The mass spectrum recorded for omeprazole in the 2D-LC plot is shown in the insert and a clean spectrum with m/z 346 [omeprazole 345 + 1]+ is recorded. The conditions developed in this 2D-LC method can be considered more or less generic for detection of impurities in APIs, at least when eluting under reversedâphase LC conditions. Good results were also obtained for studies of metoclopramide, acetaminophen, diclophenac, ibuprofen, and lidocaine. Moreover, the method is very robust and is easily repeatable. Note that depending on the aim of the analysis, a single quadrupole mass spectrometer (SQMS) can be installed as confirmation tool or a high resolution quadrupole time-of-flight mass spectrometer (QTOF-MS) for identification of unknowns, as illustrated in our biopharmaceutical work (3,5).
Application of mLC–LC in the Study of On-Column Degradation in the Impurity Profiling of an API
The development of purity and stability-indicating methods is one of the major activities during drug development, and requires dedicated resources in terms of staff and instrumentation. Because of promising early clinical results, the development of some projects can often be accelerated to achieve a fast-track submission. Examples include several infective and oncology treatments. In this respect, analytical departments are required to support development and stability programmes at an ever-increasing pace, with little prior knowledge regarding excipient compatibility and stability.
Liquid chromatography covers a large portion of method development. The selection of stationary phases in combination with a wide pH range provides a selectivity space that is in most cases sufficient for the separation and the identification of all constituents of a sample. In addition, mass spectrometry adds a further dimension to determine the purity of peaks for potential coeluting impurities. One potential problem in this approach - and often underestimated - is the reactivity of the analytes in the chromatographic environment, which can either degrade or even generate artefactual impurities. APIs, reaction intermediates, process-related impurities (PRIs), and degradation products can often be unstable in water and may degrade rapidly (10). In this case neither reversed-phase LC nor HILIC would be suitable for these types of analytes. In some cases, water-free SFC can offer a solution because it offers a wide selectivity range. It has also recently become competitive to LC in terms of performance and detection capabilities.
The appearance of peaks that are generated during the chromatographic process can be difficult to identify and can cause several problems, not only during method development but also during method transfer to receiving and regulated laboratories. Determining whether observed peaks are artefacts or real impurities can take several weeks and consume significant resources. On-column sample degradation has been discussed by John Dolan and a series of experiments was proposed to investigate the origin of suspected peaks in a chromatogram (11). On-column degradation of a pharmaceutical compound, characterized by an aniline substructure, was recently reported in the literature (12). Similar on-column degradation products were also reported by Dong et al. (13) - the cause being attributed to gradual accumulation of trace metals, as also postulated by Myers et al. (14).
We report here the findings from the method development of an oncology candidate. The determination of the key predictive sample set (KPSS) used for method development was made difficult by the formation of artefact peaks. It was necessary to determine which impurities were artificially generated on the column for those to be discarded from the KPSS. This would also differentiate them from the sensitive ones requiring accurate and precise quantification. In this study, the use of 2D-LC in the mLC–LC mode was the quickest way to determine the nature of some observed peaks, and enabled selection of method conditions that could prevent both the degradation of impurities and the generation of artefacts. Contrary to classical 2D-LC in which orthogonality is the key word, in this application the same stationary and mobile phases were used in both the first and the second dimensions. This approach provided results in a very short space of time and therefore ensured that unsuitable conditions were avoided in method development. This was essential considering the fast pace of the project.
Experiments were performed on a 2D-LC system equipped with the interface shown in Figure 1(b). The selection valves were equipped with 12 loops of 40 µL. The 1D and 2D columns were the same identical C18 columns. Mobile phase ingredients were HPLC-grade water, acetonitrile, and ammonium hydroxide solution (25% w/v). Mobile phase A (pH 10.8) was prepared by dissolving 1 mL of ammonium hydroxide solution to 950 mL of water to which 50 mL of acetonitrile was added. Mobile phase B was prepared by mixing 50 mL of purified water into 950 mL of acetonitrile. The gradient was from 10% B to 50% B in 15 min. The flow rate was 0.4 mL/min and the temperature 25 °C. These conditions were applied to both the first and second dimensions. The injection volume was 10 μL. The drug was a free base substance produced in-house by Pfizer Global R&D. Samples were prepared at 0.5-mg/mL concentration in 50:50 water-acetonitrile diluent. Heart-cut sampling was time-driven. The retention times and sampling times were as follows: fraction 1 (8.10 min, 0.05 min), fraction 2 (8.27 min, 0.01 min), fraction 3 (8.30 min, 0.01 min), fraction 4 (8.35 min, 0.05 min), fraction 5 (8.43 min, 0.05 min), and fraction 6 (8.77 min and 0.05 min). Detection was by diode array detector (DAD) at 225.4 nm and the 2D-LC system was also hyphenated to a time-of-flight
mass spectrometer for the structural elucidation of the impurities.
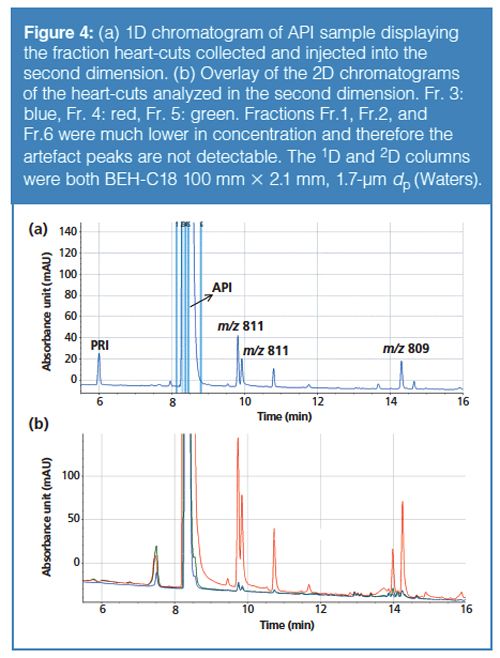
The 1D chromatogram of the freshly prepared oncology candidate sample is shown in Figure 4(a). A new column was used and the TOF-MS system was thoroughly cleaned before analysis. The two peaks eluting at about 10 min and the peak eluting at 14 min were suspected to be formed on-column with the selected mobile phase (pH 10.8). In fact, their presence and their level (sometimes up to 0.3%) were not consistent across the different chromatographic conditions screened and the samples tested. Moreover, they were not detected by DAD or by TOF-MS of selected ions to exclude coelution when a relatively neutral pH (ammonium acetate) was applied to mobile phase A. They were also not formed in a 0.1M NaOH solution of the API for 24 h at 40 °C, indicating that interaction with the stationary phase was catalyzing their formation. The two peaks at 10 min and the one at 14 min were characterized by an ion at m/z 811 for the first two and at m/z 809 for the later one. The high resolution MS data suggested that the peaks were hydrazo (m/z 811) and azo (m/z 809) dimers of the API (Figure 5).
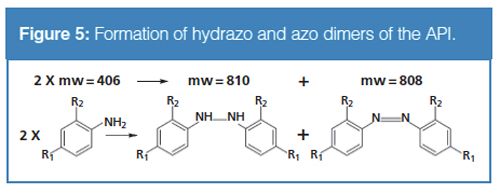
The structures of the dimers correspond to those observed and reported in the literature (12). For the formation of these dimers, the interaction with the stationary phase is essential.
To confirm this on-column formation, a 2D-LC experiment was designed using the same stationary and mobile phases and settings in both the first dimensions. Six fractions of the main band were sampled and each cut was reinjected into the second dimension. The details of the heart-cuts of the main band collected from the first dimension are shown in Figure 4(b). Each fraction of the main band - re-analyzed in the second dimension - generated the late eluting peaks, confirming that the hydrazo and azo dimers are reaction products of the API with the stationary phase in a basic pH medium.
In conclusion, on-column reactivity is likely to occur during the analysis of pharmaceuticals, and the peak profile of an LC analysis may not reflect the real composition of a sample. Conditions used in LC may alter the constituents of a sample and new impurities can be generated. In the presented example, we have demonstrated how powerful mLC–LC can be to elucidate artefact formation by the column using identical conditions in both dimensions. Similar 2D-LC setups were also applied to prove that artefact formation can originate from mobile phase interactions (data not shown). In fast-paced project development, 2D-LC is often the most appropriate technology available to demonstrate the true nature of the peaks detected and to rapidly generate unequivocal data for the development of a robust stabilityâindicating method.
References
- G. Guiochon, N. Marchetti, K. Mriziq, and R.A. Shalliker, J. Chromatogr. A1189(1–2), 109–168 (2008).
- P.W. Carr and D.R. Stoll, Two-Dimensional Liquid Chromatography, Primer, Agilent Technologies, 5991-2359EN (2015).
- G. Vanhoenacker, I. Vandenheede, F. David, P. Sandra, and K. Sandra, Anal. Bioanal. Chem.407, 355–366 (2015).
- S. Krieger, Application Note, Agilent Technologies, 5991-5643EN (2015).
- K. Sandra, G. Vanhoenacker, I. Vandenheede, M. Steenbeke, M. Joseph, and P. Sandra, J. Chromatogr. B Analyt Technol. Biomed. Life Sci. doi: 10.1016/j.jchromb.2016.04.040 (2016).
- M.C. Wani, H.L. Taylor, M.E. Wall, P. Coggon, and A.T. McPhail, J. Am. Chem. Soc.93, 2325–2327 (1971).
- X. Wang, Y. Huang, A.J. Mort, Y. Zeng, C.G. Tauer, and K.D. Cochran, Z. Naturforsch. 61c, 619–624 (2006).
- G. Vanhoenacker, F. David, K. Sandra, P. Sandra, U. Huber, S. Reichenbach, Application Note, Agilent Technologies, 5991-3576EN (2014).
- http://apps.who.int/medicinedocs/documents/s19133en/s19133en.pdf
- Y.Li, C.D. Medley, K. Zhang, L. Wigman, and N. Chetwyn, J. Pharmaceut. Biomed. 92, 114–118 (2014).
- J.W. Dolan, LCGC North America24(11), 1184–1190 (2006).
- F. Wang, X.K. Liu, S Lai, J. Fang, and D. Semin, J. Chromatogr. A1218(22), 3502–3510 (2014).
- M. Dong, G.D. Miller, and R.K Paul, J. Chromatogr. A 987(1–2), 283–290 (2003).
- D.P. Myers, E.M. Hetrick, Z. Liang, C.E. Hadden, S. Bandy, C.A. Kemp, T.M. Harris, and S.W. Baertschi, J. Chromatogr. A1319, 57–64 (2013).
Pat Sandra is President of the Research Institute for Chromatography (RIC), in Kortrijk, Belgium, and Emeritus Professor at Ghent University, in Ghent, Belgium.
Gerd Vanhoenacker is LC Product Manager at the Research Institute for Chromatography (RIC).
Mieke Steenbeke is LC Laboratory Technician at the Research Institute for Chromatography (RIC).
Frank David is R&D Director Chemical Analysis at the Research Institute for Chromatography (RIC).
Koen Sandra is Scientific Director at the Research Institute for Chromatography (RIC) and R&D Director at anaRIC biologics, in Evergem, Belgium.
Claudio Brunelli has been at Pfizer Global R&D, in Sandwich, UK, since 2007 and is responsible for method development for active pharmaceutical ingredients and drug product projects.
Roman Szucs is a Senior Research Fellow at Pfizer Global R&D and visiting professor at Ghent University.

A Novel Two-Step Workflow for Extracting Clean Mass Spectra in LC×LC–HRMS Data
March 3rd 2025LCGC International spoke to Paul-Albert Schneide and Oskar Munk Kronik about the development and application of a novel two-step workflow—mass filtering (MF) combined with multivariate curve resolution (MCR)—for extracting clean mass spectra from trace-level compounds in LC×LC–HRMS data.

.png&w=3840&q=75)

.png&w=3840&q=75)


.png&w=3840&q=75)


.png&w=3840&q=75)


