Development of a Rapid MS-Based Screen of Tricyclic Antidepressants as an Alternative to Immunoassay Screening
LCGC Europe
Although enzyme immunoassay (EIA) is a prevalent screening technique, it is also prone to issues such as high false positive rates because of lack of analyte specificity. Mass spectrometry was therefore investigated as an alternative screening technique for the ability to improve analyte specificity on a comparable time scale. In this study, a rapid on-line sample preparation and injection (ROSPI) method was developed using a commercially available guard cartridge on a conventional liquid chromatography–tandem mass spectrometry (LC–MS/MS) system. Using a two-point calibration curve to provide semi-quantitation, a robust method was developed and validated that improved upon the high false positive rate observed in immunoassay screening.
Erin C. Strickland, Oneka T. Cummings, and Gregory L. McIntire, Ameritox, LLC, Baltimore, Maryland, USA
Although enzyme immunoassay (EIA) is a prevalent screening technique, it is also prone to issues such as high false positive rates because of lack of analyte specificity. Mass spectrometry was therefore investigated as an alternative screening technique for the ability to improve analyte specificity on a comparable time scale. In this study, a rapid on-line sample preparation and injection (ROSPI) method was developed using a commercially available guard cartridge on a conventional liquid chromatography–tandem mass spectrometry (LC–MS/MS) system. Using a two-point calibration curve to provide semi-quantitation, a robust method was developed and validated that improved upon the high false positive rate observed in immunoassay screening.
Tricyclic antidepressants (TCAs) block the absorption of serotonin and norepinephrine and are primarily used to treat clinical depression. However, they have also been used or shown promise to treat bipolar disorder, anxiety, attention deficit hyperactivity disorder (ADHD) (1), and chronic pain (for example, neuropathic pain and fibromyalgia) (2,3) alone or in conjunction with other medications. Because of the adverse effects of TCAs they have been largely replaced with newer versions of antidepressants referred to as selective serotonin reuptake inhibitors (SSRIs), serotoninânorepinephrine reuptake inhibitors (SNRIs), and norepinephrine reuptake inhibitors (NRIs). Even with the decrease in popularity for treatment, TCAs are still of interest in urine drug testing for clinicians when determining compliance of patients to their prescribed TCA therapy.
This study investigated developing a mass spectrometry (MS)-based screen for TCAs in urine as an alternative to enzyme immunoassay (EIA) screening. Enzyme immunoassays are commonly used as screens in urine drug testing, but are prone to cross-reactivity, leading to high false-positive rates (4–8). Mass spectrometry can provide better analyte specificity compared to EIA and still be competitive in efficiency if the chromatographic method is not extensive and provides separation of analytes.
Rapid direct-analysis MS techniques have been increasingly popular for screening purposes including Rapid Fire (Agilent Technologies) (9–16), LDTD (Phytronix) (16–19), DART (JEOL USA) (20–26), and DESI (Prosolia) (27–32) among others. Furthermore, our group has published a new direct-analysis MS method known as rapid on-line sample preparation and injection (ROSPI) (33). All of these techniques have proven to be time efficient and useful in drug sample analysis (9–33). Whereas Rapid Fire, LDTD, DART, and DESI require special and expensive equipment, ROSPI only requires the traditional LC–MS/MS system. Another application of ROSPI is described here as a method for screening tricyclic antidepressants using a guard column with a method cycle time of approximately 1.5 min and the following established guidelines for ROSPI methods:
- The method cycle time must be <2 min and ideally ~1 min
- Short columns or guard columns are used to help reach the method cycle time and maintain system pressures
- Complete separation of the peaks and interferences is not necessary
- Only one transition is used per analyte or internal standard (IS) to ensure a sufficient number of points across the peak
- The number of IS compounds is minimized
- Two-point calibration near the cut-off is used for semiquantitation to determine positivity of samples.
A current LC–MS/MS confirmation method was used as a primer for the ROSPI method development and included six TCAs: amitriptyline, nortriptyline, imipramine, desipramine, doxepin, clomipramine, and cyclobenzaprine (a structurally similar compound used as a muscle relaxant) and their corresponding internal standards. Typically, the compounds in this method would be screened by EIA; however, all of these compounds can alternatively be screened with MS in a single injection in less than 2 min and provide a more cost-efficient option. Using the aforementioned criteria, a ROSPI method was developed for tricyclic antidepressants and compared to EIA for selectivity and sensitivity using authentic patient samples.
Experimental
Materials: Amitriptyline, amitriptyline-D3, nortriptyline, nortriptyline-D3, imipramine, imipramine-D3, desipramine, desipramine-D3, clomipramine, clomipramine-D3, doxepin, doxepin-D3, and cyclobenzaprine controls were all purchased from Cerilliant. Cyclobenzarpine-D3 controls were purchased from Toronto Research Chemicals. LC solvents, acetonitrile, and formic acid were purchased from Fisher Scientific and methanol was purchased from EMD Millipore Corporation. Drug-free normal human urine was purchased from UTAK Laboratories. All water was acquired from an in-house Barnstead Nanopure purification unit from Thermo Scientific. Polypropylene 750-µL vials and snap caps with septa were purchased from VWR International.
Samples were run on a Waters Acquity TQD mass spectrometer system. Columns and guard columns were purchased from Waters and were the 5 mm × 2.1 mm, 1.7-µm dp Acquity UPLC BEH Shield RP18 VanGuard PreâColumn for the ROSPI method and the 50 mm × 2.1 mm, 1.7-µm dp Acquity UPLC BEH Shield RP18 column for the confirmation method. Samples were run in positive electrospray ionization mode with all MS settings consistent between the confirmation and ROSPI screen methods. Both the analytical column and the precolumn were used in tandem with an in-line filter system from Waters. Data were analyzed on Waters TargetLynx software.
Methods: Aliquots of drug-free urine were fortified with amitriptyline, nortriptyline, imipramine, desipramine, doxepin, clomipramine, and cyclobenzaprine at various concentrations for the calibration curves and a quality control (QC). For the liquid chromatography–tandem mass spectrometry (LC–MS/MS) confirmation method, all compounds were prepared at concentrations of 200, 1000, 5000, and 20,000 ng/mL for the calibration curve. For the ROSPI screen method all compounds were prepared at concentrations of 200 and 750 ng/mL for the calibration curve; however, additional concentrations at 100, 250, 500, 1000, and 20,000 ng/mL were prepared for the ROSPI validation experiments. All samples prepared for the confirmation method were diluted 6× with 200-ng/mL amitriptyline-D3, nortriptyline-D3, imipramine-D3, desipramine-D3, clomipramine-D3, doxepin-D3, and cyclobenzaprine-D3 in 0.1% formic acid in water and centrifuged before a 5-µL injection onto the column. Sample preparation for ROSPI was the same 6× dilution except the internal standards were reduced to using only 200 ng/mL of imipramine-D3 and 400 ng/mL of clomipramine-D3 in 0.1% formic acid in water followed by centrifugation and a 5-µL injection. The gradient for the confirmation method was 2.6 min with a 3.5-min cycle time. The gradient was improved to 0.6 min with a ~1.5âmin cycle time for the ROSPI screening method. The flow rate was 0.5 mL/min in the confirmation method, but was increased to 0.8 mL/min in the ROSPI screen method. The solvents used for both methods were 0.1% formic acid in water for solvent A and methanol for solvent B. Additionally, the weak wash was the same as solvent A, the strong wash was the same as solvent B, and the seal wash was 10:90 acetonitrile–water. Because of the cycle time for the sample manager–autosampler, the method time for the ROSPI screen method could not be shortened. In the confirmation method two MRM transitions were used for every analyte, including the IS compounds. In the screening method, the quantifier ion transition, or the most abundant transition, was used for every analyte, including the IS compounds. Data were acquired in positive electrospray ionization mode, and all MS conditions remained the same for both methods.
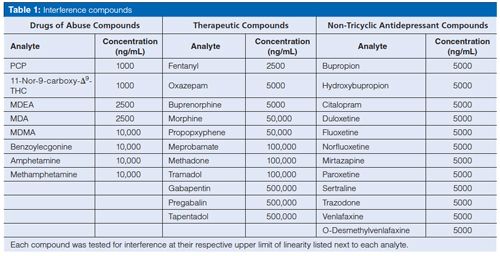
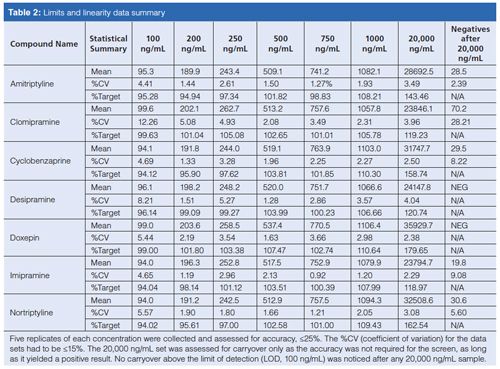
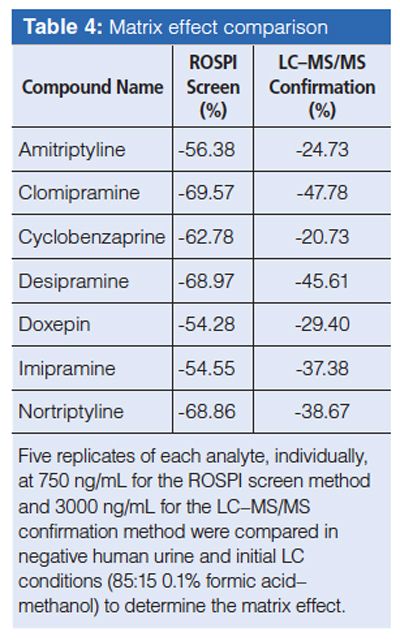
As the confirmation method was previously validated, validation experiments were performed only for this screening method and included limits, linearity, carryover, precision and accuracy, matrix effect, interference, and patient comparison. The limits, linearity, and carryover experiments were combined and included five replicates of each 100 (lower limit of detection), 200 (cut-off), 250, 500, 750, 1000 (upper limit of linearity and carryover for amitriptyline, doxepin, cyclobenzaprine, nortriptyline), and 20,000 ng/mL (upper limit of linearity and carryover for imipramine, desipramine, and clomipramine) were averaged and the %CV was calculated for each analyte. Precision and accuracy were assessed across three days using three replicates of the 250-, 750-, and 1000-ng/mL concentrations for each analyte. Matrix effect included five replicates of each analyte individually prepared in matrix (negative human urine) and LC starting conditions (85:15 0.1% formic acid in water–methanol) at 750 ng/mL. The matrix effect was also compared to the matrix effect of the confirmation method, which was prepared in the same manner using a concentration of 3000 ng/mL. Interference was tested both for false positive results and signal suppression. The former was tested by running select compounds listed in Table 1 in the absence of analytes and determining if a positive result was observed. Suppression was tested by running the same selected compounds in Table 1 but in the presence of the TCA analytes at the cut-off value, 200 ng/mL. This was to determine if the TCA analyte was still providing a signal and quantitative value within acceptability limits or if the TCA analyte signal would be suppressed to indicate the potential for a false negative. Finally, a comparison of 224 authentic patient samples that were a mixture of known positives, known negatives, and unknowns was correlated to EIA results and confirmation results to determine the false positive and false negative rates as applicable.
Results and Discussion
All analytes were fit with a linear regression that included the origin and two calibrators. Imipramine-D3 was used as the internal standard for all TCAs except clomipramine, which required clomipramine-D3. Data for the limits, linearity, and carryover validation can be seen in Table 2. The lower limit of detection and quantitation was 100 ng/mL for all analytes. The MS screen reporting cut-off was set at 200 ng/mL for all analytes, which matched the confirmation cut-off but was lower than the EIA screen cut-off of 300 ng/mL. All analytes were present in the QC at 250 ng/mL. Carryover and the upper limit of linearity (ULOL) were established at 1000 ng/mL for amitriptyline, nortriptyline, doxepin, and cyclobenzaprine, and 20,000 ng/mL for imipramine, desipramine, and clomipramine. While no carryover was observed for amitriptyline, nortriptyline, doxepin, and cyclobenzaprine at 20,000 ng/mL, their accuracy at that concentration was poor, indicating that it would be hard to determine what samples should be flagged for carryover. Because this is a screening method, the loss of accurate quantitation at such a low concentration was not a concern as long as a positive result was still observed above that level. Requirements for passing validation were accuracy of the quantitation to be within ±25% and percent coefficient of variation (%CV) to be within ±15%; per this criteria, limits, linearity, and carryover validation passed.
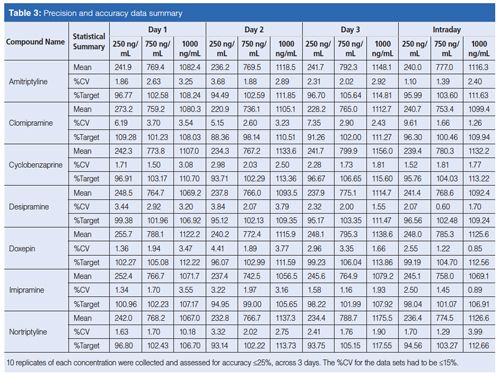
The same acceptance criterion of quantitation within ±25% and %CV to be within ±15% was still used when assessing the precision and accuracy validation data that can be seen in Table 3. A total of 10 replicates of 250 (QC), 750, and 1000 ng/mL concentrations were run over the course of 10 days. The passing of this validation experiment indicates the robustness and reproducibility of the developed method.
It was observed that the signal suppression because of matrix effect in the ROSPI screen method was considerably greater, ~2–3×, than the matrix effect observed in the confirmation method (see Table 4) where LC is used to help separate potential compounds that might interfere or create signal suppression. Although this observation was not surprising, it is important to note that the same limits of detection (LODs) and quantitation were achievable in both methods.
Compounds that were tested as possible interferents can be found in Table 1. There were no observed interferences from these compounds that would lead to a potential false positive result. However, it was observed that when high concentrations of methadone (50,000 ng/mL) were present along with the TCAs at the 100 ng/mL concentration, they were significantly suppressed, which led to a bias greater than -25%. When methadone at 50,000 ng/mL was tested at the cut-off concentration of 200 ng/mL, the signal suppression did not create a significant bias from the target concentration. Clomipramine displayed significant signal suppression in the presence of all interferent compounds tested; as well as the other TCAs and some unknown compound present in urine did display positive interference that resulted in signals <1/2 the response of the LOD. A rule was instated for clomipramine that any patient with a prescription for clomipramine would be sent to confirmation regardless of the ROSPI screen result.
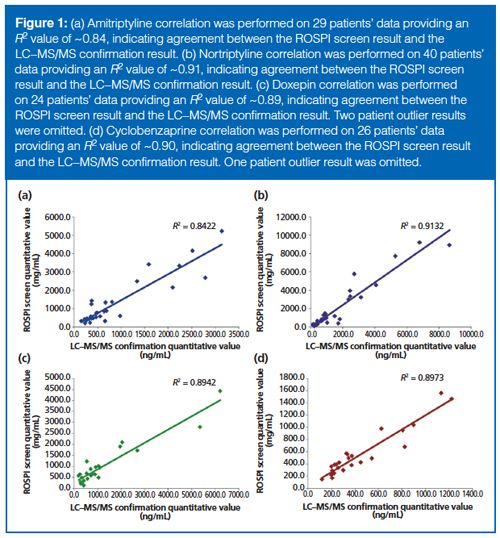
The last proof-of-concept data considered came from a patient comparison study that included 224 authentic patient samples. There were two different assessments of these data: comparing ROSPI to the MS confirmation method and comparing ROSPI to EIA. To compare ROSPI to the MS confirmation method, a correlation of quantitative results between the methods were examined, which is displayed in Figure 1. Only amitriptyline (Figure 1[a]), nortriptyline (Figure 1[b]), doxepin (Figure 1[c]), and cyclobenzaprine (Figure 1[d]) had enough patient positives to make the correlation meaningful. Overall, correlation was better than 80% for all four analytes. No meaningful correlation was observed when comparing EIA test results to the MS confirmation method results (data not shown). This high correlation between ROSPI and confirmation indicates that the method should be successful in determining positive and negative results.
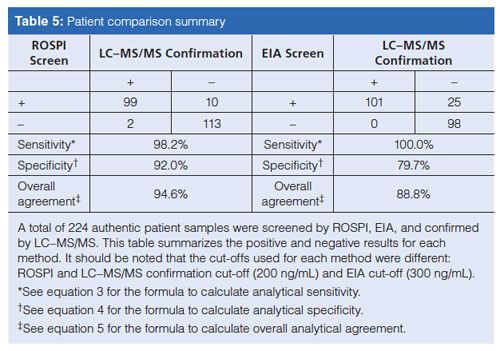
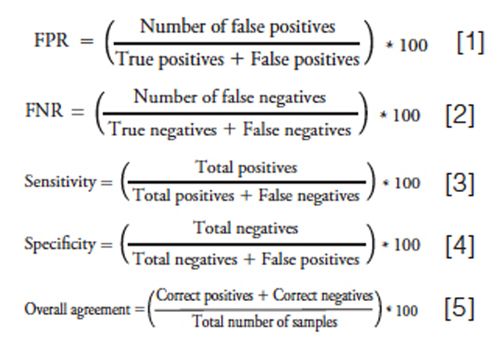
The patient data from the ROSPI and EIA screens were compared to the LC–MS/MS confirmation data to better understand the merits for each screen. It should be noted when assessing the data that the ROSPI screen method cut-off value of 200 ng/mL was less than the cutâoff value of 300 ng/mL used for EIA, but equivalent to the MS confirmation cut-off of 200 ng/mL. The ROSPI screen value was lowered to match the MS confirmation reporting cut-off value to reduce the probability of a false negative because of the high patient correlation data. A summary of the ROSPI and EIA comparison data can be seen in Table 5. It should be noted that the statistical data described and discussed here, while typically used in a clinical setting for describing disease states was found useful in this analytical setting to better understand the utility of each screen. Any result described as “true” is based on the LC–MS/MS confirmation result not the clinical or prescription relevance. The ROSPI screen false positive rate (FPR) (equation 1) was 9.2% compared to the EIA screen of 19.8%. However, the false negative rate (FNR) (equation 2) of the ROSPI screen at 1.7% is slightly worse than the 0% FNR observed for EIA, but it is still low enough to be considered acceptable. Although the FNR leads to a slight decrease in the sensitivity (equation 3) of the ROSPI screen method (98.2%) compared to the EIA method (100%), the specificity (equation 4) of ROSPI at 92.0% is better than EIA at 79.7%. The overall agreement of results (equation 5) for ROSPI is higher at 94.6% than the EIA at 88.8%, which is because of the increase in specificity and decrease in screen false positives.
Conclusion
The cycle time of ROSPI methods is critically dependent upon the speed of the autosampler. ROSPI’s cycle time of ~1.5 min/sample is time efficient enough to be competitive with EIA (~20 s/sample with an additional 30 min incubation) for smaller volume assays (<500 test/day). Furthermore, at an estimated cost of $0.22/sample (based primarily on cost of cartridge with 1000 injections and solvents), ROSPI is a cost-efficient screening alternative. ROSPI also demonstrates that it can increase the selectivity of the screen leading to a decrease in the false positive rate over EIAs that have poor selectivity indicated by the higher false positive rate. In the case of TCAs, the overall number of false positives was reduced by ~50%, which correlated to a specificity increase from 79.7% for EIA to 92.0% for ROSPI. Since ROSPI methodology is more similar to LC–MS/MS confirmation methodology than EIA, a cut-off closer to or the same as the LC–MS/MS confirmation is needed to reduce the probability of false negatives that can lead to a slight decrease in the sensitivity of the screen, as shown here where it decreased to 98.2% in ROSPI from 100.0% in EIA. Overall, ROSPI is a viable screening alternative to EIA as applied to TCAs. Ultimately, ROSPI is completed on the same instrumentation as LC–MS/MS confirmations, thus making a
screen–presumptive test possible without further capital investment.
References
- J. Biederman, R.J. Baldessarini, V. Wright, D. Knee, and J.S. Harmatz, Journal of the American Academy of Child & Adolescent Psychiatry28(5), 777–784 (1989).
- H.J. McQuay, M. Tramér, B.A. Nye, D. Carroll, P.J. Wiffen, and R.A. Moore, Pain 68, 2–3 (1996).
- J.A. Micó, D. Ardid, E. Berrocoso, and A. Eschalier, Trends Pharmacol. Sci.27(7), 348–354 (2006).
- K.E. Moeller, K.C. Lee, and J.C. Kissack, Mayo Clinic Proceedings 83(1), 66–76 (2008).
- M.S. Petrie, K.L. Lynch, A.H. Wu, A.A. Steinhardt, and G.L. Horowitz, Clinical Chemistry58(12), 1631–1634 (2012).
- E.C. Vincent, A. Zebelman, and C. Goodwin, Clinical Inquiries55(10), 893–897 (2006).
- L. Manchikanti, Y. Malla, B.W. Wargo, and B. Fellows, Pain Physician14,175–187 (2011).
- D.J. Dietzen, K. Ecos, D. Friedman, and S. Beason, J. Anal. Toxicol.25, 174–178 (2001).
- A.K. Quercia, W.A. LaMarr, J. Myung, C.C. Ozbal, J.A. Landro, and K.J. Lumb, J. Biomol. Screen. 12, 473–80 (2007).
- W. Jian, M.V. Romm, R.W. Edom, V.P. Miller, W.A. LaMarr, and N. Weng, Anal. Chem. 83, 8259–66 (2011).
- N.R. Parikh, M. Romm, and V.P. Miller, Spectroscopy Europe25, 15–17 (2013).
- J.C. Hitchcock, J.R. Enders, A.A. Morris, and G.L. McIntire, Current Trends in Mass Spectrometry13(2), 8–15 (2015).
- J.P. Smith, M. Romm, J.C. Hitchcock, and G.L. McIntire, “An Ultrafast Online SPE-TOF Urine Drug Screen for 35 Analytes in a Common Medication Indicated (CMI) Panel,” presented at the MSACL 2014 US, 6th Annual Conference and Exhibits, 2014.
- J.C. Hitchcock, A.A. Morris, and G.L. McIntire, “Development of an Ultrafast Screen for Synthetic Cannabinoids Using a RapidFire-MS/MS System,” presented at the 62nd Conference on Mass Spectrometry and Allied Topics, 2014.
- J.C. Hitchcock, J.R. Enders, A.A. Morris, G.L. McIntire, “Highly Automated SPE/MS/MS Analysis of Gabapentin and Pregabalin in Urine,” presented at the Society of Forensic Toxicologists 2013 Conference. Poster Presentation.
- J.C. Hitchcock, J.P. Smith, J.R. Enders, and G.L. McIntire, “Cross-Platform Comparison of Rapid Benzodiazepine Analyses,” presented at the Society of Forensic Toxicologists 2014 Conference.
- J.G. Swales, R.T. Gallagher, M. Denn, and R.M. Peter, J. Pharm. Biomed. Anal.55, 544–551 (2011).
- O. Heudi, S. Barteau, P. Picard, P. Tremblay, F. Picard, and O. Kretz, J. Pharm. Biomed. Anal.54, 1088–1095 (2011).
- D.P. Mohapatra, S.K. Brar, R.D. Tyagi, P. Picard, and R.Y. Surampalli, Talanta99, 247–255 (2012).
- T.M. Vail, P.R. Jones, and O.D. Sparkman, J. Anal. Toxicol.31, 304–312 (2007).
- Y. Zhao, M. Lam, D. Wu, and R. Mak, Rapid Commun. Mass Spectrom. 22, 3217–2324 (2008).
- E. Jagerdeo and M. Abdel-Rehim, J. Am. Soc. Mass Spectrom.20, 891–899 (2009).
- A.J. Dane and R.B. Cody, Analyst135, 696–699 (2010).
- E.S. Chernetsova, P.O. Bochkov, M.V. Ovcharov, S.S. Zhokhov, and R.A. Abramovich, Drug Testing and Analysis2, 292–294 (2010).
- J.M. Nilles, T.R. Connell, S.T. Stokes, and H.D. Durst, Propellants, Explosives, Pyrotechnics35, 446–451 (2010).
- W.C. Samms, Y.J. Jiang, M.D. Dixon, S.S. Houck, and A. Mozayani, J. Forensic Sci.56, 993–998 (2011).
- Z. Takats, J.M. Wiseman, B. Gologan, and R.G. Cooks, Science306, 471–473 (2004).
- H. Chen, N.N. Talaty, Z. Takats, and R.G. Cooks, Anal. Chem.77, 6915–6927 (2005).
- J.P. Williams and J.H. Scrivens, Rapid Commun. Mass Spectrom.19, 3643–3650 (2005).
- S.E. Rodriguez-Cruz, Rapid Commun. Mass Spectrom. 20, 53–60 (2006).
- T.J. Kauppila, J.M. Wiseman, R.A. Ketola, T. Kotiaho, R.G. Cooks, and R. Kostiainen, Rapid Commun. Mass Spectrom. 20, 387–392 (2006).
- J.M. Wiseman, C.A. Evans, C.L. Bowen, and J.H. Kennedy, Analyst 135, 720–725 (2010).
- E.C. Strickland, I. Shapiro, and G.L. McIntire, Current Trends in Mass Spectrometry13(1), 22–27 (2015).
Erin C. Strickland is the Principal Research & Development Scientist at Ameritox, LLC. Her recent work has focused on rapid sample analysis, large drug testing panels, and accurate mass applications, including use in forensic drug analyses. Dr. Strickland is a winner of the 2016 SOFT Young Scientist Meeting Award.
Oneka T. Cummings joined Ameritox, LLC, in 2014 with a background in computational chemistry and mathematics. As a Research and Development Scientist her main focus includes developing and enhancing LC–MS/MS methods to analyze human urine specimens and conducting statistical analysis on large subsets of patient medication data.
Gregory L. McIntire is the Vice President of Research and Development at Ameritox, LLC, and oversees the management of new method development for medication testing in human urine and oral fluids from inception through validation and verification, and finally to launch into a routine analysis environment. His interests include rapid analysis, data modelling using “Big Data,” and novel measurement technologies.
“MS-The Practical Art” Editor Kate Yu joined Waters in Milford, Massachusetts, USA, in 1998. She has a wealth of experience in applying LC–MS technologies to various application fields such as metabolite identification, metabolomics, quantitative bioanalysis, natural products, and environmental applications.

Evaluating Body Odor Sampling Phases Prior to Analysis
April 23rd 2025Researchers leveraged the advantages of thermodesorption, followed by comprehensive two-dimensional gas chromatography coupled to time-of-flight mass spectrometry (GC×GC/TOF-MS), to compare and assess a variety of sampling phases for body odor.

.png&w=3840&q=75)

.png&w=3840&q=75)


.png&w=3840&q=75)


.png&w=3840&q=75)


