On-line Monitoring of Atmospheric Inorganic Gases and Aerosols in the Southeastern and Northwestern U.S.
The Application Notebook
Metrohm International
Atmospheric aerosols exert a large but uncertain negative (cooling) radiative forcing on regional climate. Their chemical composition affects this climate forcing via aerosol hydroscopicity and consequential cloud interactions, as well as providing clues to the chemical origins of the aerosol. A Metrohm Monitor for AeRosol and GAses in ambient air (MARGA) instrument was used in summer 2013 as part of the Southeastern Oxidant and Aerosol Study (SOAS), a large field campaign that took place in Centerville, Alabama, USA. MARGA was used to measure the inorganic composition of aerosols and the key gases (HNO3, NH3, SO2) in equilibrium with each aerosol, enabling elucidation of aerosol composition and inferences about origin. The data from this summer field study are compared to data collected in the Pacific Northwest in autumn 2013, a comparison which helps to isolate the roles of varying regional SO2 sources, humidity, and temperature on aerosol composition and loading.
Atmospheric aerosols are key players in the global climate system, but formation mechanisms remain poorly understood. Over the southeastern US, temperatures have not warmed as substantially as the rest of the United States, an observation that is widely believed to be a consequence of regional cooling because of increasing aerosol concentrations (1). The provenance of these aerosols is unknown, but they are understood to arise from a combination of natural and anthropogenic emissions (2). The chemical composition of aerosols provides clues to the formation mechanisms, and the extent to which human activities control these concentrations.
The major chemical components of atmospheric aerosols are sulphates, nitrates, ammonium, hydrogen ions, organic material, sea salt, crustal dust, and water. Ammonium sulphate, ammonium nitrate, sulphuric acid, and a large fraction of the organic molecules arise typically from gas-to-particle conversion and exist primarily in the fine mode (< 1 μm diameter), while sea salt and crustal dust, including associated nitrate, and other biogenic organics (for example, pollen, plant fragments) occur predominantly in the coarse mode (> 1 μm). Water exchanges with all particle surfaces and can form a dominant fraction of volume under humid conditions.
Inorganic aerosols (NH4+, SO42-, NO3-, Cl-, and mineral cations) and associated gases can be used to assess the origin of aerosols. NH3(g) (and hence NH4+ aerosol) is indicative of an agricultural or animal husbandry source; SO2(g) (and hence SO42- aerosol) is prominent in coal-fired power plant plumes as a result of the sulfur content of coal; Cl- aerosol indicates an ocean source when associated with mineral cations present in the sea salt mass ratio of 28:3.4:1.1:1 for Na+, Mg2+, Ca2+, and K+, respectively (3), and NO3- can be present in coarse or fine mode aerosol, which is suggestive of different sources. Coarse mode nitrate can arise from mineral dust, associated with various mineral cations, or it can be a sea salt aerosol that has aged in a plume containing NOx, displacing Cl- with NO3- (4); fine-mode NO3-, typically present as NH4NO3, indicates NOx and its oxidation product HNO3 have been involved in the upwind chemistry. NOx and HNO3 are indicative of combustion sources, including stationary power plant sources and vehicle mobile sources, which are widely spread in any populous area.
The interpretation of aerosol inorganic nitrate is the most complex among inorganic ions, and the complementary cation measurements made in this study are essential to our interpretation. The origins of nitrate can best be interpreted with the aid of size distribution data and an assessment of counter-cations: NO3- in the sub-μm aerosol is most likely secondary NH4NO3, which can be confirmed by measuring the cation/anion balance to ascertain that excess NH4+ exists after all SO42- has been neutralized. In contrast, coarse-mode NO3- (some of which can extend below 1 μm diameter) associated with Na+ dominant cations is likely to be aged sea salt, while Ca2+ dominance among cations is suggestive of nitrate-aged mineral dust (4).
Materials and Methods
At the Centerville, Alabama, field site (SOAS campaign ground site [5]) and Portland, Oregon, site (Reed College, [6]), ambient air was drawn through a PM10 cyclone (Teflon coated, URG) approximately 4 metres above ground level at a flow rate of 16.7 standard litres per min (slpm). The sample air flowed through 196 cm length of 1 1/16 inch (2.70 cm) inner diameter Teflon-coated aluminum tubing at ambient temperature, then through a PM2.5 cyclone (Teflon coated, URG) and a further 147 cm length of 3/8 inch (0.95 cm) inner diameter polyethylene tubing at shelter temperature, giving a total inlet volume of 1224 cm3 and residence time of 4.4 s, before reaching the sampling box. At the Portland, Oregon, site (Reed College, [6]), a similar inlet scheme was employed. Air is drawn through the PM10 cyclone followed by 3 m of Teflon coated aluminum tubing (2.7 cm inner diameter), before intake to the PM2.5 cyclone. This is followed by a longer 990 cm length of 3/8 inch PE tubing extending from the outdoor intake to the instrument inside the lab.
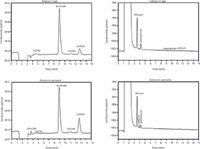
The air then enters a rotating gas-phase diffusion separator (denuder) where gases and aerosols are separated from one another: Gases (NH4+, SOx, NOx, HCl) are absorbed in a thin layer of water containing 10 ppm H2O2 for the oxidation of SO2 to SO42-. Afterwards, the solution is sent to the ion chromatograph for determination of the anions and cations. The aerosols continue to the Steam-Jet Aerosol Collector (SJAC). Here, they strike a supersaturated steam phase and, as condensation seeds, absorb an increasing amount of water. As a result, the particles grow, allowing them to be separated out mechanically in a glass spiral. The resulting solution is collected, and its anion and cation contents are determined by the integral ion chromatograph. Each column was equipped with ion conductivity detectors. LiBr was used as the internal standard. Figure 1 shows the respective anion and cation chromatograms for the gas and the aerosol fractions.

Figure 1: Anion and cation chromatograms of the gas and aerosol fractions from Centerville, Alabama, USA, during SOAS study. Anions, column: Metrosep A Supp 10 - 75/4.0; eluent: 7 mol/L Na2CO3, 8 mmol/L NaHCO3, 0.7 mL/min; column temperature: 25 °C, injection volume: 250 μL. Cations, column: Metrosep C 4 - 100/4.0; eluent: 3.2 mmol HNO3, 0.7 mL/min, column temperature: 42 °C, injection volume: 500 μL.
Results
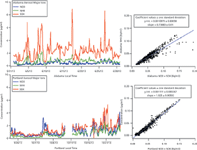
Figure 2 shows a representative month of major ion composition data for both rural Alabama (top) and urban Portland (bottom) field sites. The Alabama site shows greater concentration of sulphate, the result of greater regional use of coal-fired power plants, which emit substantial SO2 gas. The nearest coal-fired power plant to this site is Alabama Power Miller Steam Plant, 80 km to the northeast, and is among several others in the near vicinity. By contrast, in Portland, the aerosol nitrate concentration is higher, deriving from the wide range of combustion sources prevalent in this urban environment: vehicle emissions and home fireplace heating (increasing over the month shown as outdoor temperatures dropped). The nearest coal-fired power plants are 150 km to the north (Centralia Big Hanaford power plant in Centralia, Washington) and 250 km to the east (Boardman Coal Plant in Boardman, Oregon). However, much of the electrical power in the region is derived from non-coal sources (for example, hydroelectric and wind), resulting in lower regional airborne SO2, despite the more than 4 times larger population density.

Figure 2: Major inorganic ions (nitrate, ammonium, and sulphate) observed during 1 month of hourly data collection in Centreville, Alabama, USA, (top, Summer 2013) and Portland, Oregon, USA (bottom, Autumn 2013). On the right is shown the overall major ion balance for each site, with ammonium cation equivalents plotted vs. nitrate and sulphate anion equivalents (accounting for the 2- charge of sulphate), with a slope of 0.74 for Alabama and 1.03 for Portland.
Ammonium cation concentration is slightly higher in Portland than in Alabama, resulting in a different overall major ion balance at the two sites, as shown in the right hand panels of Figure 2. This shows that while in Portland, NH4+ neutralizes all of the NO3- and SO42-, in Alabama, the NO3- and SO42- are not completely neutralized by NH4+. This suggests that other cations are important in the aqueous aerosol at this site, and that the aerosol is overall acidic. When including all measured cations (NH4+, Na+, Mg2+, Ca2+, K+) in the ion equivalent balance plot, a slope of 0.85 is obtained. While this is closer to balanced, it is still below a slope of 1, implying an excess H+ concentration in the Alabama aerosol. We note that this higher acidity in Alabama may be facilitated by the higher overall liquid water content of aerosol in Alabama — under the high temperature (20–32 °C throughout campaign) and relative humidity (50–100%) conditions, this inorganic aerosol will deliquesce a large volume of water.
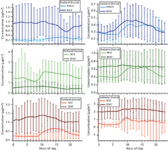
The measurements made at each site include the related gas-phase species SO2, NH3, and HNO3. Because these are understood to be the sources of, or in exchange with, aerosol SO42-, NH4+, and NO3-, the ratio of gas and aerosol phase of these can help elucidate aerosol age. Furthermore, we have plotted the average diurnal time series of these species to investigate differences between the sites (Figure 3).

Figure 3: Average diurnal cycles of both gas- and aerosol-phase nitrate, ammonia, and sulphate for (left) Portland and (right) Alabama sites.
In Portland, nitrate is primarily in the aerosol phase throughout the day, while in Alabama, a daytime increase in HNO3 is mirrored in the aerosol phase, suggesting active partitioning between the two. The strong aerosol partitioning of nitrate in Portland may be in part a result of the excess ammonium available to neutralize NO3-, driven by higher gas-phase NH3 (in contrast to Alabama's greater concentration of NH4+ to NH3). Sulphate concentration is higher in the aerosol phase than in the gas phase at both sites, and roughly constant over the daily cycle, but because of the substantial number of brief, high-concentration plumes visible in Figure 2, the error bars on this diurnal average are large.
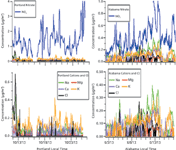
Nitrate can be present in the aerosol as NH4NO3, or as mineral nitrates (NaNO3, Ca(NO3)2, etc.), which can arise from ageing of sea salt or mineral dust aerosol. Sodium is more characteristic of sea salt, while calcium and potassium are more abundant in mineral dust. Figure 4 presents representative periods of nitrate measurements at each site, showing the cation counterions and Cl- accompanying this nitrate. In Portland, few other cations accompany nitrate. When elevated Na+ appears, it correlates to a rise in Cl-, suggesting that Na+ is present as low-aged sea salt aerosol. This supports the theory that at this site, where the aerosol is observed to be completely neutralized, nitrate exists almost exclusively as NH4NO3.

Figure 4: Zoom-in on two weeks of representative NO3- data from each site (top), with a detailed view of cation counterions as well as Cl- to aid in sea salt identification (bottom).
In Alabama, by contrast, the period of elevated nitrate around 9–14 June is characterized by higher concentrations of Na+, K+, and Ca2+, with little Cl-. The cations persist for several days, but exhibit a diurnal pattern tracking well with nitrate. This suggests a period of transport from a region sourcing these cations. Because the cation ratio does not match bulk sea salt, during these periods nitrate most likely originates from mineral dust. Most dust aerosol is expected to be removed by the PM2.5 cyclone; however, this observation suggests that a "tail" of the super-μm coarse mode extends to particles below 2.5 μm in diameter. Hence, coarse aerosol at this site likely includes substantial nitrate mass above 2.5 μm during this period, which was not captured by the MARGA measurement.
Implications
Future analysis will include investigation of air mass back-trajectories to bolster this assessment of nitrate sources, as well as thermodynamic modelling of the complete inorganic composition and partitioning. This partitioning model will be well constrained, because both gas and aerosol phases of many of the key inorganic species have been measured.
The MARGA's wide array of multiple inorganic ion analytes makes it an invaluable tool for assessing aerosol composition, helping to elucidate chemical sources and particle hydroscopicity, both key parameters for understanding the climate impact of aerosols.
References
(1) R.W. Portmann, S. Solomon, and G.C. Hegerl, Proceedings of the National Academy of Sciences of the United States of America 106(18), 7324–7329 (2009).
(2) A.H. Goldstein et al., Proceedings of the National Academy of Sciences of the United States of America 106(22), 8835–8840 (2009).
(3) M.J. Kennish, Ed., Practical Handbook of Marine Science (CRC Press, Boca Raton, Florida, USA) 3rd edition.
(4) T.L. Lee, X.-Y. Yua, B. Ayres, S.M. Kreidenweis, W.C. Malm, and J.L Collett, Atmospheric Environment 42, 2720–2732 (2008).
(5) http://www.epa.gov/airscience/southern-oxidant-aerosol-study.htm
(6) http://academic.reed.edu/chemistry/fry/research.html

Metrohm International Headquarters
Ionenstrasse, 9101 Herisau, Switzerland
Tel: +41 71 353 85 04
Website: www.metrohm.com


.png&w=3840&q=75)

.png&w=3840&q=75)


.png&w=3840&q=75)


.png&w=3840&q=75)


