Inaccuracies in the Quantification of Peptides — A Case Study Using β-Endorphin Assay
LCGC Europe
This article describes possible sources of error that may contribute to significant inaccuracy in peptide assay methods: The fi ltration material (cellulose) used in sample clean up and the vial material (glass and plastic) used in LC analysis. This study is based on ?-endorphin but has relevance for most peptide assays.
This article describes two possible sources of errors that may both contribute to significant inaccuracy in peptide assay methods: The filtration material (cellulose) used in sample clean up and the vial material (glass and plastic) used in liquid chromatographic (LC) analysis. This study is based on β-endorphin but has relevance for most peptide assays.
In recent years, significant attention has been paid to the use of peptides as therapeutic agents and this trend is expected to continue (1,2). Because of their wide-ranging activities in many physiological processes, such as acting as signalling molecules and growth factors, peptides play a substantial role as therapeutic mediators, especially in the areas of neurology, endocrinology, and haematology (3,4). Even though peptides have been shown to be promising therapeutics for many disease conditions, developing them as drugs is a challenging process. Accurate quantification of peptides is one of these challenges; poor stability, losses during manufacturing and delivery process, and high cost are other issues (4–6). Incorrect quantification of peptides may lead to false conclusions in research and may also adversely affect the dosage that is prescribed for patients.

Quantification methods may vary depending on the nature of the sample and the analytical instruments used. If the analyte is extracted from a natural source or biological matrix, sample purification is required before chemical analysis to remove molecules that may interfere with the analytical method or have detrimental effects on the instrumentation. Various sample preparation methods such as solvent extraction, ultrafiltration, and precipitation are commonly applied to biological samples. Analyte loss during these processes can be significant. Ultrafiltration devices are commonly used for the separation of small peptides from proteins and other larger molecules. If the peptide is insufficiently stable to withstand acid precipitation followed by solvent evaporation, ultrafiltration may then be the only option for sample purification. However, the range of filter materials available have variable adsorption affinities toward different peptides (7). Although internal standards are often used to correct for sample preparation losses, if the internal standard molecule is not sufficiently physicochemically similar to the analyte molecule then inaccuracies because of losses will not be fully corrected.
The adsorption of peptides to container materials during the manufacturing process and subsequent storage is well-known (7,8). However, adsorption during analytical processes has been given scant attention. Even though the analysis time is relatively short, the adsorption of peptides to sample vials during analysis may be a significant source of error. As liquid chromatography (LC) analysis is routinely accomplished using autosamplers containing a large number of samples and standards, the contact time of the analyte with the container may be sufficiently long to be problematic. The aim of this study was to investigate the significance of the inaccuracy in peptide quantification caused by adsorption during the ultrafiltration and chromatographic analysis procedures. Two different types of limited volume inserts (LVIs) commonly used in LC vials, plastic (polypropylene) and glass, were used to evaluate the effect of sample vials during LC analysis. Commonly used microcentrifugal ultrafiltration devices (10 kDa cut off) constructed from cellulose were evaluated for the effect of the sample preparation step. β-Endorphin (β-END [1-31]) was quantified using liquid chromatography–mass spectrometry (LC–MS).
Experimental
β-END (1-31)–human was purchased from Sigma, USA, and β-END (1-31)-rat was purchased from Auspep Pty Ltd. Australia. An Agilent Technologies high-performance liquid chromatography (HPLC) system consisting of an Agilent 1100 LC pump and an Agilent 1100 well-plate autosampler with a 150 mm × 2.00 mm, 5-µm dp Jupiter C4 (300 Å) reversed-phase HPLC column (Phenomenex) were used for separations. A binary solvent gradient consisting of water 0.1% (v/v) formic acid in MilliQ (Millipore Corporation) water (solvent A) and 0.1% (v/v) formic acid in acetonitrile (solvent B) was used for all separations. An API 3000 tandem mass spectrometer equipped with a turbo ion spray interface and supported by Analyst 1.5 software (Applied Biosystems) were used for mass spectrometric detection in multiple reaction monitoring (MRM) mode. The 694/136 pair (5+ charged endorphin molecular ion and fragment) was used for MRM detection of β-END (1-31).
To test peptide adsorption on filter material, a solution containing β-END (1-31)–rat (10 µM) in Milli-Q water was filtered through the Microcon centrifugal devices (Millipore Corporation) using the recommended centrifugal force of 12,500 at 25 °C for 10 min. The filtered sample was transferred to a plastic limited volume insert and injected onto the LC column. Triplicate analyses were performed using LC–MS (MRM mode). The gradient used for this study started at 0% B and increased to 5% B during the first 4 min, then to 70% B during the next 1 min. The mobile-phase composition was maintained at 70% B composition for 5 min and then returned to 0% B during the next 2 min. The column was re-equilibrated with 0% B for 10 min before the next injection. Quantification was performed using the peak areas. The same experiment was repeated in triplicate without the filtering step.
To test peptide adsorption on LC LVIs, a solution containing β-END (1-31)–rat (0.5 µM) and β-END (1-31)–human (0.5 µM) in Milli-Q water was prepared. Immediately following sample preparation, the solution was transferred to a glass LVI and injections were made at 53-min intervals (run time for each injection) for 6 h and analysed by the LC–MS (MRM mode). During the experiment, the sample was maintained at 10 °C in the autosampler. The gradient started with 0% B for the first 3 min and changed to 50% B over the next 30 min. The mobile-phase composition was then changed to 100% B within the next 5 min and maintained for 2 min. It was then returned to 0% B within the next 3 min and the column was re-equilibrated for 10 min before the next injection. Quantification was performed using the peak areas. The same experiment was repeated using a plastic (polypropylene) LVI in place of glass inserts.
Results and Discussion
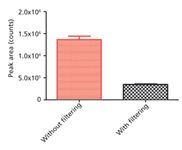
The loss of β-END (1-31)–rat during the filtering process was significant. Figure 1 shows a dramatic loss of β-END after passing through the cellulose filter. A significant amount of β-END was retained on the filter because of adsorption during the 10-min filtration process. This adsorption on cellulose possibly results from the highly (positive) charged nature of the β-END molecule. The commercially available 10-kDa cut-off filters are usually cellulose in nature. If these filters are used for β-endorphin, a close structural analogue needs to be used as the internal standard to correct for peptide adsorption behaviour. The suitability of the chosen internal standard must be confirmed using both the analyte and the internal standard in the same solution. If multiple peptides are analysed from the same sample, each peptide must accompany its closely analogous internal standard. However, it is likely that negatively charged or less hydrophilic peptides will not be adsorbed on cellulose filters. The filtration step should be tested with each peptide to ensure the accuracy of the method. Although measures could be taken to test and correct for peptide losses in quantitative analysis of known peptides, in a metabolomics type assay where the emphasis is on all peptides present in the sample, this adsorption on filters can be a severe problem. Peptides that are not detected can be considered absent in the sample when in fact they were adsorbed onto the filter. In such studies, it is best to use an alternative sample cleanup or precipitation method.

Figure 1: Adsorption of β-END (1-31)ârat onto ultrafiltration device. The bar chart shows the mean difference in triplicate peak areas along with the error bars.
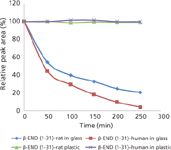
The gradient used for the second part of this study was developed to study the metabolic degradation of β-END (1-31) (9), therefore a slow gradient was used to accommodate all metabolic products of β-END (1-31). In this case, only β-END (1-31) was monitored as peak area. Peak area at zero time point was used as the reference to calculate the percent relative peak areas as shown in Figure 2. Figure 2 shows a significant loss of both human and rat β-END (1-31) over a 6-h period in glass inserts. The sample loss because of adsorption was significant during the first hour indicating that exposure to glass, even for a short period, can cause a significant loss of β-END. Figure 2 also clearly demonstrates the stability of β-END (1-31) in polypropylene inserts. This data demonstrates the suitability of polypropylene vials to be used for β-END during the quantification process. As discussed above with filtration devices, these results may not hold true for hydrophobic peptides or negatively charged peptides. Although studies were done to test and correct for peptide losses during manufacturing and sample storage (7,8), it is not a generally held practice to check the suitability of sample holder material used in autosamplers during chromatographic analysis. Consequently, the sample loss resulting from adsorption such as in Figure 2 could be potentially misunderstood as degradation of the peptide over time. If the experiment concerns the time dependence of a treatment on the peptide concentration (such as half life of a peptide in an enzyme or kinetic study involving peptide metabolism) an erroneous conclusion will be reached if glass vials or LVIs were used to hold peptides such as β-END. A study of peptide degradation would apparently provide very different results when glass or plastic sample holders are used during analysis. In quantitative analysis, both samples and standards will give variable peak areas depending on the sample holding time in the autosampler. The analytical run time in this study was 53 min and, in glass LVIs, about 50% of the analyte was adsorbed onto the sample holder during that time.

Figure 2: Adsorption effects of β-END (1-31)ârat and β-END (1-31)âhuman to glass and plastic (polypropylene) limited volume inserts. Both peptides show significant adsorption to glass but no adsorption to polypropylene.
The adsorption of peptides to solid surfaces can be caused by many factors: The physical and chemical nature of the peptides and those of the solid surfaces, peptide conformation, hydrophobicity, and electrostatic charges (10–12). Also, experimental conditions such as ionic strength, pH of the solution, and analysis time may directly influence the degree of adsorption (10–12). In this study, the analyte used (β-endorphin) was a highly charged positive ion that can adsorb onto the silica surface of glass. Depending on the charge of the peptide, the degree of adsorption may vary. Unlike charged peptides, hydrophobic peptides may not adsorb on glass but may adsorb on plastic. Therefore, the choice of the sample holder is very important in chromatographic analysis of peptides.
Conclusion
β-END (1-31) adsorbs onto cellulose and glass, but not polypropylene. The potential error resulting from adsorption was shown to range from significant to severe. Analysts are warned to carefully select filters and autosampler vials depending on the physical and chemical nature of the peptides and those of the vial material. The use of vials made of an interfering material can produce misleading results in kinetic and metabolic studies involving peptides. However, the detrimental effects of these adsorption problems on metabolomics studies that target the complete metabolomics profile will remain undetected.
H.M.D.R. Herath, R.-R. Kim, P.J. Cabot, P.N. Shaw, and A.K. Hewavitharana are with the School of Pharmacy at The University of Queensland in Brisbane, Australia.
References
(1) "Development Trends for Peptide Therapeutics," http://www.peptidetherapeutics.org/PTF_report_summary_2010.pdf.
(2) R. Lax, PharManufacturing: The International Peptide Review. http://www.polypeptide.com/assets/002/5188.pdf.
(3) B. Groner, "Peptides as Drugs: Discovery and Development," http://www.wiley-vch.de/books/sample/3527322051_c01.pdf.
(4) P. Dulal, Biotechnology Society of Nepal. 2 (2010). http://bsnbiotech.files.wordpress.com/2010/10/bsnebulletin_vol2_2.pdf.
(5) C.H. Niu and Y.Y. Chiu, J. Pharm. Sci. 87(11), 1331–1334 (1998).
(6) M.R. Duncan, J.M. Lee, and M.P. Warcho, Int. J. Pharm. 120, 179–188 (1995).
(7) P.J.M. Van den Oetelaar, I.M. Mentink, and G.J. Brinks, Drug Dev. Ind. Pharm. 15, 97–106 (1989).
(8) C.J. Burke, B.L. Steadman, D.B. Volkin, P.K. Tsai, M.W. Bruner, and C.R. Middaugh, Int. J. Pharm. 86, 89–93 (1992).
(9) H.M.D.R. Herath, P.J. Cabot, P.N. Shaw, and A.K. Hewavitharana, Anal. Bioanal. Chem. 402, 2089–2100 (2012).
(10) A. Pezeshki, V. Vergote, S.V. Dorpe, B. Baert, C. Burvenich, A. Popkov, and B. De Spiegeleer, J. Pharm. Biomed. Anal. 49, 607–612 (2009).
(11) V. Hlady and J. Buijs, Curr. Opin. Biotechnol. 7, 72–77 (1996).
(12) N.A. Draeger, "Adsorption of Protein onto a Solid Surface," http://www.bjorksten.com/files/protein.pdf.

New Study Reviews Chromatography Methods for Flavonoid Analysis
April 21st 2025Flavonoids are widely used metabolites that carry out various functions in different industries, such as food and cosmetics. Detecting, separating, and quantifying them in fruit species can be a complicated process.
Extracting Estrogenic Hormones Using Rotating Disk and Modified Clays
April 14th 2025University of Caldas and University of Chile researchers extracted estrogenic hormones from wastewater samples using rotating disk sorption extraction. After extraction, the concentrated analytes were measured using liquid chromatography coupled with photodiode array detection (HPLC-PDA).

.png&w=3840&q=75)

.png&w=3840&q=75)


.png&w=3840&q=75)


.png&w=3840&q=75)


