Getting the Most Out of Calibration Standards
LCGC North America
In this month's "LC Troubleshooting," the authors look at another use of calibration standards: to monitor the quality of the data, with a goal toward helping scientists troubleshoot instrument problems.
Normally we use the calibration standards in a liquid chromatography (LC) method as a tool for quantitative analysis so that we can measure the concentration of an analyte in our samples. In this month's "LC Troubleshooting," we'll look at another use of the standards — to monitor the quality of the data, with a goal toward helping us in troubleshooting instrument problems.

John W. Dolan
As an example, we'll use a high-precision method, such as might be encountered for a drug content method in the pharmaceutical industry or an active ingredient determination in a pesticide formulation. This kind of method is characterized by signal-to-noise ratios of >100 and peak area imprecision of ≤1% for several consecutive injections of the same sample. By examining a trend through a batch of samples or looking at individual outliers, we often can get enough information to help isolate the problem source to a particular module or submodule of the LC system.
Normal Data
As with most problems, it is difficult to determine if something is wrong unless we know the normal behavior of the system. For example, let's consider the behavior of the calibration standards for a batch of samples.
In this case, three different calibrators (STD A, B, and C) of nominally the same concentration were injected in duplicate followed by 6–10 samples in duplicate, then another set of standards, and so forth, finishing with a final set of standards. An example of the results for standards in a normal run is shown in Table I.
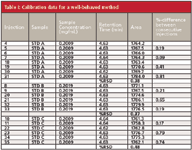
Table I: Calibration data for a well-behaved method
In Table I, we can see that the variability of peak area is very small, whether we examine the percent relative standard deviation (%RSD) for each calibrator over the entire run or compare the percent difference between consecutive injections. In all cases, the values are well below 1%. These data are typical for this method and will serve as our reference values for the problems discussed later.
Autosampler Problems
When the variability in peak area increases, the autosampler often is the first module to suspect. A good first step in troubleshooting is to make two or more injections from the same vial of the suspect sample or samples. If you normally inject duplicate calibrators from the same vial (a good idea), you will have this information as a normal part of the data set without having to go back and make special injections for troubleshooting purposes. If the variability in peak area is much larger than normal, this means that the same sample volume is not being injected each time, pointing to an autosampler problem. Check for obvious problems, such as a blocked or partially blocked autosampler needle, or insufficient sample. Once these sources are eliminated, look for mechanical problems with the autosampler.
Many people erroneously assume that fluctuating area counts or response factors are associated with only the injection valve; however, there is another part of the autosampler in addition to the injection valve that contributes to the precision of the data and is subject to wear and tear, as well: the sampling unit, the part of the system that withdraws sample from the vial and transfers it to the sample loop.
An example of problem data is shown in Table II. Here, a coworker's data shows mostly good agreement with area counts, with a few exceptions shown in bold italics. Notice that the occasional erratic peak areas throw off the %RSD values for the calibrator sets as well as the %-difference for the individual injection pairs. Understanding the functionality of the parts of the modules is crucial for troubleshooting. The injection valve directs flow to the column once the sampling unit has drawn the sample into the sample loop; therefore, if a cross-port leak was indeed the culprit, the data should show more variability than it does. The response would be less than normal as well, because a cross-port leak usually causes sample to leak into the waste stream. Hence, the injection valve was summarily dismissed as the problem, so we are left with the sampling unit as another potential problem source. Upon inspection of the instrument, it was discovered the metering drive, the part of the sampling unit that operates the sampling syringe, was loose. After tightening the bolts that hold the metering head in place, excellent precision was restored.
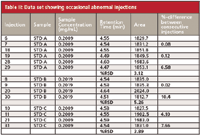
Table II: Data set showing occasional abnormal injections
Detector Problems
In this example, the method normally gave very small %RSD values for standards, usually ≤0.5%. However, we noticed a trend in the data shown in Table III, with the overall %RSD about twice that normally observed (compare with Table I). Notice that, although each pair of consecutive standards agrees closely with each other, the trend is to larger variation through the run. Because each pair of injected standards was consistent (only STD A is shown here for brevity), we did not suspect initially that the autosampler was the problem. Again, in our experience, autosampler problems tend to show random variations in area, whereas in this case, there is a trend over the run. We suspected that this was due to increased noise from a detector lamp that was failing.

Table III: Data showing higher-than-normal %RSD
The condition of the lamp was confirmed by three different observations. First, according to the lamp life meter, the lamp had logged more than 1000 h. Lamps typically last between 1000 and 2000 h. If the lamp has logged >1000 hours and other symptoms exist, it is prudent to change the lamp. Second, this method uses a detector wavelength of 205 nm; lower wavelengths are the first to fail the intensity test performed on the lamp. This particular lamp barely passed the intensity test in the 200–220 nm range, so it was replaced. The final convincing argument for a bad lamp was the drop in %RSD from 0.80 to 0.21 when a new lamp was installed (Table IV). In addition, increased baseline noise is a common symptom of a failing lamp, but often this occurs only after the earlier symptoms are noted; increased baseline noise was not observed in this case.
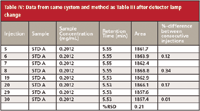
Table IV: Data from same system and method as Table III after detector lamp change
To avoid premature lamp replacement after being misled by a drift in precision, as in Table III, it is important to allow the lamp to warm up for 30–45 min before analysis. A simple way to convince yourself of this requirement is to equilibrate the column for a method and load standards into the autosampler tray. Turn on the detector and immediately start injecting. Then compare the variability of early injections to those after the lamp is fully warmed up.
An example of this is shown in Table V for a 15-min run. The column was equilibrated, and then the detector was turned on and injections were begun immediately. Although the %-difference in area between injections is abnormally high only for the first two injections, it can be seen that the overall %RSD improves if the first few injections are dropped. This is summarized at the bottom of Table V, where n = 13 is for all samples, n = 12 is for all samples except the first one, and so forth. There is a noticeable reduction in the %RSD when the first one or two samples are dropped; after that, the value settles down, which would suggest that a 30-min detector warm-up would be sufficient. However, note that for maximum performance in this example, if 1.5 h elapsed before data were used (starting with injection 7), the %RSD drops to <20% of what it was with all the injections included. And yes, this is one data set on one detector, so specific warm-up time recommendations are not possible for all detectors and methods, but the pattern is consistent: detector performance improves if adequate warm-up time is allowed.
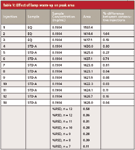
Table V: Effect of lamp warm-up on peak area
Pump Problems
The last example is for the same high precision method, but an unusually high variation of areas was observed when comparing the early and late runs for the standards (see Table VI). Note that the areas for runs 45, 65, 66, and 67 (bold italics) are approximately 8% larger than the other runs. Because this instrument had been serviced recently and the precision for subsequent runs was acceptable, the autosampler was ruled out as the most likely cause of the problem. When the data were examined more closely, it was noted that the retention times also changed in conjunction with the area counts. A close examination of the system showed that the tubing between the aqueous solvent reservoir and the pump was filled with bluish particulate matter. This was microbial growth resulting from a phosphate buffer that was allowed to sit idle on the LC for an extended period of time without flushing with fresh water. The tubing was disconnected from the pump and hot water was forcefully flushed through the tubing, including the tubing inside the in-line degasser. This water was collected and filtered through a 0.45-μm PTFE filter to collect the residue. The result is shown in Figure 1, where the rinse water residue is compared with the residue from filtering an equal volume of HPLC-grade water.

Table VI: Data obtained from contaminated LC system
There are at least three possible consequences of this contamination. First, the frit in the mobile phase reservoir could be blocked. Second, the proportioning valve on the low-pressure mixing manifold could be malfunctioning. Third, the check valves in the pump could stick as a result of this fouling. Each of these three possible results was considered in light of the symptoms. A blocked reservoir frit would restrict flow of the aqueous solvent to the mixer. Because a constant flow of mobile phase is pumped from the mixer, when the organic solvent valve opens, excess organic solvent is delivered to make up the shortfall of the aqueous solvent. This means that the concentration of organic solvent in the mobile phase would be higher than normal. This is an ion chromatography method, where the buffer is the strong solvent, so higher concentrations of buffer would reduce retention times. Without sufficient buffer reaching the column, the analyte would be retained more, consistent with the observations. The inlet filter was changed, given the amount of microbial growth found in the low pressure lines. Finally, a partially blocked or intermittently sticking check valve would result in a lower flow rate than normal, and this would increase the retention time as with the Table VI data. A good practice is to note the stability of the pump pressure while the system is equilibrating and during system suitability. The pressure should be steady, varying no more than 1–2 bar (15–30 psi). If the pressure varies more than this, either there is a bubble in the pump that needs to be removed, additional mobile phase degassing is needed, a check valve is sticking or leaking, or some other flow-related problem is present. It isn't clear in retrospect which possible problem source was the root cause of the problem, or perhaps if a combination of causes existed. It also is not immediately obvious why the peak areas changed as much as was observed. In any event, flushing the system to remove residual particulate matter, replacement of the inlet frit in the reservoir, and sonication of the check valves resulted in a restoration of the LC system to satisfactory operation.
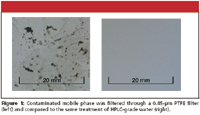
Figure 1
This example drives home a point that has been mentioned in this "LC Troubleshooting" column regularly over the last 25 years: Do not turn off the LC system with buffer in it! Sure, a few minutes won't hurt, but extended standing with buffers encourages evaporation of the liquid phase and formation of buffer crystals as well as microbial growth inside the system. A good habit is to replace the buffer once a week, although many laboratories will use buffer for two weeks without problems. And before you shut down the system, flush all the buffer lines with water. It is best never to reuse a buffer reservoir — use all the buffer, then replace the reservoir with a clean one. A used reservoir can inoculate the next batch of buffer with microorganisms contained in the last batch. If you find yourself in possession of a contaminated system, as was the case here, replacement of the tubing would be a good idea, and flushing with a dilute solution of chlorine bleach also would ensure that any microbial contaminants had been deactivated (obviously, you shouldn't pump bleach through the column!).
Conclusions
The examples cited this month illustrate several problems that were identified initially by studying the behavior of calibration standards after a sample batch was completed. In addition to calibration properties, these standards can serve as a powerful indicator of the health of the LC system. In each case, the symptoms pointed to a general part of the LC system. Further observation and interpretation of the data helped to isolate the problems so that they could be corrected.
Jennifer Birchett is an analytical chemist with Syngenta Crop Protection, Inc., Wilmington, Delaware. She is responsible for the development and validation of methods for herbicide products as well as the on-demand troubleshooting and repair of 30 departmental LC systems.
John W. Dolan "LC Troubleshooting" Editor John W. Dolan is Vice-President of LC Resources, Walnut Creek, California; and a member of LCGC's editorial advisory board. Direct correspondence about this column to "LC Troubleshooting," LCGC, Woodbridge Corporate Plaza, 485 Route 1 South, Building F, First Floor, Iselin, NJ 08830, e-mail John.Dolan@LCResources.com.
For an ongoing discussion of LC troubleshooting with John Dolan and other chromatographers, visit the Chromatography Forum discussion group at http://www.chromforum.org.

SPE-Based Method for Detecting Harmful Textile Residues
January 14th 2025University of Valencia scientists recently developed a method using solid-phase extraction (SPE) followed by high-performance liquid chromatography coupled to high-resolution mass spectrometry (HPLC–HRMS/MS) for detecting microplastics and other harmful substances in textiles.