Fast and Simple High Performance Liquid Chromatography–Ultraviolet Assay for the Determination of Cannabinoid Content in Hemp Oil
The Column
This article highlights the use of a fast and simple high performance liquid chromatography–ultraviolet (HPLC–UV) assay for separation and quantification of 11 important cannabinoids, including CBD in hemp oil.
The medicinal qualities of cannabinoids contained in hemp have been described in detail. Pain mitigation and reduced severity of nausea and seizures are just a few of the therapeutic benefits reported by medical cannabis patients. There is evidence that a combination of cannabidiol (CBD), a host of other minor cannabinoids, and a complex array of terpenoids as contained in hemp oil may be the most beneficial, which is why CBD-rich oil for oral intake has become increasingly popular. The FDA has issued warning letters to firms that market unapproved new drugs allegedly containing CBD. As part of these actions, the cannabinoid content of some hemp products was determined and many were found to contain levels of CBD largely deviating from the label claim. Like cannabis, hemp oil can be analyzed easily and effectively for its cannabinoid content. This article highlights the use of a fast and simple high performance liquid chromatography–ultraviolet (HPLC–UV) assay for separation and quantification of 11 important cannabinoids, including CBD in hemp oil.
The discussion about legalization of marijuana is a widespread and lively one with a wide range of contrary positions (1–3). While the controversy stems from the psychoactive effect of one of the contained cannabinoids, namely Δ9-tetrahydrocannabinol (d9-THC), the use of other phytocannabinoids in combination has also demonstrated promising results in chronic pain therapy. Efficacy in the treatment of multiple sclerosis, arthritis, and other inflammatory diseases has been indicated (4,5).
Pain mitigation and reduced severity of nausea and seizures are just a few of the therapeutic benefits reported. In addition, a large number of studies showed high safety with regard to a wide array of side effects, and no tolerance to cannabidiol (CBD) has so far been demonstrated (6). CBD-rich oil, extracted from the flowers, seeds, and roots of the plant, has therefore become increasingly popular and is administered via sublingual drops, gel capsules, or as a topical ointment.
The Farm Bill of 2014, an agricultural and food policy tool of the United States federal government, distinguishes hemp from marijuana, but interpreting the law is difficult since “CBD oil” may be classified as marijuana. However, there are clear definitions depicting the differences in marijuana, cannabis, and hemp (7).
While “cannabis” is the name of the plant itself, marijuana, in its correct use, refers only to the leaves and flowering portions of the plant that contain a wide array of cannabinoids, including more than 0.3% of the psychoactive compound THC. Hemp on the other hand describes the sterilized seeds, stems, stalks, and roots of cannabis plants with more than 0.3% THC. Therefore, the CBD oil produced from these seeds and roots exhibits therapeutic benefits without the mind-altering “high” produced by THC (8).
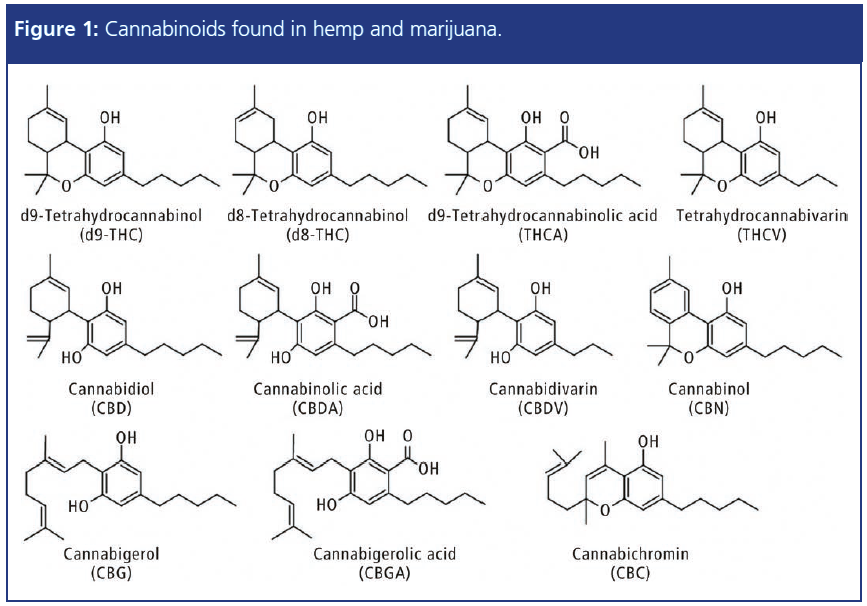
This article describes the application of a fast and simple high performance liquid chromatography–ultraviolet (HPLC–UV) screening test for the separation and quantification of11 important cannabinoids (Figure 1) in hemp oil, for quality control with regard to the label claim of CBD as well as THC content
Experimental
HPLC–UV Analysis: A high sensitivity HPLC method was used to create standard curves for each of the 11 cannabinoids under investigation, with a minimum acceptable correlation coefficient (R2) of 0.999 over six standard levels. A Prominence-i HPLC system from Shimadzu equipped with a UV detector was used for analysis. A linear dynamic range was established at 0.5 to 100 mg/L (ppm) for each analyte. Gradient elution conditions with acid modified water and acetonitrile were employed with a C18 column chemistry to achieve separation in under 10 min.
Sample Preparation: Hemp oils are typically rich in CBD, with relatively minor concentrations of other cannabinoids. Two dilution factors were used to ensure quantitation within the calibration range. One dilution factor yielded appropriate detector sensitivity to the array of minor cannabinoids. A second, higher dilution factor was applied for the most accurate quantitation of the major component CBD, so that its response was within the linear range determined for that analyte. In practice, it was found that the two approaches yielded quantitative values for CBD that agreed within 0.2%.
For determination of total cannabinoid content (sample A), 400 μL of isopropanol was pipetted into a 2-mL glass vial, followed by 10 μL hemp oil sample. The mixture was agitated for 30 s until the oil sample was completely dissolved. A 400-μL measure of methanol was then added to the mixture and shaken for another 30 s. The mixture was then filtered through a 0.2-μm PTFE syringe filter into an HPLC vial. This resulted in a total dilution factor of 81.
Samples for the quantification of CBD with only a 405-fold dilution were prepared by adding 200 µL of sample A to 800 µL of methanol and thoroughly mixing for 30 s.
The five hemp oils tested in this study were purchased from various mail order vendors. The appearance and label information for three of the five are shown in Figure 2, referenced as black, blue, and green. Two samples tested but not pictured are referred to as red and yellow.
Results
Figures 3(a), 3(b), 3(c), and 3(d) show the chromatograms obtained from the analysis of hemp oils #1 and #3 for determination of total cannabinoid content (81x diluted) as well as CBD content only (405x dilution).
A summary of results of quantitative determination of total cannabinoid as well as CBD content in five commercially available hemp oils is shown in Tables 1 and 2.
As a general sample observation, hemp oils #1 (black) and #2 (blue) exhibited a transparent, weak-yellow–green colouration. This leads to the assumption that each of these oils was a product of multi-step purification after extraction; for example, CO2 or butane extraction followed by steam distillation. Notably, hemp oil #3 (green) was opaque brown–green and gritty in appearance. It also had the most intense smell, a distinctly “earthy” odour. It was concluded that the sample was the result of crude extraction only, with no further refinement.
It is important to note that it has been reported in the literature that the whole plant can be more beneficial to the consumer because it contains not only cannabinoids, but also an array of terpenes providing a synergistic “entourage effect” (4,9). The whole plant can also provide essential fatty acids, plant sterols for lowering cholesterol, and antioxidants, chlorophyll and Vitamin E.
Hemp oils #1 (black) and #2 (blue) showed high ratios of CBD to total cannabinoids, both at 92%, and the lowest quantity of other cannabinoids. This finding supported the assumption, along with transparency and colour, that these oils were more highly purified samples. Both samples also tested close to label claim at 95% and 92%, respectively.
Hemp oil #3 (green) revealed the highest content of CBD and total cannabinoids, yet exhibited the lowest ratio of CBD to total cannabinoids (59%). This observation is consistent with the assumption that its crude appearance reflected the least amount of post-extraction purification. Although its CBD percentage of label claim tested the lowest (81%), this sample did contain the highest level of CDB compared to all other oils tested.
Hemp oils #4 (red) and #5 (yellow) tested higher than label claim at 122% and 200%, respectively. The observation is consistent with FDA findings for CBD products, perhaps calling into question the type and accuracy of testing used to justify label claims.
Conclusion
In summary, all samples contained less than 0.3% d9-THC, as expected from hemp products. All samples showed an array of other cannabinoids, but the minor component, THC-V, was not detected in any of the hemp oil samples. From a quality control point of view two samples were within a reasonable range of the label claim at +/- 10%. One sample was well below and two other oils contained CBD levels well above the label claims, one by as much as 200%. This study showed that in three out of five randomly selected samples the actual concentration of CBD did not comply with the stated content. This HPLC method provides a simple and fast assay for CBD and total cannabinoid content for improved quality control of hemp products.
References
[1] European Monitoring Centre for Drugs and Drug Addiction:
http://www.emcdda.europa.eu/publications/topic-overviews/cannabis-policy/html_en
[2] The WEEK, 19 June 2018: http://www.theweek.co.uk/59417/should-cannabis-be-legalised-the-pros-and-cons-of-decriminalising-drugs
[3] LABIOTECH.eu, 12 March 2018: https://labiotech.eu/medical-cannabis-approval-europe-dentons/
[4] P.G. Fine and Mark J. Rosenfeld, Rambam Maimonides Medical Journal 4(4), e0022 (2013).
[5] T.W. Klein and C.A. Newton, Adv. Exp. Med. Biol. 601, 395–413 (2007).
[6] K. Ifï¬and and F. Grotenhermen, Cannabis and Cannabinoid Research 2(1), 139–154 (2017) DOI: 10.1089/can.2016.0034
[7] CBD web: https://www.cbdweb.org/medical-cannabis-guide/hemp-vs-marijuana-vs-cannabis
[8] J. Johnson, Medical News Today(2017) https://www.medicalnewstoday.com/articles/317221.php
[9] A. Chen, Scientific American(2017) https://www.scientificamerican.com/article/some-of-the-parts-is-marijuana-rsquo-s-ldquo-entourage-effect-rdquo-scientifically-valid/
Gesa Johanna Schad graduated with a diploma in chemical engineering from the Technical University NTA in Isny, Germany, in 2004 and an MSc in pharmaceutical analysis from the University of Strathclyde in Glasgow, UK, in 2005. She worked until 2006 as a consultant in HPLC method development and validation in an analytical laboratory of the FAO/IAEA in Vienna, Austria. She gained her doctorate for research in pharmaceutical sciences at the University of Strathclyde in 2010 and was employed as an HPLC specialist in the R&D department at Hichrom Ltd. in Reading, UK, from 2009. Since 2013, she has worked as a HPLC product specialist and since 2015 as HPLC Product Manager in the analytical business unit of Shimadzu Europa in Duisburg, Germany.

New Method Explored for the Detection of CECs in Crops Irrigated with Contaminated Water
April 30th 2025This new study presents a validated QuEChERS–LC-MS/MS method for detecting eight persistent, mobile, and toxic substances in escarole, tomatoes, and tomato leaves irrigated with contaminated water.

.png&w=3840&q=75)

.png&w=3840&q=75)


.png&w=3840&q=75)


.png&w=3840&q=75)


