Factors and Parameters that Directly Affect Recovery of Collected Fractions in Preparative HPLC
LCGC North America
Purification of synthetic, natural and biological compounds in any quantity usually requires the use of preparative HPLC.
Purification of synthetic, natural and biological compounds in any quantity usually requires the use of preparative HPLC. Collecting fractions from preparative HPLC is a common approach to achieving the purified compound(s) of interest. Many factors and parameters (too many to mention in a single article) directly affect fraction collection recovery. In this first article of a series we discuss basic fraction collection parameters, namely, detector settings and collection via peak level or threshold. This information offers guidelines to all chromatographers purifying compounds by preparative HPLC and can be implemented for or with existing systems.

As stated by A. Brand and K. Kueppers in a previous LCGC article, there are "two dynamics in the pharmaceutical industry that are fueling the interest in preparative high performance liquid chromatography (HPLC). One, the regulatory agencies requiring more stringent purity requirements of products, for example, drug compounds, and the other the sheer complexity of developing drug compounds" (1). There are several ways to purify compounds, including crystallization, solid-phase extraction, distillation, and filtration. At the present time, preparative HPLC reigns as the most powerful and versatile tool for purification in pharmaceutical industry (2). Parameters associated with preparative HPLC that often are assumed to be correct are the values defining fraction collection. Optimization of your preparative HPLC system to collect fractions with high purity and acceptable recovery is extremely important, given the time and investment often devoted to the synthesis of a drug product. For instance, in 2003, 69 of 80 human therapeutic proteins on the market sold at prices over $10,000/g. Valuable product cannot be lost during purification. In a perfect world, chromatographers would be able to optimize for each compound purified. However, this is not the case. Purity and recovery are used to define the capabilities of a system to collect fractions. Although each describes a unique feature of fraction collection, the two concepts are related.

Table I
Purity usually is determined by means other than UV detection (for example, mass spectrometry, diode-array detection, and chemiluminescence nitrogen detection). This allows for the evaluation of the component that is responsible for the absorbance peak in the chromatogram. Determination of whether one compound or more than one compound is responsible for the peak is what defines the level of purity.
Recovery is based upon the amount of product collected. The more nearly pure the compound, the greater the recovery — which leads to enhanced synthesis and assay development. There are many factors that affect the ability to collect pure fractions with acceptable recovery, too many to attempt to cover in one article. Therefore, we will focus on a few basic parameters common to all systems, namely, detector settings, delay volume, fraction collector valve volume–switch time, peak level–threshold, slope, and how these parameters affect the collection and recovery of fractions.
Detector Settings: Time Constant
Common detector settings are wavelength, sensitivity, and time constant. The setting that we will focus on is the time constant. Most detectors have a detector noise filter that smoothes the data output signal. This can be labeled as time constant, peak width, or rise time. Detector smoothing takes time; for optimal preparative fraction collection, one sets the time constant to the fastest setting, zero if possible. With fast flow rates (20–200 mL/min), narrow peaks (5–60 s), and long time constants, the sample actually can reach the fraction collector before the software receives the signal from the detector. A delay of 2 or 3 s can result in the loss of 50% of the sample, relative to peak width of 5 s for a given peak. In fast chromatography with run times of 3–10 min per sample, as the value for the detector time constant increases, mass recovery decreases; see Table I. Most modern detectors should have the option to set a time constant at or near zero to minimize this problem.
Delay Volume
There is a fixed amount of tubing volume between the detector flow cell and the fraction collector switch valve (Figure 1).
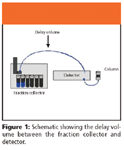
Figure 1
It is important to determine delay volume to optimize the collection of desired fraction. The following conversion table can be used to calculate delay volume (see Table II).
To determine the total delay volume, all the flow components between the detector and fraction collection vessel must be added together. For example, if an HPLC system had 10 ft of 0.040-in. i.d. tubing between the detector flow cell and the fraction collection valve, approximately 2.5 mL of delay volume would be attributed to this tubing. When calculating delay volume, it is important to remember that normal HPLC specifications for tubing internal diameters can vary by as much as 10%. This is an approximation of the volume because, as mentioned previously, there are other factors that contribute to the overall delay of the system and the collection of fractions.
Software processing speed: At a flow rate of 40 mL/min, it takes a sample 3.6 s to travel through 10 ft of 0.040-in. diameter tubing. It might take the software data controller longer than 2–4 s to process the following data:
- Is a peak being eluted from the column?
- Does this peak meet set peak identification parameters?
- What is the delay from the detector to the fraction collector?
- Start collection or not?
One must be aware of the software processing speed in the collection of preparative fractions.
Collection valve switch time: This is the time associated with the fraction collection valve switching from waste to collect. The switch time should only be a few milliseconds. If the switch time is 1 s or more in length, the time will be too long and sample will be lost. Consider a run time of 5 min and flow of 40 mL/min, with peak widths of 5–20 s. If the switch time was 1 s, more than 10% of the peak would go to waste before the valve switches.
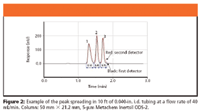
Figure 2
The effects of detector time constant, delay volume, software processing speed, and collection valve switch time are additive, compromising recovery. To enhance recovery, it might be necessary to increase the length of tubing between the detector and collection valve, and thereby increase the delay volume. Increasing the length of tubing will deter the peak from reaching the collection valve before collection triggering and increase recovery. An issue that always arises when one adds additional tubing to an HPLC system postcolumn, is the possibility of peak spreading (broadening). However, at the increased flow rate associated with preparative HPLC, the peak spreading through 10 ft of 0.040-in. i.d. tubing is negligible. To determine peak spreading, we placed two detectors in series within an HPLC system with 10 ft of 0.040-in. i.d. tubing between them. We injected the sample and recorded the response from each detector. The chromatographic overlay, Figures 2 and 3, show the amount of peak spreading one could expect.
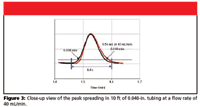
Figure 3
The chromatogram in Figure 4 shows the recoveries that we observed when the delay volume was not increased to compensate for the aforementioned factors. Not only are the recoveries extremely low, but contamination with the adjacent peak is observed.
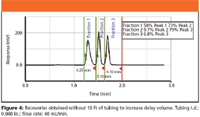
Figure 4
When we added 10 ft of tubing to increase delay volume, recoveries drastically increased for all the peaks, and contamination of adjacent peaks was negligible (Figure 5).
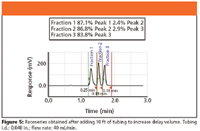
Figure 5
The addition of the 10 ft of tubing to increase the delay volume was necessary in this example only because a long time constant was set in the detector. Modern HPLC detectors should have short time constants, eliminating the need for additional tubing to increase delay volume.

Table II
Collecting Fractions via Peak Level or Threshold
Collecting fractions by peak level uses a percentage of signal ("full scale") to start and stop fraction collection. "Full scale" refers to the analog range output in millivolts and is independent of detector sensitivity setting. For instance, if the detector sensitivity is 0.05 AUFS (absorbance units full scale) and the full scale analog output is 100 mV, then 0.05 AUFS = 100 mV. If the detector sensitivity setting is changed to 1.0 AUFS the full scale analog output is still 100 mV, but now 1.0 AUFS = 100 mV.
For example, if the peak level = 10% of full scale (100 mV), then peak level = 10 mV; peak-level collections start and stop when the signal reaches 10 mV
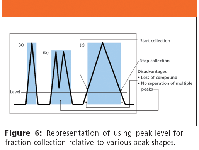
Figure 6
Depending upon the HPLC software, the start and stop of peak level can be defined as percent full scale, in millivolts or absorbance units. Figure 6 depicts the effect of using peak level for fraction collection.
Because peak level is a percentage of the full-scale millivolts output, it does not account for variations in peaks, as shown in Figure 6. We set the peak level below the valley of the multiple peak (Figure 6b), and therefore, collected a fraction containing both compounds, not achieving purification. The same held true for a very broad peak (Figure 6c), where a substantial portion of the peak cannot be collected due to the shallower rise to reach the preset peak level. When one chooses peak level as one's mode of collection, it is helpful to know the baseline in millivolts. Then one can set the peak level above this value but low enough so that one collects a significant percentage of desired peak. We represent this concept in Figure 7 graphically by changing the peak level value.
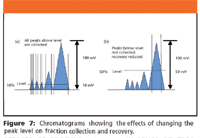
Figure 7
Because the first set of peaks (Figure 7a) has a lower peak level value (10% or 10 mV), one also collects a small portion of the minor peaks collected along with the bulk of the "target" peak. The second set of peaks (Figure 7b) represents the outcome if the peak level value is set too high (50% or 50 mV), not collecting any of the minor peaks, and a substantially lower amount of the primary peak.
Figure 8 shows a graphical representation of increasing the peak level versus recovery. The scenario is the same as that discussed previously. As one increases the peak level, a parameter associated with the millivolts required to trigger fraction collection, one collects less of the peak because collection is activated solely by a voltage reading. Be aware that a drifting baseline affects the voltage (baseline does not equal 0 mV) reading, which can, in turn, effect fraction collection.
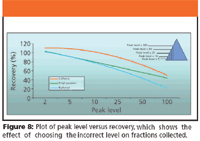
Figure 8
Collecting Fractions via Peak Slope
Another mode of fraction collection is peak slope. Peak slope collection software must determine when the baseline changes enough to satisfy the preset slope conditions. While monitoring the baseline for changes, it must determine which change is the result of detector baseline noise and which change satisfies the set slope parameters and begin or end collection. It must look at the baseline for a long enough period to distinguish baseline noise from actual peaks and do this fast enough to collect 95% or greater of the peak. Peak slope determination incorporates two factors; a slope or angle setting to determine when a peak begins and ends and a time value to compensate for variations in peak widths. Collection of narrow peaks requires the software to make a quick decision on peak begin and peak end while on the other hand the software can take longer to make this decision with broad peaks. Narrow peak widths of 5–20 s require a high processing rate because decisions need to be made in less than 1 s to achieve good recovery.
Figure 9a visually represents the differences between a narrow peak width and a broad peak width (0.2–5 min). It is obvious based upon the widths of the three peaks that the software would have to act very quickly to accurately trigger collection of fractions with narrow peak widths. In addition, a peak slope–angle approaching 90° (shown in Figure 9b), representing a very quick change, also requires the software to make a fast decision for fraction collection. Both of these values and therefore, the shape of the peaks need to be considered when collecting fractions by peak slope.

Figure 9
Conclusion
We have shown in this article that fraction collection from preparative HPLC is not trivial and care should be taken to set the parameters correctly. Paying attention to system parameters effects purity level and percent recovery of compounds processed via preparative HPLC. Regardless of whether one chooses peak level or slope to obtain collected fractions, there are limitations associated with these techniques. However, there is no reason that one should not achieve high recovery and purity. The data we have presented offers insight into the definitions of basic fraction collection parameters and their effects on recovery and purity. One also can collect coeluted or overlapping peaks. However, collection of fractions will not be pure, requiring additional advanced collection parameters that will be addressed in future articles.
Joan M. Stevens, Ph.D., Alan Hamstra, Tim Hegeman, and Gary Scharrer
Applications and Technical Support, Gilson, Inc., P.O. Box 620027 3000 West Beltline Hwy., Middleton, WI 53562.
Please direct correspondence to Joan M. Stevens at jstevens@Gilson.com
References
(1) A. Brandt and S. Kueppers, LCGC 20 (1), 14–22 (2002).
(2) G. Mann, Analusis 26(7), M76–M82 (1998).
Acknowledgments
The authors would like to thank Lester Dolak Ph.D., for all his input now and then.

Common Challenges in Nitrosamine Analysis: An LCGC International Peer Exchange
April 15th 2025A recent roundtable discussion featuring Aloka Srinivasan of Raaha, Mayank Bhanti of the United States Pharmacopeia (USP), and Amber Burch of Purisys discussed the challenges surrounding nitrosamine analysis in pharmaceuticals.


