Facilitated Column Selection in Reversed-Phase Liquid Chromatography for Pharmaceutical Separations
LCGC Europe
This article gives an overview of the performance of a previously developed system for the ranking of C18 reversed-phase columns applied to different pharmaceutical analyses. The separation of eight different drug substances from their respective impurities was studied. The chromatographic procedure for acetylsalicylic acid, clindamycin hydrochloride, buflomedil hydrochloride, chloramphenicol sodium succinate, phenoxymethylpenicillin and nimesulide was performed according to the corresponding European Pharmacopoeia monograph. The separations of dihydrostreptomycin sulphate and vancomycin were performed according to literature. It was found that that the column ranking system is a helpful tool in the selection of suitable columns in these analyses.
As the number of commercially available columns continues to rise, along with new types of innovative stationary phases, the selection of a suitable column for a given separation may be cumbersome. The situation is not simplified by the information given by the manufacturers. Based on the information received, comparison between columns from different manufacturers may be very difficult.
Official monographs, for example, in the European Pharmacopoeia (Ph. Eur.)1 and the US Pharmacopeia (USP),2 give an exact description of the mobile phase, whereas the stationary phase is only described in general terms of column and particle dimensions and of some additional features such as end-capping and base deactivation.
Nowadays, official compendia mostly prescribe C18 reversed-phase (RP) LC columns for analysis. The Ph. Eur. subdivides octadecylsilyl columns into seven subgroups based on properties such as silica purity, end-capping and base deactivation but, alas, not providing enough information to select a suitable column from the huge number available on the market. With some efforts, the column(s) used during development of the official method can be found in PharmEuropa and for recent methods, also on the website. For the USP, the situation is similar. Even when information on the development column is known, a problem may arise when that particular column is not easily available on the market or is simply not present in the laboratory.
The average control laboratory does not have all the stationary phases used in official monographs available. It is also possible that column properties change over longer periods of production or that previous use of a column changed its properties (indeed, control laboratories do not use a new column for each analysis). Given this situation, a column classification system, based on chromatographic performance would be helpful.
The issue of RP-LC column selection was discussed earlier by Steffeck et al.3 and Engelhardt et al.4 Many papers, describing methods to characterize columns, were published to solve this issue, but only recently published articles are cited.5–14
Column selectivity in RP-LC has been extensively studied by Dolan, Snyder and co-workers. This led to the hydrophobic-subtraction model, describing five solute-column interactions.15–20 Euerby et al. studied 170 columns based on six chromatographic parameters to obtain a column classification system.5,6 During the same time period, in our laboratory a simple chromatographic test procedure to characterize C18 RP-LC columns was derived from the large number of previously published tests.
The system allows us to rank C18 RP-LC columns, each characterized by four parameters: the retention factor of amylbenzene, k'amb, the relative retention factor of benzylamine/phenol at pH 2.7, rk'ba/ph 2.7, the retention factor of 2,2'-dipyridyl, k'2,2'-dip and the relative retention factor of triphenylene/o-terphenyl, rk'tri/ter. This approach starts with the selection of a reference column (e.g., this is prescribed by the method) or of four reference parameter values. An F–value for a column i is calculated as:

The F-value of a column i equals the sum of squares of the differences between each parameter value of the reference column and of a column i. The smaller the F-value, the more similar column i is to the reference column and the higher column i is found in the ranking (high-ranked columns). Before being introduced in Equation 1, the parameters are autoscaled:

where xij is the value of parameter j on column i, x-meanj– is the mean value of parameter j on all tested columns and Sj is the standard deviation for parameter j.
This column classification system allows the identification of an alternative column, with similar selectivity as the prescribed reference column, so that the alternative column will provide an "equivalent" separation as the prescribed column.21–26 It also allows the follow-up of column ageing, so that analysts can easily check whether the characteristics of their columns have changed over time. The column ranking system is available at http://www.pharm.kuleuven.be/pharmchem/columnclassification The database already contains about 80 different types of C18 RP-LC columns and new types are being characterized in our laboratory at present.
Experimental
Chromatographic tests and columns tested: Detailed information concerning test methods, chromatographic conditions, measured parameters and column properties was published earlier.21,23 An overview is given in Table 1. Table 2 provides an overview of all examined C18 RP-LC columns. The original column numbering, employed in our previous papers,21,23–27 was maintained.

Table 1: Description of the methods used to characterize columns.
Chromatographic conditions: The separations of acetylsalicylic acid (ASA), clindamycin hydrochloride (CLINDA), buflomedil hydrochloride (BUFLO), chloramphenicol sodium succinate (CCS), phenoxymethylpenicillin (PEN V) and nimesulide (NIM) were performed according to the respective Ph. Eur. monographs.1 The analyses of dihydrostreptomycin sulphate (DHS)29 and vancomycin (VM)30 were performed according to the literature. The mobile phase composition for each separation was not adapted to the retention properties of the different stationary phases, to compare the different types of C18 RP-LC columns better.

Table 2: List of columns, investigated in the analysis of acetylsalicylic acid (ASA), clindamycin hydrochloride (CLINDA), buflomedil hydrochloride (BUFLO), chloramphenicol sodium succinate (CCS), nimesulide (NIM), phenoxymethylpenicillin (PEN V), dihydrostreptomycin sulphate (DHS) and vancomycin (VM). The internal diameter is always 4.6 mm.
Suitability of the separation: In the first place, the system suitability test (SST) prescribed by the monograph was used to evaluate the separation. Next, the chromatographic response function (CRF) was calculated. This CRF is a measure for the overall selectivity, taking all impurity peaks into account. The determination of this CRF needs the availability of potential impurities as a reference substance and is, therefore, difficult to be performed in daily analytical practice. The CRF was calculated as:

here n is the total number of solutes, g is the interpolated peak height of a peak pair (i.e., the distance between the baseline and the line connecting the two peak tops at the location of the valley) and f is the depth of the valley, measured from the line connecting the two peak tops.31,33 This means that a baseline-separated peak pair has an f/g ratio of 1, a non-separated pair has a value of 0, while a partly separated peak pair has an intermediate value. The use of these values has originally been described for thin-layer chromatographic methods (TLC),32 but they can be used in LC as well.33
Calculation of a virtual ideal column: All columns giving a CRF = 1 (baseline separation of all peaks) in a given separation were grouped and a Grubbs test (α = 0.05) was performed onto the data to trace and remove outliers. Then, ideal column parameters were calculated by taking the average of the parameters of the remaining columns with a CRF = 1. With this virtual column as a reference, F-values were calculated and a ranking of all columns was made. The columns with F < 2 were considered as high ranked, columns with F > 6 as low ranked and columns with 2 < F < 6 as intermediate.26–28
Results and discussion
Separation of acetylsalicylic acid and its related compounds:25,26 The Ph. Eur. acetylsalicylic acid monograph prescribes the use of an octadecylsilyl silica gel (5 µm) column with a length of 0.25 m and internal diameter of 4.6 mm. The allowed changes of the prescribed parameters are column length: ±70 %, column internal diameter: ±25% and the particle size may be maximally reduced with 50%.1 The limits for columns allowed for the analysis of ASA therefore enlarge to 75–425 mm for column length, 3.45–5.75 mm for internal diameter and 2.5–5 µm for particle size. Based on these criteria, three columns (8, 11 and 53) were excluded.
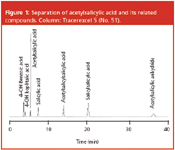
Figure 1
A typical chromatogram is shown in Figure 1. For most pharmacopoeial analyses, analysts have to check the compliance with the SST requirements first, prescribing here a resolution higher than 6 for the separation between acetylsalicylic acid and salicylic acid. Out of the 56 remaining columns, 32 were not suitable according to this SST. To check the influence of column and particle dimensions, all column pairs with exactly the same stationary phase, but either a different column length and/or a different particle size are considered. Twelve column pairs are found and divided in 4 groups, shown in Table 3.
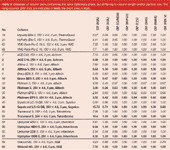
Table 3: Overview of column pairs containing the same stationary phase, but differing in column length and/or particle size. The long columns (250 mm) are indicated in bold, the short ones in italic.
The first group contains columns with the same length, but a different particle size. Group 2 and group 3 include columns with a different column length and particle size. Group 2 contains 250 mm long columns with 5 µm particles and 150 mm columns with 3 µm particles whereas group 3 contains 250 mm long columns with 5 µm particle size and 100 mm columns with 3 µm.
The fourth group includes 2 Wakosil HG columns with the same 5 µm particle size but with a different column length. When the SST values are examined, it is observed that the 250 mm columns have higher SST values than the respective 100 and 150 mm columns in 9 out of 10 instances. It is logical to observe that the difference in SST between 250 mm and 100 mm columns is more pronounced than that between 250 mm and 150 mm columns.
The smaller particle size of shorter columns results in a better packing and a smaller dead volume, leading to a diminished diffusion. Nevertheless, this smaller particle size does not seem to completely compensate for the shorter column length. Another parameter to evaluate separations is the CRF, considering the overall separation and, therefore, involving every single peak in the obtained value. Taking into account that a CRF = 1 implies overall baseline separation, 28 out of 56 columns have a CRF below 1. From the column pair with the same length, but different particle size (19 and 20), the 3 µm column performs better. This is logical because the particle size is reciprocally correlated with the plate number, of which the square root is directly correlated with the resolution. Two column pairs (50, 51, 54 and 55) showed CRF = 1 for both lengths. The other 250 mm columns perform better in 6 out of 8 pairs compared with the 100 and 150 mm columns. Again, a smaller particle size does not necessarily compensate for a longer column. Together with the observations from the SST, the data suggest that the allowed column length variation of ±70 % is quite large.
Comparing SST with CRF, the SST has the advantage that besides the selectivity of the critical pair, the peak shape and the sensitivity for SA is also examined, whereas on the other hand the CRF provides the right information about the overall selectivity. However, the CRF can never replace the SST in daily practice because it requires the availability of all impurities. In this study, the CRF is used as criterion and after determination of the virtual ideal column to be used as reference, F-values are calculated and a ranking of the columns is made.
The Ph. Eur. prescribes the use of a 0.25 m column. All 0.25 m columns (16/16) with F < 2 show a CRF = 1 (i.e., they show a baseline separation of ASA and all related substances). In the F < 6 group only 2 out of 11 (18%) 0.25 m columns show a CRF = 1, while in the 2 < F < 6 group this is 3 out of 7 (43%) (Table 4). This shows that the column classification system is a helpful tool to choose a suitable column. If a column with F < 2 is chosen, the probability to obtain good separations is very high. In the lower ranked columns, it is more probable to find a column showing less good separations, although this is not necessarily the case. The lower the ranking, the higher the probability of choosing a less efficient column. This system is not perfect, but helps the analyst to select a suitable column for the chosen separation.
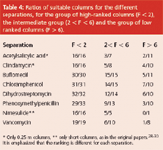
Table 4: Ratios of suitable columns for the different separations, for the group of high-ranked columns (F 6)
It must be remarked that the selection of the reference column or reference values is of major importance. Suitable columns can also be found among the low-ranked columns (with values F > 6). When such a column is used as a reference column in the ranking system, the results will not be so favourable because the columns close to the reference will not be suitable for that separation. This shows that the column classification system is not omnipotent and has its limitations.
Separation of clindamycin hydrochloride and its related compounds: The clindamycin monograph prescribes exactly the same criteria for column selection as the acetylsalicylic acid monograph. Therefore, the same three columns were removed from the dataset (8, 11 and 53). A typical chromatogram is shown in Figure 2.
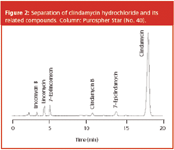
Figure 2
As the SST of the Ph. Eur. prescribes approximate values for the relative retentions of the impurities, this test was not used to evaluate the quality of the separation. Problems related to the use of relative retentions have been discussed elsewhere.34
Considering a CRF = 1 as criterion for an excellent separation, 20 out of 57 columns have a CRF below 1. CRF values for columns with the same stationary phase but different column length and/or particle size are again reported in Table 3. Column pairs have the same CRF and are not considered further (3, 4, 35, 36, 50, 51, 65 and 66). Of the column pair with the same length (19 and 20), the 3 µm column also has a higher CRF than the respective 5 µm. When groups 2 and 3 are considered, 6 out of 7 times the 250 mm column outstands the 100 and 150 mm column. Although the differences are small, this suggests again that the allowed column length variation of 70% is quite large.
As for ASA, the Ph. Eur. prescribes a 0.25 m column. All high-ranked 0.25 m columns with F < 2 show baseline separation (16/16), compared with 63% (5/8) of the intermediate (2 < F < 6) 0.25 m columns and 40% (4/10) of the low-ranked (F > 6) 0.25 m columns. This shows that the column ranking can help analysts with their column selection for the analysis of clindamycin.
Separation of buflomedil and its related compounds: After ranking, all columns with F < 6 show a CRF = 1 whereas for the columns with F > 6, only 45% show a CRF = 1 (Table 4). It has to be remarked that only three compounds with clearly different retention times have to be separated, as shown in Figure 3, which accounts for the less-differentiated suitability of the columns towards this separation. This also results in reduced influence of column length, which is reflected by all column pairs showing the same CRF (Table 3).
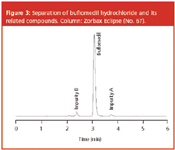
Figure 3
Separation of chloramphenicol sodium succinate and its related compounds: A typical chromatogram is shown in Figure 4. After calculation of ideal column parameters and ranking of all the columns according to their F-value, all columns with F < 2 and 93% of the columns with 2 < F < 6 show a complete baseline separation (CRF = 1), while the percentage with CRF = 1 decreases to 70% for the low-ranked columns (F > 6) (Table 4). Here, all column pairs show exactly the same CRF except the 250 mm Platinum EPS, which is somewhat better then its 150 mm equivalent (Table 3).
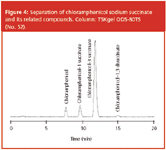
Figure 4
Separation of phenoxymethylpenicillin and its related compounds: This is a more complex separation, as can be observed in Figure 5. After ranking all the columns according to their F-value, 88% of the columns with F < 2 and 69% of the columns with 2 < F < 6 show a complete baseline separation (CRF = 1) (Table 4). Only 30% of the columns with F > 6 are found suitable. No real difference is observed between the column pairs since most pairs have CRF = 1 (Table 3).
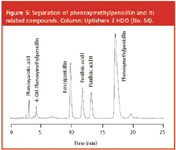
Figure 5
Separation of dihydrostreptomycin sulphate and its related compounds: A typical chromatogram is shown in Figure 6. In the ranking, obtained in a similar way as above, all columns with F < 2 show an overall baseline separation, compared with 86% for 2 < F < 6 and 60% for F > 6 (Table 4). No real difference is observed between the column pairs (Table 3).

Figure 6
Separation of nimesulide and related compounds: A typical chromatogram is shown in Figure 7. After the parameter calculation of the ideal column, a ranking is made. As the Ph. Eur. prescribes a column with 0.125 m length and 4.0 mm internal diameter, the limits for selecting a suitable column enlarge to 37.5–212.5 mm for column length and 3.0–5.0 mm for internal diameter. Based on these criteria, all 250 mm are excluded. Column 32 with a length of 83 mm demonstrates a resolution of 2.8 between impurity C and D (the requested value is 2) and a CRF of 1 is obtained.

Figure 7
All columns with F < 6 show baseline separation for all peaks while columns with changed selectivity are among the low-ranked columns (F > 6), indicating again the relationship between the column classification system and column selectivity in real separations (Table 4). The column pairs always have the same CRF value, except for the Platinum EPS, where the 150 mm exceptionally has a slightly higher CRF value than its 250 mm equivalent (Table 3). Although the usage of a 25 cm column is not allowed according to Ph. Eur., it was observed that the quality of the separation on these columns was good.
Separation of vancomycin and its related compounds: Here, the critical CRF value is set at 0.90 based on the observation that baseline separation of 2 peaks (i.e., crystalline degradation product minor and monodechlorovancomycin 1) is very difficult to reach. It can be observed that a separation with CRF = 0.90 is still sufficient, as is shown in Figure 8. All columns with F < 2 are suitable for the analysis of vancomycin and its impurities (CRF > 0.90). For columns with F > 2 the probability to separate the impurities well clearly decreases. For 2 < F < 6, 60% of the columns give a CRF value above 0.90, while for F > 6, only 33% show an appropriate selectivity (Table 4). No pairs of different columns were used in this separation.
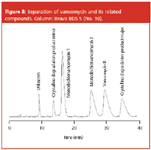
Figure 8
Introduction of a F'-value, taking column length and particle size into account. In an attempt to incorporate the discussed differences of column and particle dimensions into the F-value, an F'-value is proposed:

dp stands for particle size and L stands for column length. dp1 and dp2 represent the particle size of either the investigated column or the particle size prescribed by the monograph, dependent on which one has the highest value. The same accounts for the column length. dp1–dp2 and L1–L2 have to be expressed in the same units, respectively. In this way, columns with a different column length or particle size than prescribed, will have an adjusted F-value. Columns, fulfilling exactly the requirements keep their original F-value. This F' value was applied on the separations of aspirine, clindamycin and nimesulide since the respective monographs prescribe a defined column length and particle size.
Considering all columns allowed by the ASA monograph (therefore including 100 and 150 mm columns), a comparison was made between F and F'-values. For each category of F' (F' < 2, 2 < F' < 6 and F' > 6) the ratio of columns showing a CRF = 1 was calculated. As seen in Table 5, instead of 73.3%, 95% of columns with F' < 2 have CRF = 1. There is only one column (nr 52) with a CRF < 1 showing a value of 0.84 that can still be considered acceptable as separation. The ratio within the 2 < F' < 6 range changes little: from 30.8–33.3% and for F' > 6, a small change from 15.4–13.3% is observed.

Table 5: Ratios of suitable columns in the group of high-ranked columns (F 6) and in the corresponding F'-groups for the separations of acetylsalicylic acid, clindamycin and nimesulide.
For clindamycin, all columns were also considered. As seen in Table 5, instead of 83.9%, all columns with F' < 2 have CRF = 1. The ratio of 2 < F' < 6 changes little (from 46.2–54.6 %) and for F' > 6, a small change is seen from 33.3–28.6%.
For nimesulide, the adaption to F' did not change the ranking of the data set. All columns with F' < 6 showed baseline separation for all peaks while columns with changed selectivity were among the low ranked columns (F' > 6), indicating again the relationship between the column classification system and column selectivity in real separations (Table 5). This system using F'-values is helpful for column ranking for analyses where different column lengths and particle sizes may be used.
Conclusions
This article discusses column selection for the analysis of eight drug substances. All separations were performed on reversed-phase liquid chromatography C18 columns, each characterized by four chromatographic parameters.
Based on these four parameters, an F-value was calculated versus reference parameter values and a ranking was made. The relationship between the ranking of the columns and their performance in real separations was examined. For all separations examined, it was observed that about 100% of the high-ranked columns (F < 2 versus the reference values) gave suitable separations. This percentage gradually decreased in the intermediate group (2 < F < 6) and in the group of low ranked columns (F > 6). Although the system does not allow complete characterization of columns and has its limitations, it is shown to be an interesting tool to facilitate the selection of a suitable RP-LC C18 column.
Comparison of column pairs with different column parameters, such as length or particle size, showed that longer columns perform better compared with shorter equivalents, insinuating that parameter deviations permitted by the Ph. Eur. limits are quite large. An attempt to incorporate these parameter differences into the F-value led to an F'-value, which takes the column length and particle size into account. For the three separations discussed, an improvement was seen.
It should be emphasized that this column ranking does not distinguish between "good" and "poor" columns. A column with a low ranking indicates that it has different properties compared with high-ranked columns and that it is probably less suitable for that particular application. For another application this same column may show a high ranking. Even a column that ranks low for many applications may be of great value for some other, specific applications.
Acknowledgements
The authors thank the manufacturers and the suppliers for the gift of columns.
E. Haghedooren enjoys a grant from the Institute for the Promotion of Innovation through Science and Technology in Flanders (IWT-Vlaanderen).
D. Visky, Zs. Kovács and K. Kóczián thank the Ministry of the Flemish Community for financial support.
E. Adams is a post-doctoral fellow of the Fund for Scientific Research (FWO) — Flanders, Belgium.
Financial support to this project is given by a Research Grant of the Fund for Scientific Research-Flanders (Belgium).
Erik Haghedooren is a PhD student of the Laboratory for Pharmaceutical Analysis, Leuven, Belgium, working in the field of column classification.
Dóra Visky was a post-doctoral researcher at the Laboratory for Pharmaceutical Analysis, Leuven, Belgium, working in the field of column classification and LC–MS.
Pieter Dehouck acquired his PhD at the Laboratory for Pharmaceutical Analysis, Leuven, Belgium, and did research in the field of uncertainty determination in pharmaceutical analysis.
Kristóf Kóczián is a PhD student at the Semmelweis University, Department of Pharmaceutical Chemistry, Budapest, Hungary, using spectroscopic (NMR, UV), electroanalytical and separation techniques (HPLC) and methods to characterize and analyse physico-chemical properties of drugs and biomolecules.
José Diana acquired his PhD at the Laboratory for Pharmaceutical Analysis, Leuven, Belgium, and did research in the field of liquid chromatographic method development for the analysis of selected antibiotics and mass spectrometric investigation of unknown impurities.
Zsuzsanna Kovács is a PhD student at the Semmelweis University, Department of Pharmaceutical Chemistry, Budapest, Hungary, using separation techniques (HPCE, HPLC), electroanalytical and spectroscopic (NMR, UV) methods to characterize and analyse drugs and biomolecules.
Béla Noszál is professor and head of Pharmaceutical Chemistry at Semmelweis University, Budapest, Hungary, working in the fields of pharmaceutical and biomolecular analysis and microspeciation.
Jos Hoogmartens is professor and head of the Laboratory for Pharmaceutical Analysis, Catholic University of Leuven, Belgium.
Erwin Adams is a post-doctoral fellow of the Fund for Scientific Research — Flanders (Belgium) at the Laboratory for Pharmaceutical Analysis, Leuven, Belgium. He is mainly working in the field of LC, LC–MS and column classification.
References
1. European Pharmacopoeia, 5th edition, Council of Europe, Strasbourg, France (2005).
2. United States Pharmacopeia 28, The United States Pharmacopeial Convention, Rockville, Maryland, USA (2005).
3. R.J. Steffeck et al., LCGC N. Am., 13, 720–726 (1995).
4. H. Engelhardt and R. Grüner, Intern. Lab., 29, 34–42 (1999).
5. M.R. Euerby and P. Petersson, J. Chromatogr. A, 994, 13–36 (2003).
6. M.R. Euerby and P. Petersson, J. Chromatogr. A, 1088, 1–15 (2005).
7. E. Van Gyseghem et al., J. Chromatogr. A, 1042, 69–80 (2004).
8. M. Kele and G. Guiochon, J. Chromatogr. A, 830, 41–54 (1999).
9. W. Verstraeten et al., Intern. Lab, 3, 20–29 (2000).
10. U.D. Neue et al., J. Sep. Sci., 26, 174–186 (2003).
11. K. Le Mapihan, J. Vial and A. Jardy, J. Chromatogr. A, 1061, 149–158 (2004).
12. R. Kaliszan et al., J. Chromatogr. A, 855, 455–486 (1999).
13. T. Baczek et al., J. Chromatogr. A, 1075, 109–115 (2005).
14. P. Forlay-Frick, J. Fekete and K. Héberger, Anal. Chim. Acta, 536, 71–81 (2005).
15. L.R. Snyder et al., J. Chromatogr. A, 1057, 49–57 (2004).
16. J.W. Dolan et al., J. Chromatogr. A, 1057, 59–74 (2004).
17. L.R. Snyder, J.W. Dolan and P.W. Carr, J. Chromatogr. A, 1060, 77–116 (2004).
18. D.H. Marchand et al., J. Chromatogr. A, 1062, 57–64 (2005).
19. D.H. Marchand et al., J. Chromatogr. A, 1062, 65–78 (2005).
20. J. Pellett et al., J. Chromatogr. A, 1101, 122–135 (2006).
21. D. Visky et al., Pharmeuropa, 14, 288–297 (2002).
22. T. Iványi et al., J. Chromatogr. A, 954, 99–114 (2002).
23. D. Visky et al., J. Chromatogr. A, 977, 39–58 (2002).
24. D. Visky et al., J. Chromatogr. A, 1012, 11–29 (2003).
25. P. Dehouck et al., J. Chromatogr. A, 1025, 189–200 (2004).
26. P. Dehouck et al., LCGC Eur., 17, 592–298 (2004).
27. D. Visky et al., J. Chromatogr. A, 1101, 103–114 (2006).
28. E. Haghedooren et al., Talanta, 71, 31–37 (2007).
29. E. Adams, E. Roets and J. Hoogmartens, J. Pharm. Biomed. Anal., 21, 715–722 (1999).
30. J. Diana et al., J. Chromatogr. A, 996, 115–131 (2003).
31. S. L. Morgan and S. N. Deming, J. Chromatogr., 112, 267–285 (1975).
32. W. Naidong et al., J. Planar Chromatogr., 5, 92–98 (1992).
33. E. Smet et al., Chirality, 13, 556–567 (2001).
34. P. Dehouck et al., LCGC Eur., 16, 764–771 (2003).


.png&w=3840&q=75)

.png&w=3840&q=75)


.png&w=3840&q=75)


.png&w=3840&q=75)


