Evaluation of Micro-Pillar Array Columns (µPAC) Combined with High Resolution Mass Spectrometry for Lipidomics
Special Issues
In the 21st century, numerous advances have been made in liquid chromatography (LC) column technology. The best known are columns packed with sub-2-µm porous particles or sub-3-µm superficially particles, and monolithic columns. Another very novel and original development is micro-pillar array columns (µPAC). µPACs are produced by a lithographic etching process to create a perfectly ordered separation bed on a silicon chip. Although the performance in terms of efficiency has been illustrated, the applicability for analysis of real complex samples has yet to be fully demonstrated. This article illustrates that state‑of‑the‑art µPAC columns coated with octadecyl are applicable for a challenging application such as lipidomics. The performance is illustrated with the analysis of human blood plasma lipids.
Omelchenko/Shutterstock.com

Koen Sandra1, Jonathan Vandenbussche1, Ruben t’Kindt1, Bo Claerebout2, Jeff Op de Beeck2, Wim De Malsche2,3, Gert Desmet2,3, and Pat Sandra1,1Research Institute for Chromatography (RIC) and Metablys, Kortrijk, Belgium, 2PharmaFluidics, Ghent, Belgium, 3Vrije Universiteit Brussel, Brussels, Belgium
In the 21st century, numerous advances have been made in liquid chromatography (LC) column technology. The best known are columns packed with sub-2-µm porous particles or sub-3-µm superficially particles, and monolithic columns. Another very novel and original development is micro-pillar array columns (µPAC). µPACs are produced by a lithographic etching process to create a perfectly ordered separation bed on a silicon chip. Although the performance in terms of efficiency has been illustrated, the applicability for analysis of real complex samples has yet to be fully demonstrated. This article illustrates that stateâofâtheâart µPAC columns coated with octadecyl are applicable for a challenging application such as lipidomics. The performance is illustrated with the analysis of human blood plasma lipids.
Lipidomics aims at the comprehensive and comparative analysis of lipids in biological samples and has the potential to impact on biomarker discovery, drug discovery and development, system knowledge, and other areas (1). In lipidomics, the researcher is confronted with a substantial complexity. To date, the LIPID MAPS Structure Database is populated with over 40,000 structures comprising fatty acids, glycerolipids, glycerophospholipids, sphingolipids, sterol lipids, prenol lipids, saccharolipids, and polyketides (2,3). The complexity of the lipidome arises through alterations in the nature of the head group (defining the lipid classes), the chain length of the individual aliphatic chains, the number, position, and stereochemistry of double bonds, hydroxyl groups and other functionalities in the individual aliphatic chains, and the nature of the covalent bond (ester, ether, vinyl ether) to the head group, to name just a few examples. It does not therefore come as a surprise that this also gives rise to various isomeric species.
As well as describing the lipidome in terms of numbers, it is important to realize that the different lipid species possess diverse physicochemical properties. Lipids span a substantial polarity and molecular weight (MW) range, with the sterol esters and triacylglycerols being very apolar and neutral, the glycerophospholipids more polar and charged, and the individual fatty acids being of lower molecular weight. On top of these complexities, one is inevitably confronted with a substantial dynamic range within biological matrices. One mL of human plasma, for example, contains lipids at a low femtomole level (eicosanoids) up to micromole level (cholesterol) (4).
In contemporary lipidomics, liquid chromatography (LC) combined with mass spectrometry (MS) is the principal enabling technology (1,5). The complexity of the sample under investigation evidently benefits from the use of highly efficient chromatographic separations combined with high resolution, accurate mass, and tandem mass spectrometry. Various reports describe the combination of either reversedâphase, normal-phase, or hydrophilic interaction liquid chromatography (HILIC) with MS for lipidomics (1). Normal-phase LC and HILIC typically distinguish lipid species according to their hydrophilic functionalities and, as such, resolve lipids in their representative classes. In reversed-phase LC, the separation is mainly based on the hydrophobic properties of lipids, in essence based on the number of carbons and the degree of saturation. The use of reversed-phase LC substantially increases the separation window for lipids compared to normal-phase LC or HILIC because the intrinsic hydrophilic content of the lipidome is poor compared to the hydrophobic content present. Reversed-phase LC is therefore the technique of choice in lipidomics and is commonly performed on micro-bore columns (1.0–2.1âmm internal diameter [i.d.]) packed with sub-2-µm porous particles or subâ3âµm superficially porous particles (SPPs) (1,6–8).
This article describes for the first time the use of micro-pillar array columns (µPAC) in the field of lipidomics. The origin of this technology dates back to the late 1990s when Regnier et al. addressed the problem of miniaturizing capillary electrochromatography (CEC) columns and introduced microfabricated supports as an alternative for the conventional packed beds (9,10). The theoretical benefit (reduction of the van Deemter A-term) of such supports was elucidated only a few years later by Knox (11). In the years to follow, Desmet et al. conducted several quantitative studies on Knox’s argumentation, taking a column filled with an array of pillars as a representative example (12). Finally in 2007, the first true proof-of-concept of micromachined LC columns operated by pressure-driven liquid flow, later termed micro-pillar array columns (µPAC), was reported (13).
The inherent high permeability and low “on-column” dispersion obtained by the perfect order of the separation bed makes µPAC-based chromatography unique and offers several advantages compared to conventional column technologies (packed beds and monoliths). The peak dispersion originating from heterogeneous flow paths in the separation bed is eliminated (no A-term contributions) and therefore components remain much more concentrated (sharp peaks) during separation. The freestanding nature of the pillars also leads to much lower back pressure, which allows the use of very long columns. These properties result in unparalleled chromatographic performance with high resolution and high sensitivity.
Materials and Methods
Materials: LC–MS-grade water, methanol, acetonitrile, ammonium formate, formic acid, trifluoroacetic acid, and HPLC-grade isopropanol were purchased from Biosolve, tertâbutyl methyl ether (MTBE; HPLCâgrade) from Sigma-Aldrich. The phenone mixture was composed of uracil, acetanilide, methyl-, ethyl-, propyl-, butyl-, pentyl-, hexyl-, and heptyl-phenyl ketone all purchased from Sigma-Aldrich. Lyophilized cytochrome c digest was from Thermo Fisher Scientific. Splash Lipidomix containing 15:0-18:1(d7) PC, 15:0-18:1(d7) PE, 15:0-18:1(d7) PS, 15:0-18:1(d7) PG, 15:0-18:1(d7) PI, 15:0-18:1(d7) PA, 18:1(d7) Lyso-PC, 18:1(d7) Lyso-PE, 18:1(d7) CE, 18:1(d7) MG, 15:0-18:1(d7) DG, 15:0-18:1(d7)-15:0 TG, 18:1(d9) SM, and cholesterol (d7) was acquired from Avanti Polar Lipids. Human blood EDTA plasma was obtained from healthy volunteers through venipuncture.
Sample Preparation: For the phenone mixture, the phenyl ketones (liquids) were first diluted in 50% (v/v) acetonitrile–H20 to obtain a 1000 ppm (µL/mL) concentration. Uracil and acetanilide (powders) were diluted accordingly (µg/mL). Equivalent volumes of the nine obtained solutions and an identical volume of solvent were mixed together to obtain a final concentration of 100 ppm per component.
Lyophilized cytochrome c digest was reconstituted in 200 µL 5:95% (v/v) acetonitrile–H20 with 0.05% (v/v) TFA, yielding a 8 pmol/µL concentration. This solution was vortexed and allowed to rest for 10 min. The sample was then further diluted to 500 fmol/µL in water with 0.05% (v/v) TFA.
The stock solution of the Splash Lipidomix at a total lipid concentration of 1 mg/mL in 100% methanol was used as such.
A 100-µL sample of human blood EDTA plasma was transferred into a 2-mL Eppendorf tube together with 300 µL of methanol. After mixing for 10 s, 1 mL of MTBE was added and the sample was incubated for 1 h at room temperature in a shaker. Phase separation was subsequently induced by adding 160 µL of water. After 10 min incubation at room temperature, the extract was centrifuged for 10 min at 1000 × g thereby generating a lower hydrophilic and upper lipophilic phase with a protein layer at the bottom. A 1-mL sample of the upper phase was removed and dried in a centrifugal vacuum evaporator. The dried sample was reconstituted in 90-µL 50:50% (v/v) MTBE–isopropanol and further diluted fourfold in methanol.
LC–UV: For µPAC performance evaluation, an Ultimate 3000 RSLCnano system (Thermo Fisher Scientific) equipped with UV detection was used. The phenone mixture and the cytochromce c digest were analyzed on a 200-cm C18 µPAC column (PharmaFluidics). The first mixture was injected at 100 µg/mL using a 4-nL injection valve (VICI AG International) and separated in gradient mode using 60-, 120-, and 180-min slopes from 2 to 78% acetonitrile with 0.1% formic acid. The flow rate was 500 nL/min, the column was maintained at 30 °C, and UV detection was performed at 260 nm making use of a 3-nL detection cell. The tryptic digest of cytochrome c was injected in full loop mode using a conventional 1 µL-loop configuration and separated in gradient mode using 60-, 120-, and 180-min slopes from 1 to 50% acetonitrile in 0.1% TFA. Flow rate was 300 nL/min, the column was maintained at 30 °C, and UV detection was performed at 214 nm making use of a 3-nL detection cell.
LC–MS: An Ultimate 3000 RSLCnano system (Thermo Fisher Scientific) was used for LC–MS measurements. Lipid extracts were analyzed on a 200-cm C18 µPAC column (PharmaFluidics) at 55 °C. Elution was performed with a linear gradient of (A) 20 mM ammonium formate pH 5 and (B) isopropanol–methanol (90:10 v/v), from 30% B to 98% B in 60-, 90-, or 120-min. The flow rate was 750 nL/min. An injection program allowed the introduction of 50 nL-sample in between two plugs of 30% mobile phase B. Loop size was 1 µL and samples were kept at 4 °C in the autosampler tray while waiting for injection.
High-resolution accurate mass measurements were obtained on an Agilent 6530 QTOF mass spectrometer (Agilent Technologies) equipped with a dual nano ESI source operated in both positive and negative electrospray ionization mode. The µPAC column was connected via a 30-µm i.d./280âµm o.d. fused silica capillary to a PicoTip emitter (15-µm tip i.d.–New Objective) via a true zero dead volume conductive union (UHâ634 stainless steel adapter from Idex). To connect the PicoTip emitter to the union, an F-330 blind fitting equipped with a M-125 perfluoroelastomer conductive ferrule was used (Idex). Capillary voltage was set at +2.4 kV and -2.6 kV for the positive and negative electrospray ionization mode, respectively. Drying gas flow rate and temperature were set at 4 L/min and 300 °C, fragmentor voltage at 150 V. The time-of-flight mass spectrometer (TOF-MS) was calibrated on a daily basis and subsequently operated at high accuracy (<5 ppm) without using reference masses. Data were collected in centroid mode at a rate of 2 spectra per s in the extended dynamic range mode (2 GHz), using two detector settings, offering a resolution of 9000 at m/z 622.0296. MS/MS experiments were performed in the data dependent acquisition (DDA) mode. One survey MS measurement was complemented with three data-dependent MS/MS measurements. Only singly charged precursor ions were selected based on abundance. After being fragmented twice, a particular m/z value was excluded for 30 s. Selecting the same m/z value twice increases the chance of measuring a particular precursor at its maximum intensity, while an exclusion time of 30 s allows MS/MS information on chromatographically resolved isomers to be obtained. The quadrupole was operated at medium resolution and the collision energy was fixed at 20 and 35 eV.
LC data were acquired in Chromeleon (Thermo Fisher Scientific) and MS data in MassHunter (Agilent Technologies). Data analysis was performed in MassHunter Qualitative Analysis as described in references 5–8.
Results and Discussion
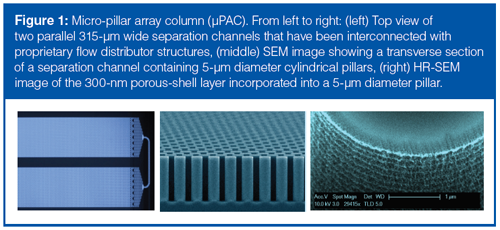
Physical Characteristics of the Used µPAC: µPAC separation beds are fabricated by carefully etching the interstitial volumes out of a silicon substrate following lithographic definition of an array of pillars. This creates a stationary phase support structure that is organized in a reproducible, perfectly ordered pattern. Concatenation of several of these channels allows long column lengths to be fabricated on a small footprint (14). The most important characteristics of the µPAC separation bed design are: pillar diameter: 5 µm, inter pillar distance: 2.5 µm, pillar length and bed depth: 18 µm, external porosity (Vinterstitial/Vtotal): 59%, bed channel width: 315 µm, and bed length: 200 cm. To increase the retentive surface, the pillars are rendered superficially porous with a typical porous shell thickness of 300 nm and pore sizes in the nm range. The porous surface has been uniformly modified with octadecyl alkyl chains to create a hydrophobic stationary phase suited for reversedâphase LC separations. Figure 1 shows some relevant characteristics of the microâpillar array column
Performance Testing of the Used µPAC: Because of the high permeability, the 200-cm column used in this study can be operated at moderate LC pump pressures (50–300 bar) over a wide range of flow rates (100–1000 nL/min). Van Deemter measurements with heptylâphenyl ketone demonstrated that a total of 400,000 theoretical plates could be generated at the optimal linear solvent velocity, corresponding to a flow rate of 200–250 nL/min and generating a column back pressure of only 70 bar. By increasing the flow rate up to 750 nL/min, efficiencies up to 200,000 theoretical plates could be achieved within 30 min at operating pressures well below 250 bar (mobile phase 50% acetonitrile with 0.1% [v/v] formic acid).
To also test the performance in gradient mode, two distinct test samples were injected on the µPAC column and peak capacity curves for both samples were determined. The first sample, the phenone mixture, was injected at 4 nL using a dedicated injection valve. The second sample, a tryptic digest of cytochrome c, was injected using a conventional 1-µL loop configuration. Both samples were separated in gradient mode using three different gradient slopes namely 60-, 120-, and 180-min. Peak capacities (nc) were calculated using the following equation:

[1]
in which ϖ is the average peak height at 13.4% of the baseline and tg is the gradient time.
Both chromatograms and the peak capacities plotted as a function of gradient time are shown in Figure 2.
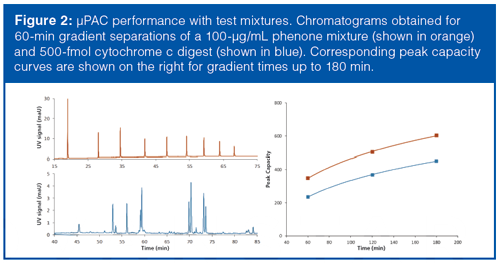
For the phenone mixture, peak capacities were 350 at a 60-min gradient time, 500 at a 120-min gradient time, and 620 at a 180-min gradient separation (flow rate of 500 nL/min). This means that there is a significant increase in peak capacity with decreasing gradient slope and increasing gradient time. Peak capacity values for the separation of cytochrome c digest were 240 at 60 min tg, 365 at 120 min tg, and 440 at 180 min tg.
Evaluation of µPAC Column in Lipidomics: For a chromatographic method to be successfully implemented in lipidomics, it needs to be designed to cover a substantial portion of the lipidome. In a series of papers, we described an LC–MS method allowing the coverage of a wide range of lipid classes using a column packed with porous sub-2-µm C18 particles (6–8). This method formed the basis for the analysis of lipids on the µPAC column. The main difference is a temperature of 55 °C for the µPAC column (maximum allowable temperature 60 °C), while for the sub-2-µm column a temperature of 80 °C was applied. The lower temperature needed a stronger eluent to elute all lipids and isopropanol was applied in mobile phase B instead of methanol.
Lipids and lipid extracts are typically dissolved and injected in solvents that accommodate elution on reversedâphase columns, for example, methanol, isopropanol, hexane, chloroform, and MTBE. Injecting 1 µL of lipid extracts on 2.1-mm i.d. columns operated at a flow rate of 500 µL/min can easily be achieved without deteriorating the separation. This, however, is not possible on miniaturized columns operated at low flow rate, such as 750 nL/min. Injection volumes had to be optimized for lipid separations and 50 nL appeared to be a good balance between sensitivity and peak width.
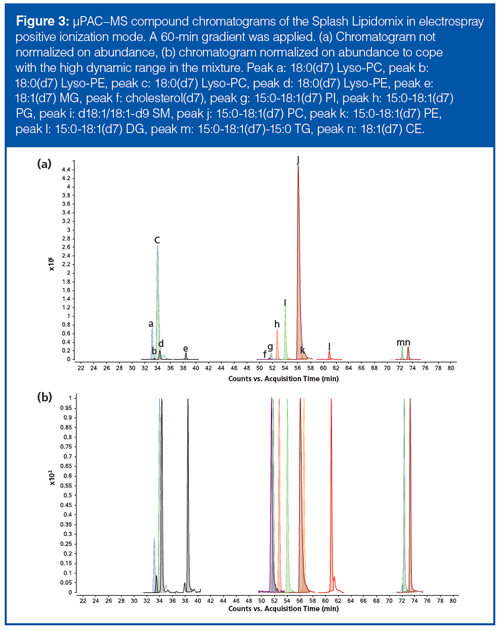
LC–MS compound chromatograms obtained in the positive ionization mode for the standard lipid mixture containing the major lipid classes at ratios relative to human plasma are shown in Figure 3. Lyso-glycerophospholids (Lyso-GPs) and monoglycerides (MGs) are clearly separated from the glycerophospholipids (GPs), sphingolipids (SPs), and diglycerides (DGs), which in their turn are cut off from the elution region of the more apolar lipids covering cholesterol esters (CEs) and triglycerides (TGs). The elution order of glycerolipids is MG < DG < TG. The latter lipid class has three fatty acids (FAs) that contribute to the interaction with the C18 stationary phase, in contrast to two and one FA group(s) for DGs and MGs, respectively. Likewise, Lyso- or monoacyl-GPs with one FA attached to the glycerol backbone elute earlier than diacyl-GPs because only one FA interacts with the stationary phase. The method furthermore allows to differentiate between different GP classes with identical fatty acid side chains, hence only differing in their characteristic polar head. Structural isomers resulting from the differential positioning of identical FAs onto the glycerol backbone (sn-1 or sn-2) are also resolved, as is clearly demonstrated for both the Lysoâphosphatidylcholines (LysoâPCs-peaks a and c) and Lyso-phosphatidylethanolamines (Lyso-PEs-peaks b and d). Under the conditions used, lyso-PCs, lysoâPEs, PC, PE, and sphingomyelin (SM) are detected as protonated ions [M+H]+, while phosphatidylglycerol (PG), phosphatidylinositol (PI), MG, DG, TG, CE, and cholesterol are detected as NH4- adducts [M+NH4]+.
As discussed above for the test samples, the gradient steepness is of utmost importance in tuning the peak capacity. This is illustrated in Figure 4, which shows the separation of MG, DG, and TG at a linear gradient of 60-, 90-, and 120-min. The peak capacities are 202 for 60 min, 267 for 90 min, and 315 for 120 min. Compared to the peak capacities for the cytochrome c tryptic digest, this is a slight reduction that can be attributed, on the one hand, to the higher flow rate (750 versus 300 nL/min) and, on the other, to the connecting tubing and zero dead volume union for MS hyphenation. Moreover, note that the elution window MG-DG is much larger than the DG-TG window. This is because the gradient is linear over the entire time while the elution strength of isopropanol is very strong at the end of the gradient. When detailed analysis of triglycerides is the aim of the analysis, such as in vegetable oil analyses, the gradient can be adapted and two different linear gradient slopes, namely from MG to DG (gradient slope 1) and from DG to TG (gradient slope 2), can be applied.
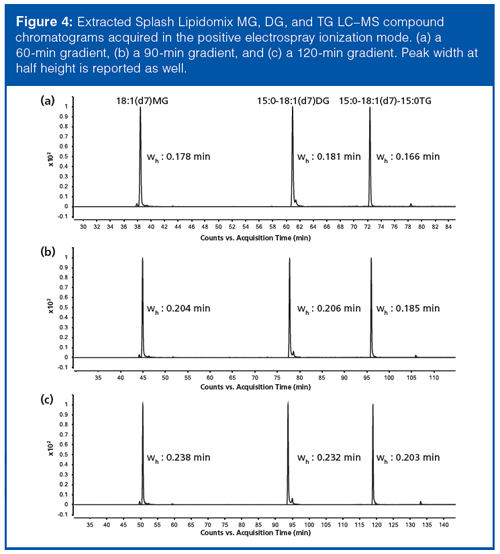
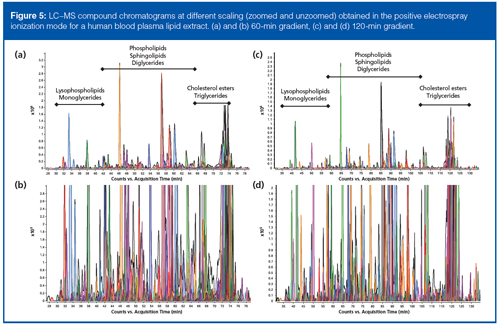
Figure 5 shows the LC–MS compound chromatograms of a human plasma lipid extract at two intensities obtained in the positive ionization mode using a 60-min gradient and a 120-min gradient. An enormous complexity is revealed, immediately illustrating the power of the µPAC–MS methodology. All major lipid classes are detected and their locations are shown on the chromatograms. The inter-class separation principles described for the standard lipid mixture are evidently maintained in the blood plasma lipid extract.
Next to the inter-class separation, the methodology provides intra-class separation based on the number of carbons and the degree of saturation in the fatty acid side chains. Figure 6(a) and 6(b) display different types of intra-class separation obtained on the µPAC column. The more carbon atoms, the more retention is observed (Figure 6[a]) for various Lyso-PE species, for example, Lyso-PE(16:0) (peaks 3 and 4) and Lyso-PE(18:0) (peaks 10 and 11). Lipids containing an equal carbon number but a different number of double bonds in the FA chain are also resolved as is illustrated for Lyso-PEs with a total carbon number of 18. The more double bonds a lipid contains, the earlier it elutes, for example, LysoâPE(18:2) (peaks 1 and 2) elutes before Lyso-PE(18:1) (peaks 5 and 6), which in turn elutes before Lyso-PE(18:0) (peaks 10 and 11). The existence of two peaks for every Lyso-PE with a given fatty acid composition can again be explained by the differential positioning of identical fatty acids onto the glycerol backbone. Positional isomers are thus baseline separated and isomers carrying the acyl substituent at the sn-2 position elute before their sn-1 counterparts. Isomers carrying the fatty acid at the sn-2 position are labelled as PE(0:0/16:0), PE(0:0/18:0), and so on. Those carrying the fatty acid at the sn-1 position as PE (16:0/0:0), PE(18:0/0:0), and so on.
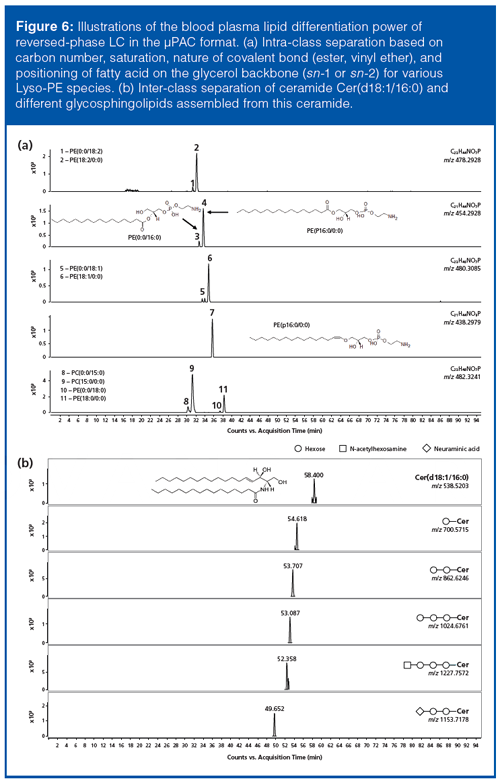
Peaks 8, 9, 10, and 11 show another level of isomer separations. Lyso-PC (15:0) and Lyso-PE (18:0) share the same molecular formula (C23H48NO7P), but their structural differences based on fatty acid composition and polar head group allow separation. Their identity could be inferred from MS/MS experiments in both positive and negative electrospray ionization mode.
The nature of the covalent bond (ester, ether, vinyl ether) of the fatty acid chain to the polar head group also has an influence on reversed-phase LC retention. For example, the vinyl ether group (plasmenyl phospholipid) makes the molecule more retentive (less polar) as shown for PE(p16:0/0:0) (peak 7) compared to PE(16:0/0:0) (peak 4).
Another intra-class separation of lipids present in human blood plasma involves the ceramide Cer(d18:1/16:0), and different glycosphingolipids assembled from this ceramide (Figure 6[b]). Chromatographic separation is related to the sugar moiety, that is, the more sugars that are attached to the ceramide backbone, the more polar the molecule, and the earlier the glycosphingolipids elute.
All these examples of intra-class separation correspond to lower abundant lipids in blood plasma, and subsequently the smaller peaks observed in Figure 5(a).
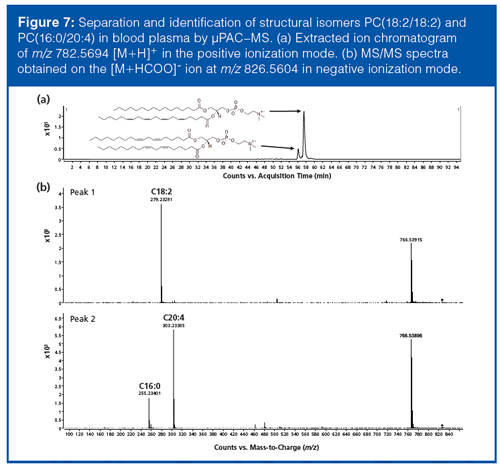
The mass spectrometric identification of structural isomers is further exemplified in Figure 7(a) for two baseline separated PC(36:4) isomers differing in their fatty acid content on the glycerol backbone: PC(18:2/18:2) and PC(16:0/20:4). The corresponding MS/MS data acquired in the negative ionization mode and an explanation for these structures are shown in Figure 7(b). The most intense ion-the neutral loss of a methyl group and a formate ion (note that PCs ionize as formate adducts in negative ionization mode)-is the same for both isomers, but the fragmented fatty acids differ, namely 279.2329 [M-H]-1 in the upper spectrum corresponding to linoleic acid (C18:2) and two fatty acid fragments, namely at 255.26472 [M-H]-1 for palmitic acid (C16:0) and 303.26603 [M-H]-1 for arachidonic acid (C20:4), in the lower spectrum explaining PC(18:2/18:2) and PC(16:0/20:4), respectively.
Conclusion
The first use of the µPAC column in lipidomics has been illustrated. In combination with high resolution mass spectrometry, high lipidome coverage can be obtained. Inter- and intra-class separation can readily be achieved and isomeric lipids can be resolved. This approach holds great potential in lipidomics studies.
Acknowledgement
The authors acknowledge the development team at PharmaFluidics for their continuous support.
References
- K. Sandra and P. Sandra, Curr. Opin. Chem. Biol.17, 847–53 (2013).
- E. Fahy, S. Subramanian, R.C. Murphy, M. Nishijima, C.R.H. Raetz, T. Shimizu, F. Spener, G. van Meer, M.J.O. Wakelam, and E.A. Dennis, J. Lipid Res.50, S9–S14 (2009).
- E. Fahy, D. Cotter, M. Sud, and S. Subramaniam, Biochim Biophys. Acta1811, 637–647 (2011).
- O. Quehenberger, A.M. Armando, A.H. Brown, et al., J. Lipid Res. 51, 3299–3305 (2010).
- K. Sandra, R. t’Kindt, L. Jorge, and P. Sandra in Metabolomics in practice: successful strategies to generate and analyze metabolic data, M. Lämmerhofer and W. Weckwerth, Eds. (Wiley-VCH Verlag GmbH & Co. KGaA, Weinheim, Germany, 2013) pp. 137–173.
- K. Sandra, A. dos Santos Pereira, G. Vanhoenacker, F. David, and P. Sandra, J. Chromatogr. A.1217, 4087–4099 (2010).
- R. t’Kindt, L. Jorge, E. Dumont, P. Couturon, F. David, P. Sandra, and K. Sandra, Anal. Chem.84, 403–411 (2012).
- R. t’Kindt, E.D. Telenga, L. Jorge, A.J. Van Oosterhout, P. Sandra, N.H. Ten Hacken, and K. Sandra, Anal. Chem.87, 4957–4964 (2015).
- B. He, N. Tait, and F. Regnier, Anal. Chem. 70, 3790–3797 (1998).
- F. Regnier, J. High Resol. Chromatogr.23, 19–26 (2000).
- J.H. Knox, J. Chromatogr. A.960, 7–18 (2002).
- P. Gzil, N. Vervoort, G. Baron, and G. Desmet, Anal. Chem.75, 6244–6250 (2003).
- W. De Malsche, H. Gardeniers, and G. Desmet, Anal. Chem.80, 5391–5400 (2008).
- W. De Malsche, J. Op de Beeck, S. De Bruyne, H. Gardeniers, and G. Desmet, Anal. Chem. 84, 1214–1219 (2012).
Koen Sandra is Scientific Director at the Research Institute for Chromatography (RIC, Kortrijk, Belgium).
Jonathan Vandenbussche is LC–MS technician at the Research Institute for Chromatography.
Ruben t’Kindt is Head of Omics at the Research Institute for Chromatography.
Bo Claerebout is R&D Engineer at PharmaFluidics in Ghent, Belgium.
Jeff Op de Beeck is Application Development Manager at PharmaFluidics.
Wim De Malsche is Associate Professor at the Department of Chemical Engineering at the Vrije Universiteit Brussel, Belgium, and co-founder of PharmaFluidics.
Gert Desmet is a Full Professor in Chemical Engineering at the Vrije Universiteit Brussel, and a co-founder of PharmaFluidics.
Pat Sandra is President of the Research Institute for Chromatography and Emeritus Professor at Ghent University (Ghent, Belgium).

New Method Explored for the Detection of CECs in Crops Irrigated with Contaminated Water
April 30th 2025This new study presents a validated QuEChERS–LC-MS/MS method for detecting eight persistent, mobile, and toxic substances in escarole, tomatoes, and tomato leaves irrigated with contaminated water.
Accelerating Monoclonal Antibody Quality Control: The Role of LC–MS in Upstream Bioprocessing
This study highlights the promising potential of LC–MS as a powerful tool for mAb quality control within the context of upstream processing.
University of Tasmania Researchers Explore Haloacetic Acid Determiniation in Water with capLC–MS
April 29th 2025Haloacetic acid detection has become important when analyzing drinking and swimming pool water. University of Tasmania researchers have begun applying capillary liquid chromatography as a means of detecting these substances.

.png&w=3840&q=75)

.png&w=3840&q=75)


.png&w=3840&q=75)


.png&w=3840&q=75)


