Essentials of LC Troubleshooting, Part 6: How Wide Should Those Peaks Be?
In this latest instalment of our series on recurring challenges in liquid chromatography (LC), we turn our attention to peak widths that are wider than expected. Estimating the expected peak widths can help determine when a column and LC system are not working quite right, and to decide when troubleshooting should be initiated.
Writing this “LC Troubleshooting” column and thinking about topics each month is interesting in the sense that there are some topics that just never get old. Whereas in the chromatography research world certain topics or ideas become obsolete as they are displaced by newer and better ideas, in the troubleshooting world there are certain topics that have remained relevant since the very first troubleshooting article appeared in this magazine (LC Magazine at that time) in 1983 (1). Over the last few years I’ve focused several “LC Troubleshooting” instalments on contemporary trends (such as the relatively recent advances in our understanding of the effects of pressure on retention [2]) in liquid chromatography (LC) that are affecting the way we approach our interpretation of LC results, and approach troubleshooting with modern LC instruments. With this month’s instalment, I am continuing a series I started in January 2022 (3) that is focused on some of the “bread and butter” topics of LC troubleshooting—those elements that are essential for any troubleshooter, no matter the vintage of the system we are working with. The topics at the heart of this series are highly related to LCGC’s well-known LC Troubleshooting wall chart (4) that hangs in many laboratories.
For the sixth instalment in this series, I’ve chosen to continue the discussion I started in September 2022 focused on problems related to peak shape and characteristics (5). Incredibly, the wall chart lists 44 different potential causes of bad peak shapes! In the aforementioned discussion, I dealt with what I would say are gross problems with peak shape—badly fronting or tailing peaks, “fuzzy” peaks, negative peaks, or even no peak at all. In this instalment, I will focus on the more subtle issue of how wide we should expect peaks to be when they appear to be relatively normal in all other respects. I hope LC users young and old will find some useful tips and reminders related to this important topic.
Everything is Possible
More and more I find myself responding to troubleshooting questions with “everything is possible”. This might seem like an easy out when considering observations that are hard to explain, but I find that this response is appropriate more often than not. While modern LC columns are incredibly powerful, and are the heart of any separation, they are also prone to sudden, unexpected, and sometimes spectacular failure. It may be unfair to the columns to always blame them first when things go wrong, but if they are not at the top of our list troubleshooting targets, they should be near the top of things to consider when the peaks in a chromatogram don’t look quite right.
What Is to Be Expected?
A critical step in any troubleshooting exercise, but one that I think is underappreciated, is recognizing that there is a problem to be solved. Recognizing that there is a problem usually amounts to recognizing that what is happening with the instrument is different from what is expected to happen, and our expectations are formed from theories, empirical knowledge, and experience (6). When we speak of “peak shape”, we are really referring not only to the shape of the peak (including, but not limited to, symmetric, asymmetric, smooth, shaggy, fronting, and tailing) but also to the width. Our expectations regarding the actual peak shape are straightforward. The textbook expectation, which is well supported by theory (7), is that, under most conditions, chromatographic peaks should be symmetric and consistent with the shape of a Gaussian distribution. Our expectations for the peak width are a more complicated matter, and they are the focus of this instalment. Peak width in any chromatogram is dependent on many factors, including the size and other physicochemical characteristics of the analyte; the mobile phase flow rate, temperature, and viscosity; and the particle size, pore structure, and chemistry associated with the stationary phase, as well as others. Understanding how these factors relate to peak widths is powerful because this allows us to estimate the widths we should observe. If what we observe does not match our expectation, or if we observe changes in peak widths over time, then there is reason to suspect some kind of problem with the column or system, giving us reason to think about starting to troubleshoot.
Essential Relationships
The following discussion assumes that we are considering reversed-phase LC, and primarily separations of small molecules. Similar relationships exist for other modes of separation (for example, hydrophilic interaction LC, or ion-exchange LC), but we restrict the scope of this particular discussion to reversed‑phase LC to make it manageable for a single instalment. I also point out here that sophisticated simulators for reversed-phase LC are freely available through the internet. One maintained by my research group is available as an application that runs in a web browser (https://www.multidlc.org/hplcsim), and is now available in several languages; one developed by Davy Guillarme’s group is available as a downloadable Excel-based application (https://ispso.unige.ch/labs/fanal/practical_hplc_simulator:en). These tools take care of all the maths for you, and they allow quick and easy manipulation of many of the variables discussed below. The discussion here is intended to help users understand the essential relationships that form the basis of the results we see with these simulators.
Isocratic Elution: The simplest place to begin a discussion on peak width is to consider isocratic conditions—conditions where the mobile phase composition is not deliberately changed during the analysis. In this case, in approximate terms, the more time the analyte spends in the column, the wider its peak is at the detector. One way of expressing this is shown in equation 1, where w is the 4∙σ width of the peak (drawn at about 13.4% of the peak height); N is the plate number (chromatographic efficiency); tm is the column dead time; and k is the isocratic retention factor of the analyte for a given mobile phase composition:

Estimation of the column dead time is straightforward, and is nominally constant for a given column at a given flow rate. What is more interesting is to consider the effects of N and k on the width, and how these relate to the other parameters listed above (for example, analyte size). Estimating the plate number requires some knowledge about the extent to which peaks broaden when the flow rate changes. We start with what we refer to as the reduced form of the van Deemter equation, which relates the plate height to the mobile phase velocity (equation 2).

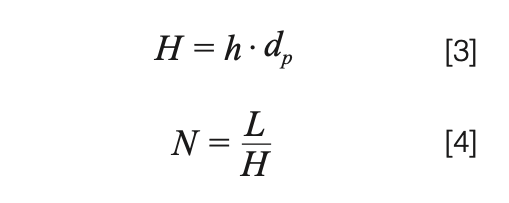
Here, νe is the reduced interstitial mobile phase velocity, and h is the reduced plate height. The LC simulators referred to earlier will calculate the reduced velocity when given inputs of column dimensions, flow rate, particle size, and an analyte diffusion coefficient. The important thing to recognize here is that this velocity is dependent on analyte size, as the rate at which the analyte diffuses in the mobile phase affects the reduced velocity; generally speaking, at a given mobile phase flow rate, the reduced velocity increases with the increasing molecular weight of the analyte. One of the advantages of using the reduced form of the van Deemter equation (equation 2) is that the coefficients A, B, and C are nominally independent of factors like particle size. In our work, we typically use values of 1.0, 5.0, and 0.05 for A, B, and C. Of course, these values are not truly constant, but they are good numbers to use to get an approximate value of the plate number under a given set of conditions. Readers interested in learning more about details related to these parameters are referred to several recent articles (8–10). After calculating the reduced plate height, h, we can calculate the non-reduced plate height H, and finally the plate number using equations 3 and 4, where dp is the particle size, and L is the column length.

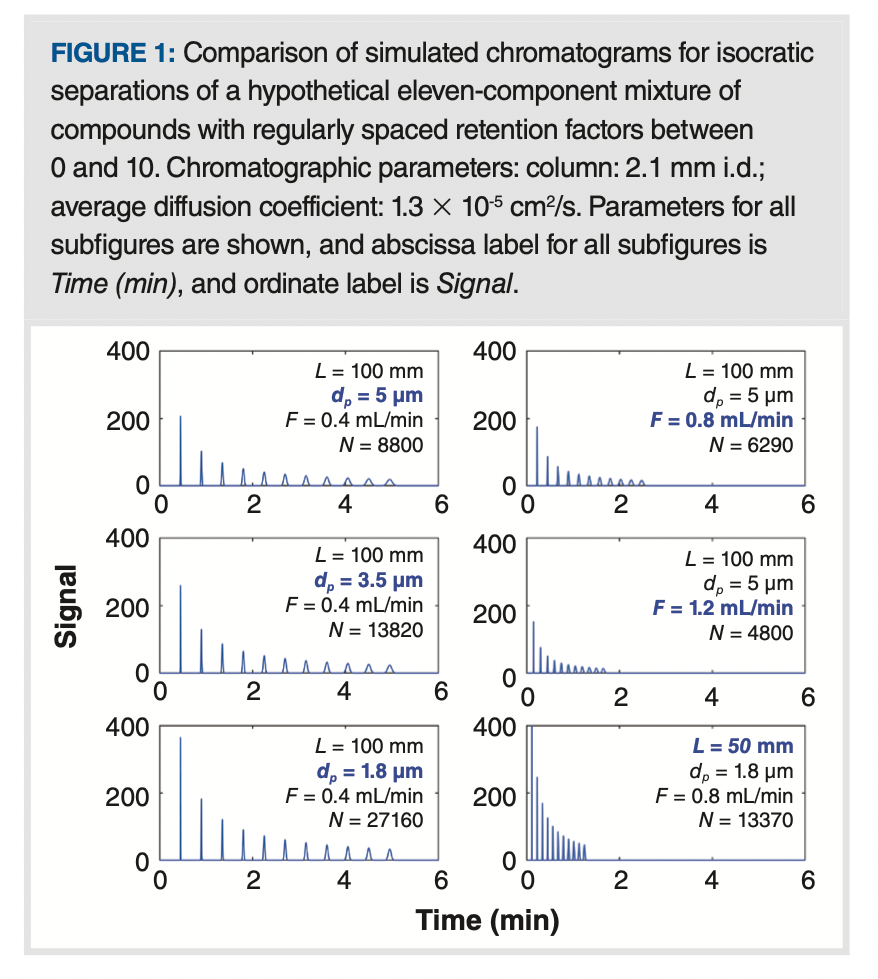
Figure 1 shows simulated chromatograms calculated using these steps for different combinations of particle size, flow rate, and column length. The main point of this comparison is that the trend in relative peak widths within a single chromatogram is primarily determined by retention—that is, within a given chromatogram, a peak eluting with a retention factor of 10 is approximately 10 times wider (and thus 10 times shorter) than a peak eluting with a retention factor of 0 (that is, at the dead time). This ratio is the same no matter the choices of particle size, column length, and flow rate. When these variables are changed the absolute values of the peak widths change, but the trend in relative widths does not change. This is a hallmark of isocratic elution—that we should expect more retained peaks to be wider than less retained peaks, and the degree of the change in widths is at least approximately predictable using simple tools.

Gradient Elution: When working with gradient elution conditions we have an expression for peak width that is similar to equation 1, with two important differences. As shown in equation 5, we replace k with ke, and add the term G. We refer to ke as the local retention factor of the analyte in the mobile phase it experiences, as it is exiting the column.

We refer to G as the gradient compression factor, which accounts for the fact that when an analyte is eluted in a gradient, the rear of the peak (pump side) moves at a slightly higher velocity than the front of the peak (detector side), causing the peak to narrow slightly. We are not going to spend time discussing this factor here because under most practical conditions, it does not affect the peak width by more than approximately 10%. Readers interested in learning more about this are referred to Snyder and Dolan’s book on gradient elution LC (11). Relatively speaking, the influence of ke on peak width in gradient elution separations is much more important than G. Moreover, the value of ke is strongly affected by the gradient slope (b), which quantifies the rate of change of the mobile phase composition during the gradient. This relationship is shown in equation 6, where ∆φ is the change in the volume fraction of organic solvent in the mobile phase (0–1 scale for reversed-phase LC), and tg is the gradient time (note: b has no units!)

Generally speaking, larger gradient slopes lead to smaller ke values, and thus narrower peaks. The gradient slope increases with ∆φ or the dead time, and decreases as the gradient time is increased. The other parameter in equation 6, S, is related to the sensitivity of the retention of a given analyte to the mobile phase composition. The simplest way to understand this parameter is that it is the negative of the slope of a plot of the natural logarithm of retention factor (ln[k]) of the analyte as a function of the mobile phase composition (0–1 scale). This particular relationship is an outcome of what has become known as Linear Solvent Strength Theory (LSST). Given the involvement of S in equation 6, we see that the gradient slope that impacts the value of ke can be very different for two analytes with different S values, even if all the other parameters (∆φ, tm, tg) are exactly the same. I think this is counterintuitive for those new to gradient elution, and can lead to some real surprises when thinking about what to expect for peak widths under different conditions, and for different analytes. If the value of S is known, then the value of ke is given by equation 7, where ki is the retention factor of the analyte in the mobile phase used at the starting point in the gradient elution program.

Interestingly, when td << tm, and b·ki >>1 large, ke is approximately 1/b.
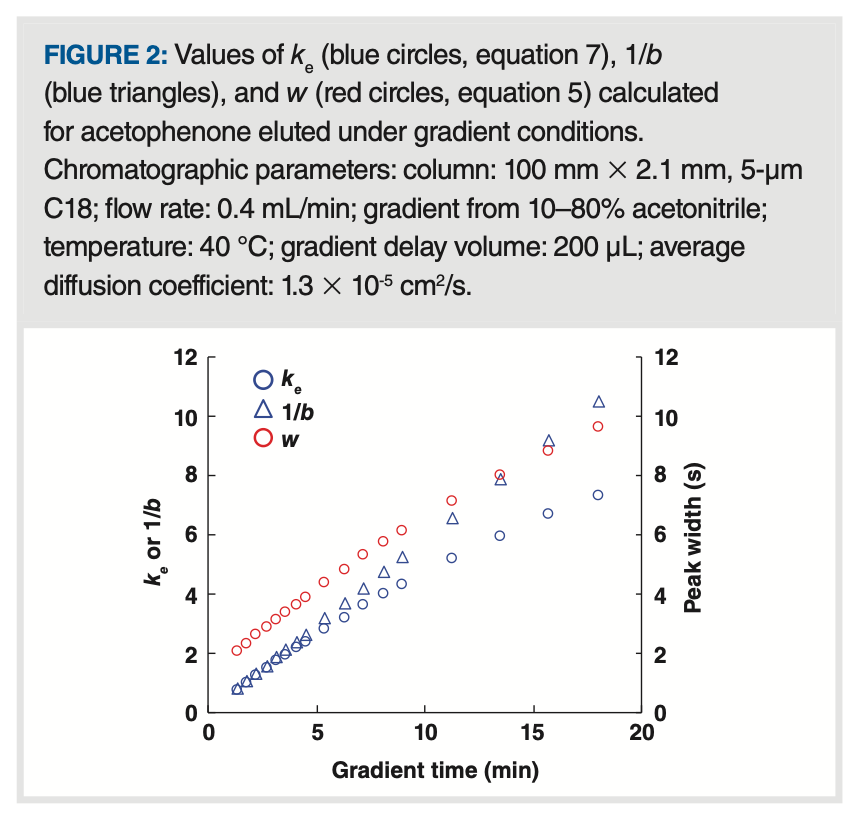
A representative calculation will illustrate how dramatically the gradient elution conditions can affect the peak width. The values of ln(kw) (the y-intercept of a plot of ln[k] vs. φ) and S for the small molecule acetophenone are 3.82 and 6.35, respectively (C18 column, acetonitrile–water mobile phase, at 40 °C; see https://www.multidlc.org/hplcsim for more values like this for other molecules). Figure 2 shows that the magnitude of ke changes by about a factor of 10 as the gradient time is increased from 1.4 to 18 min. This, in turn, results in an increase in the peak width (as expected from equation 5), but only by about a factor of five. Figure 2 also shows that the simple ratio 1/b is a good approximation for ke, particularly at low tg (and thus large b).

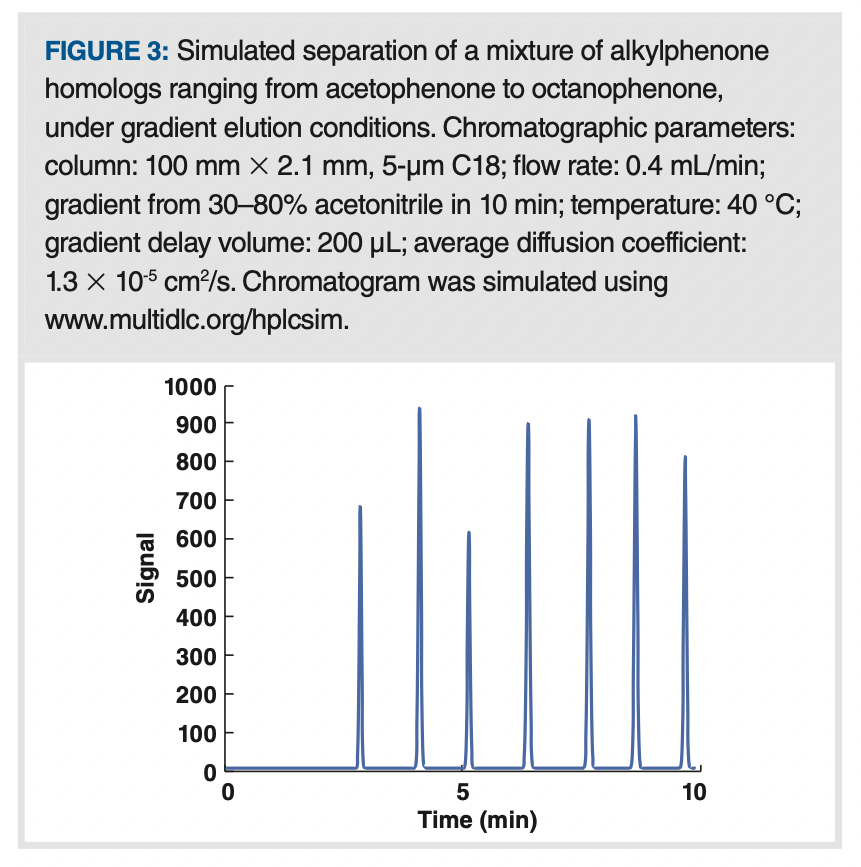
The results in Figure 2 show that ke can vary dramatically depending on the gradient conditions and thus result in very different peak widths. However, this is not always the case. Figure 3 shows a simulated chromatogram for a mixture of alkylphenone homologs ranging from acetophenone to octanophenone. In this case, the peak widths are similar for all of the compounds, even though they are eluted at very different points in the gradient. This is because the ke values are very similar for all of the compounds, covering the narrow range of 3.8 to 5.2 (compared to the range of 0.7 to 7.3 in Figure 2).

What About Large Molecules?
The larger size of molecules such as organic polymers and biopolymers (including proteins and oligonucleotides) compared to the small molecules discussed here has two main implications for the estimation of peak width discussed in this instalment. First, they diffuse much slower in solution, which generally leads to lower plate numbers. Second, their retention is generally much more strongly dependent on mobile phase composition (that is, larger S values, sometimes exceeding 100). This, in turn, results in low ke values (<2) for these molecules under a wide range of elution conditions, which provides the potential for narrow peaks. These two effects—slower diffusion leading to low plate numbers, and larger S values leading to low ke values—offset each other in many situations. We will take up a more detailed discussion of these effects in a future instalment of “LC Troubleshooting”.
When the Instrument Adds to the Peak Width
In 2021, Ken Broeckhoven and I wrote a series of four “LC Troubleshooting” articles focused on providing an update on the factors that affect broadening of peaks outside of the chromatography column—so-called “extracolumn broadening” or “extracolumn dispersion” (ECD) (12–15). Our aim was to provide a means to quantitatively estimate the contributions of different parts of a LC system (that is, injector, connecting tubing, and so on) to the total widths of peaks observed at the detector. Through a series of examples, we showed how the apparent performance of a high quality column can be severely compromised—not due to actual poor performance of the column itself, but due to the broadening of peaks in the instrument components. Readers interested in the details are referred to this series of articles, and a freely available, web‑based calculator that can help with the maths involved (https://www.multidlc.org/dispersion_calculator/). These issues are particularly relevant to the discussion here about estimating peak widths, especially for gradient elution separations or early‑eluted peaks under isocratic conditions, because the low k values can lead to very narrow, low volume peaks that are highly susceptible to extracolumn dispersion.
What To Do When the Peak Widths Are Not As Expected?
In my laboratory, we consider the following possibilities when we suspect that a column is producing peaks that are wider than expected.
- Do a health check on the column.
As shown in equations 1 and 5 above, the peak widths we can expect under both isocratic and gradient elution conditions are dependent on the plate number of the column, which can be measured under isocratic conditions. We do these checks with simple, small, neutral molecules to avoid poor plate numbers that can arise from deleterious interactions between analytes and the stationary phase. The measured isocratic efficiencies should be similar to those reported by the manufacturer on their quality control (QC) sheet. If not, then either something is wrong with the column, or something is wrong with the instrument used to make the measurement. - Consider the possibility that wide peaks are due to chemical problems.
Analyte-specific problems, such as slow desorption kinetics and mass overload, can lead to peak tailing and wider-than-expected peaks. If one observes that some peaks in a chromatogram are much wider than others, this can be an important clue that something is not going well in a chemical sense. Readers interested in these issues are referred to a recent “LC Troubleshooting” article on this topic (16). - Check to make sure that the system is not the problem.
As discussed above, peak dispersion in LC components other than the column can make the performance of a column look much worse than it actually is. A quick way to check for this possibility is to move the column in question to a different system that is known to have low extracolumn dispersion. If the column produces the expected peak widths in this second system, then this is a clue that the wide peaks observed with the first system are not due to the column, but rather the instrument itself.
Summary
In this sixth instalment on essential topics in LC troubleshooting, I have discussed the essential relationships that can be used to estimate expected peak widths for a given set of chromatographic conditions, including both isocratic and gradient elution. By using these estimated peak widths, one can detect when a column or system is not producing peak widths as expected, and initiate the troubleshooting process to determine why the peaks are wider than expected. This discussion has been focused on peak width estimates for small molecules (that is, less than 500 Da); a further discussion of details related to separations of larger molecules including biopolymers will be handled in a future instalment of “LC Troubleshooting”.
References
- Runser, D. LC Magazine 1983, 1, 10–16.
- Kempen, T.; Stoll, D. R. Retention Factor is Independent of Pressure in Liquid Chromatography, Right? LCGC Europe 2021, 34, 471–475.
- Stoll, D. R. Essentials of LC Troubleshooting, Part 1: Pressure Problems. LCGC Europe 2022, 35, 16–20.
- LCGC Troubleshooting Wallchart, (n.d.). https://www.chromatographyonline.com/ view/troubleshooting-wallchart.
- Stoll, D. R. Essentials of LC Troubleshooting, Part 3: Those Peaks Don’t Look Right. LCGC Europe 2022, 35, 325–329. DOI: 10.56530/lcgc.na.az3781g7
- Stoll, D. R. Some Essential Principles of Effective Troubleshooting. LCGC North Am. 2020, 38, 505–509.
- Felinger, A. Models of Chromatography. In Data Analysis and Signal Processing in Chromatography, Elsevier, 1998; pp. 43–96.
- Carr, P. W.; Stoll, D. R. Speed and Performance. in Liquid Chromatography. In Multi-Dimensional Liquid Chromatography: Principles, Practice, and Applications, CRC Press, 2022.
- Cabooter, D.; Song, H.; Makey, D.; et al. Measurement and Modelling of the Intra-Particle Diffusion and b-term in Reversed-Phase Liquid Chromatography. J. Chromatogr. A 2021, 1637, 461852. DOI: 10.1016/j.chroma.2020.461852.
- Desmet, G.; Song, H.; Makey, D.; Stoll, D. R.; Cabooter, D. Experimental Investigation of the Retention Factor Dependency of Eddy Dispersion in Packed Bed Columns and Relation to Knox’s Empirical Model Parameters. J. Chromatogr. A 2020, 1626, 461339. DOI: 10.1016/j.chroma.2020.461339.
- Snyder, L. R.; Dolan, J. W. Theory and Derivations. In High-Performance Gradient Elution: The Practical Application of the Linear-Solvent-Strength Model, John Wiley, 2007; pp. 370–404.
- Stoll, D. R.; Lauer, T. J.; Broeckhoven, K. Where Has My Efficiency Gone? Impacts of Extracolumn Peak Broadening on Performance, Part 4: Gradient Elution, Flow Splitting, and a Holistic View. LCGC Europe 2021, 34, 464–469.
- Stoll, D. R.; Broeckhoven, K. Where Has My Efficiency Gone? Impacts of Extracolumn Peak Broadening on Performance, Part 3: Tubing and Detectors. LCGC Europe 2021, 34, 277–280.
- Stoll, D. R.; Broeckhoven, K. Where Has My Efficiency Gone? Impacts of Extracolumn Peak Broadening on Performance, Part 2: Sample Injection. LCGC Europe 2021, 34, 232–237.
- Stoll, D. R.; Broeckhoven, K. Where Has My Efficiency Gone? Impacts of Extracolumn Peak Broadening on Performance, Part 1: Basic Concepts. LCGC Europe 2021, 34, 181–188.
- McCalley, D. V.; Stoll, D. R. But My Peaks Are Not Gaussian! Part 3: Physicochemical Causes of Peak Tailing. LCGC Europe 2021, 34, 508–511.
Dwight R. Stoll is the editor of “LC Troubleshooting”. Stoll is a professor and the co-chair of chemistry at Gustavus Adolphus College in St. Peter, Minnesota, USA. His primary research focus is on the development of 2D-LC for both targeted and untargeted analyses. He has authored or coauthored more than 75 peer-reviewed publications and four book chapters in separation science and more than 100 conference presentations. He is also a member of LCGC’s editorial advisory board. Direct correspondence to: amatheson@mjhlifesciences.com

New Method Explored for the Detection of CECs in Crops Irrigated with Contaminated Water
April 30th 2025This new study presents a validated QuEChERS–LC-MS/MS method for detecting eight persistent, mobile, and toxic substances in escarole, tomatoes, and tomato leaves irrigated with contaminated water.
University of Tasmania Researchers Explore Haloacetic Acid Determiniation in Water with capLC–MS
April 29th 2025Haloacetic acid detection has become important when analyzing drinking and swimming pool water. University of Tasmania researchers have begun applying capillary liquid chromatography as a means of detecting these substances.
Prioritizing Non-Target Screening in LC–HRMS Environmental Sample Analysis
April 28th 2025When analyzing samples using liquid chromatography–high-resolution mass spectrometry, there are various ways the processes can be improved. Researchers created new methods for prioritizing these strategies.

.png&w=3840&q=75)

.png&w=3840&q=75)


.png&w=3840&q=75)


.png&w=3840&q=75)


