Equivalent Column Selection in HPLC
The Column
High performance liquid chromatography (HPLC) methods are used today to control the quality of many chemical and pharmaceutical products. The methods are usually developed by optimizing the properties of the mobile phase with a specific column. However, if the original column is no longer in production, the result will often change when a different column is used. In this case, we were interested in finding one or two equivalent columns that can replace the original column without changes in selectivity and robustness. This study demonstrates a new way to compare columns and select suitable replacement columns. The presented method will also allow the evaluation of different columns with the same method, as well as the evaluation of the robustness of the common method with different columns.
Photo Credit: antishock/Shutterstock.com

Hans-Jürgen Rieger and Imre Molnár, Molnár-Institute, Berlin, Germany
High performance liquid chromatography (HPLC) methods are used today to control the quality of many chemical and pharmaceutical products. The methods are usually developed by optimizing the properties of the mobile phase with a specific column. However, if the original column is no longer in production, the result will often change when a different column is used. In this case, we were interested in finding one or two equivalent columns that can replace the original column without changes in selectivity and robustness. This study demonstrates a new way to compare columns and select suitable replacement columns. The presented method will also allow the evaluation of different columns with the same method, as well as the evaluation of the robustness of the common method with different columns.
Some method validation reports suggest that searching for an equivalent column to replace the original reference column with the ability to fulfil nearly the same quality of separation is important. This may be necessary because occasionally the original column is no longer available on the market. Finding an equivalent column can be difficult because the same type of column from a different manufacturer, or even different batches of the same material from the same manufacturer, can result in different chromatographic selectivities (1).
There are several approaches to select equivalent columns. The most wellâknown is the Snyder-Dolan Hydrophobicity Subtraction Database (SDHSDB) (1); others include the Tanaka approach (2) and the USP database (3). These three approaches characterize stationary phases based on a fixed sample mixture measured under fixed experimental conditions. Unfortunately, this can occasionally lead to unexpected results if two “similar” columns are used with a given sample under a given set of experimental conditions.
In this article, a novel approach to find an equivalent column for a reference column using modelling software based on the approach described in reference 4 is discussed. This approach is precise in its predictions and fulfills quality by design (QbD) criteria, which means the tolerance limits of the method are tested. It uses a critical resolution cube (CRC) to characterize peak movements with a large number of different columns for a given sample, leading to a better understanding of the factors and their variabilities that influence the chromatographic separation.
Experimental
Two different C18 columns were used in all experiments: a 75 × 4.6 mm, 3-μm ACE Excel 3 C18-PFP column, and a 50 × 4.6 mm, 2.7-μm HALO C18 column (both MacMod).
Eluent A was water buffered with 10 mM formic acid to pH 2.0. Eluent B was varied between acetonitrile (B1) and methanol (B2). Flow rate (F) was 1.0 mL/min.
High performance liquid chromatography (HPLC) separations were performed on an LC-2010C system with UV detection at 254 nm, data collection, peak integration, and evaluation were done using LabSolution 4.5 (all ShimadzuâEurope). Peak tracking and method modelling were done with DryLab4 using the robustness module and the knowledge management module (version 4.3, Molnár-Institute, Berlin).
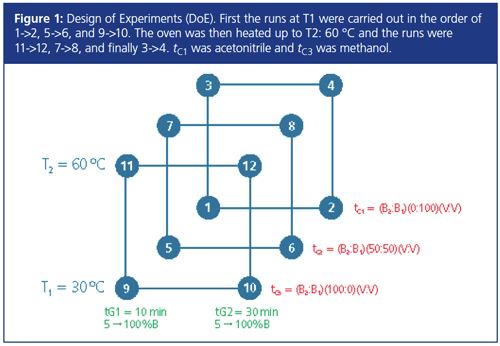
The experimental design (DoE) for simultaneous optimization of gradient time (tG), temperature (T), and ternary composition (tc) required 12 experiments as illustrated in Figure 1. The injection volume was 2 μL.

Results and Discussion
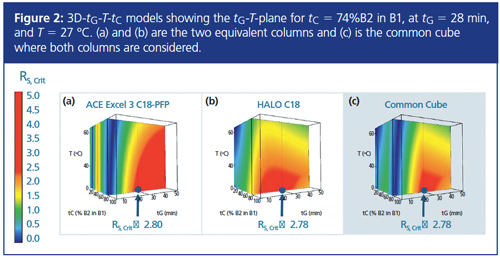
Establishing a Common Working Point: Twelve experiments on each column were completed in accordance to the DoE (Figure 1), allowing two three-dimensional (3D) resolution models (“cubes”) for each column to be calculated (Figure 2). After that, a “common cube” was established automatically from the two cubes by taking at the same point (the same combination of tG, T, and tc) the smallest critical resolution value (Rs,crit) from the two cubes.
The two cubes and their common cube at the tG–T–plane for tc = 74% (B2 in B1) = (26:74) (v/v) acetonitrile–methanol are illustrated in Figure 2. The common cube was calculated using a proprietary algorithm. Within this cube, an optimum “common working point” (CWP) for both columns could be localized. The CWP is at that point the one with the highest Rs,crit within the common cube. It was found at CWP = (tG = 28 min, T = 27 °C, tc = 74% B2 in B1) with Rs,crit = 2.78 (Figure 2).

Each point within a cube corresponds to a precisely modelled chromatogram, and each cube represents more than a million virtual experiments. Red areas within the cubes indicate that the analytical target profile (ATP), the critical resolution, was above or equal to 2.5 (Rs,crit ≥ 2.5)-indicating what could be achieved. Blue areas indicate coelution of critical band pairs (Rs,crit = 0). The CWP is marked with a node and an arrow.
Evaluating the Robustness of the Common Working Point on Both Columns: The robustness of a method is defined by the ICH as the method’s capability to remain unaffected by small variations in the selected conditions.
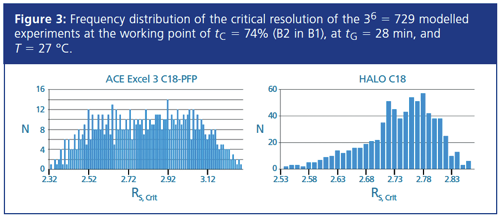
Six method parameters tG, T, tc, F, Start %B, and End %B were assessed for the calculations. For this study three distinct values for the level of each parameter at, above, and below the selected point (tolerance limits: 0.0, +1.0, -1.0 for tG [min], T [°C], Start %B, and End%B [%], and 0, +0.1, -0.1 [mL/min] for F) were used. The required critical resolution (as the ATP) was set to Rs,crit = 2.0. The robustness software module calculated a chromatogram for every possible combination of the variables and their tolerance limits. Since six parameters were used for the robustness testing, the total number of modelled experiments was equal to 36 = 729. The calculation of the robustness success rate was done in 15 s.
Figure 3 shows the results of the robustness testing for the two columns at the CWP. All 729 modelled experiments on each column were above the required resolution. As such, both columns had a 100% success rate. Furthermore, Figure 4 shows the comparison between the predicted and experimental retention times at the CWP.

Summary
It is possible to develop an HPLC method to be used on different equivalent columns with the selected ATP according to QbD principles. In addition, the robustness of each column was tested with good success at the CWP for robust routine quality control of drug products. The use of different column chemistries will increase the purchase of columns to achieve the maximum on robustness in routine quality control according to QbD.
Acknowledgement
The authors thank the Shimadzu Europe Corporation (Duisburg, Germany) for their support with the HPLC instruments and MAC-MOD Analytical Inc. (USA) for providing columns for this work. Both authors are thankful to Dipl. math. Santoso Idris for excellent mathematical conceptions in the development work on the above project.
References
- L.R. Snyder, J.W. Dolan, and P.W. Carr, Journal of Chromatography A 1060, 77–116 (2004).
- M.R. Euerby, M. James, and P. Petersson, Journal of Chromatography A 1228, 165–174 (2012).
- USP-Database. (Online). Available: http://apps.usp.org/app/USPNF/columnsDB.html (accessed April 2016).
- R. Kormány, I. Molnár, and H.-J. Rieger, Journal of Pharmaceutical and Biomedical Analysis80, 79–88 (2013).
Imre Molnár is founder and president of Molnár-Institute for Applied Chromatography. Holding a Dr.rer.nat degree from Universität des Saarlandes, Dr. Molnár worked as a postdoc in the research team of Csaba Horváth at Yale University, resulting in numerous publications such as the theory of solvophobic interactions, the fundamentals in reversed phase chromatography. After returning to Europe he founded the Institute for Applied Chromatography in Berlin in October 1981. Since 1986, together with Lloyd Snyder and John Dolan, he focused on in-silico method development in HPLC resulting in the software DryLab. Since then, more than 200 published peer-reviewed papers have been released on DryLab’s scientific and industrial application.
Hans-Jürgen Rieger holds a Dr.rer.nat. in physical chemistry from the Free University Berlin and is a specialist in HPLC modelling. Having spent two years in Prof. Dr. Rüchardt’s group in Freiburg, he joined the MolnárâInstitute in 1999 and gained extensive theoretical and practical knowledge in the technique of HPLC. He is vice president and product manager, and is responsible for software programming. In cooperation with Dr. Molnár, he develops new modules of DryLab, such as the additional tools Peak Match, the Cube, and the Robustness module for better peak tracking, visualizing the design space for quality by design, and robustness calculations as well as the Knowledge Management Documentation. He also teaches DryLab courses on an international scale.
E-mail:info@molnar-institute.comWebsite:www.molnar-institute.com

New Study Reviews Chromatography Methods for Flavonoid Analysis
April 21st 2025Flavonoids are widely used metabolites that carry out various functions in different industries, such as food and cosmetics. Detecting, separating, and quantifying them in fruit species can be a complicated process.
Extracting Estrogenic Hormones Using Rotating Disk and Modified Clays
April 14th 2025University of Caldas and University of Chile researchers extracted estrogenic hormones from wastewater samples using rotating disk sorption extraction. After extraction, the concentrated analytes were measured using liquid chromatography coupled with photodiode array detection (HPLC-PDA).

.png&w=3840&q=75)

.png&w=3840&q=75)


.png&w=3840&q=75)


.png&w=3840&q=75)


