Enhanced Sample Throughput for Environmental Analysis
LCGC North America
As environmental legislation becomes more stringent, the need to deliver quantitative results in shorter times and greater volumes is necessary for routine environmental analysis. Most of the high-throughput screening methods used to analyze pharmaceutical compounds are, however, useless for environmental monitoring. This is because these methods primarily aim to retrieve as much information from a single sample using the broadest range of techniques. The chromatographic separation process is considered to be the bottleneck in the process. This is not the situation for environmental procedures, in which the bottleneck is the sample preparation step and is usually very tedious and time-consuming.
As environmental legislation becomes more stringent, the need to deliver quantitative results in shorter times and greater volumes is necessary for routine environmental analysis. Most of the high-throughput screening methods used to analyze pharmaceutical compounds are, however, useless for environmental monitoring. This is because these methods primarily aim to retrieve as much information from a single sample using the broadest range of techniques. The chromatographic separation process is considered to be the bottleneck in the process. This is not the situation for environmental procedures, in which the bottleneck is the sample preparation step and is usually very tedious and time-consuming.

The complex character of sample preparation arises from the diversity in what is designated a "routine environmental sample." Samples are obtained from various sources with highly different composition and target analytes present at concentration levels ranging from ultratrace to the percentage level. High-throughput screening is, therefore, not considered a valuable option to increase productivity in environmental analysis and traditional technologies, such as Soxhlet extraction, liquid–liquid extraction (LLE), and column chromatography remain commonplace. Some progress has been made, however, with the introduction of techniques such as pressurized solvent extraction, solid-phase extraction (SPE), and miniaturized LLE, but these techniques do not entirely remove the bottleneck from sample preparation or address the need for high-throughput for routine environmental monitoring.
General Considerations
Because environmental sample preparation most often accounts for the main portion of total sample process time, typical optimization strategies are aimed primarily at reducing overall sample preparation time and procedural complexity. The first thing to do when redesigning a method is to thoroughly delineate the bottleneck of the procedure. Possible solutions can then be proposed and assessed, if necessary. Fortunately, routine methods for environmental sample preparation usually share several of the same time-consuming steps, such as extraction, clean-up, and evaporative preconcentration, so that the overall armoury of feasible methodological adjustments is rather limited. The option or combination of options that is finally opted for largely depends on the application, the available instrumentation and financial resources and, more often than not, the personal preference of the person responsible for method redevelopment. Some common throughput enhancement strategies are summarized in Table I.

Table I: Common strategies to accelerate sample preparation
Fast Chromatography
Environmental methods do exist in which chromatography and not sample preparation is the rate-determining step. Under these circumstances, the only viable option to increase overall method performance is to accelerate the chromatographic separation process.
Over the last couple of years, fast chromatographic separations have been an exciting topic of research, and numerous methods have been described in literature covering both gas chromatography (GC) and liquid chromatography (LC) separations. Reduction of GC analysis time is desirable in routine environmental analysis. Replacing the standard column, which usually has an internal diameter of 250 μm or 320 μm, with a narrow-bore alternative is the easiest way to do this. All major column vendors now provide narrow-bore columns in various lengths, with internal diameters ranging from 100 to 200 μm and coated with a broad selection of stationary phases.
Vacuum outlet technology or low pressure GC is a promising technique to increase sample throughput (1). Narrow-bore fast GC can be performed on any type of GC detector with a sufficient acquisition rate. Vacuum outlet technology, however, requires the pumping capacity of the mass spectometer to create and sustain columnary vacuum conditions. Vacuum outlet technology uses short, wide bore columns (> 10 m × 530 μm) connected to a short piece of fused silica restriction capillary at the injector side to stop the vacuum from protruding. Under these conditions, optimum carrier gas velocities are very high (90–100 cm/s for helium) and analysis times very short. The vacuum outlet method development has its own particular characteristics and is not as straightforward to perform compared with narrow-bore fast GC. Because the short vacuum columns exhibit much lower chromatographic efficiencies than their high-pressure counterparts, coelution of compounds is often inevitable and sometimes even irresolvable by mass spectrometry (MS). For less experienced chromatographers, it is advisable to carefully consult the application notes and contact their local representative for additional advice before buying this type of column.
In this respect, narrow-bore fast GC is more straightforward to implement. When considering the purchase of a narrow-bore column, a column with a stationary phase that is identical or as closely matching as possible to the stationary phase of the original column is preferable. If so, both columns will behave similarly with respect to compound/stationary phase interactions and narrow-bore chromatography can be predicted. The Agilent Method Translation Software (MTL) (Wilmington, Delaware) was developed based upon this principle (2).
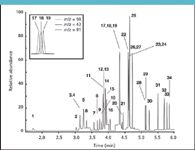
Figure 1: Fast GC chromatogram of a 10 ppb VOC standard. Insert illustrates the MS resolving power: compound 17 (toluene-D8, m/z = 98), compound 18 (octane, m/z = 43) and compound 19 (toluene, m/z = 91). Column: CP-Select 624 CB (25 m à 150 μm, 0.84 μm df, Varian, Middelburg, The Netherlands); GC oven: 30 °C (2 min) to 240 °C at 60 °C/min; Injection technique: split; MS: time-selected SIM mode with dual ion confirmation. For peak identification, see Table II.
This program can be downloaded free of charge from the Agilent website and is reported to be an invaluable tool to anyone considering narrow-bore GC to reduce total analysis time. The program is extremely simple to operate and "translates" instrumental conditions (i.e., inlet pressure and oven program) from the standard column to conditions applicable for narrow-bore GC. This approach is particularly attractive as chromatographic efficiency and resolution are maintained, so that the total amount of time devoted to method redevelopment and revalidation after narrow-bore column installation is usually very limited. An example of a typical fast GC chromatogram is given in Figure 1, and the composition of the standard used is given in Table II.
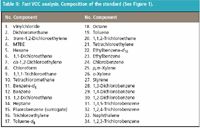
Table II: Fast VOC analysis. Composition of the standard
Using a commercial 25 m × 150 μm narrow-bore column, a substantial reduction in analysis time of the target volatile organic compounds (VOC) was achieved. Compared to the original method, which employed a 60 m × 320 μm column, analysis time was reduced from 35 min to 6 min. It must be mentioned that in order to achieve this degree of retention time reduction, the initial instrumental conditions as proposed by the MTL software were altered. Basically, all intermediate oven ramps were removed and replaced by a single ballistic ramp. The loss in chromatographic resolution, which was inevitable under the new conditions, was bypassed by benefiting from the selectivity and resolving power of the mass spectrometer. Nonetheless, some additional methodological fine-tuning was required in order to create a method with acceptable performance. Problems resulted from the proportional decrease in sample capacity when changing from standard to narrow-bore column. In order to improve peak shape of the highly volatile vinyl chloride (Figure 1, analyte 1), split ratio was increased from 10:1 to 70:1 and initial oven temperature lowered from 40 °C to 30 °C. The loss in absolute area count that occurred at the 70:1 split ratio did not affect method performance, because it was outbalanced by the increased peak heights of the target analytes owing to the faster elution. The method's Achilles' heel was definitely the very low initial oven temperature. In order to have the contribution of oven cool-down time to total analysis time at an absolute minimum (cool-down from 240 °C to 30 °C takes up to 12 min), the GC system was equipped with a cryogenic valve and connected to a big liquid nitrogen storage container. With assisted oven cooling, cool-down time was reduced to approximately 4 min, and total cycle time remained under 10 min. Because headspace equilibration itself takes about 15 min per sample, sample preparation and analysis run nicely in-line, and further acceleration of chromatography is not feasible.
In conclusion, reducing the analysis time of a standard method requires selection of a proper fast GC column. The most straightforward way is to select a narrow-bore column coated with a stationary phase that is identical to the original column. As such, the MTL software can be used to provide initial guidelines with respect to inlet pressure and oven ramping. When dealing with highly contaminated samples, it is important to use an adequate clean-up procedure to avoid problems related with the limited sample capacity of narrow-bore columns or use split injection, if possible. Other analytes we currently analyze by means of fast GC are polyaromatic hydrocarbons (PAHs) and nitrogen/phosphorous pesticides.
Specific Detection
The most straightforward way to exert a positive influence on a sample preparation procedure is to use a specific rather than a universal detector. Owing to its versatility, robustness, and the ability to introduce a certain degree of orthogonal specificity, mass spectrometry (MS) is particularly popular and has become the benchmark technique for the analysis of many environmental pollutants. The linear quadrupole mass filter is widely used because it combines all these characteristics and provides overall ease-of-use in a single benchtop instrument.
As such, the single quadrupole MS offers an ample alternative to many detectors that are used in GC and LC separations, such as flame ionization (FID), electron capture (ECD), UV detection, and so forth. However, in its standard configuration, the single quadrupole mass spectometer often is not capable of providing sufficient specificity to exercise dedicated methods that permit effective sample preparation method enhancement. To fully benefit from the potency of MS detection, the method developer is obliged to direct his or her interest to more dedicated MS configurations.
In order to introduce additional specificity to GC–MS analyses, ion-trap (IT) MS and chemical ionization (CI) are currently the most attractive alternatives available on the market. IT MS provides increased selectivity compared with the linear quadrupole mass filter owing to the possibility of performing tandem MS (MSn) experiments. Here, a compound characteristic ion, which is preferably generated in an external ionization source, is stored in a stable orbit in the trap region of the instrument through a rotationally symmetric quadrupole electric field, while interferences move in unstable orbits and are ejected. In the next stage, the mother ion is accelerated and fragmented using collision-induced dissociation (CID), the daughter ions ejected and subsequently detected. The principle of ion storage and selective ejection has, however, some important consequences with respect to overall method performance. In order to understand these consequences, it is imperative to reflect on the main operating principles of ion trap MS.
First of all, successful ion trapping requires a minimum of ions to be present in the trap region of the instrument to operate properly and be sufficiently sensitive. Because the amount of analyte introduced in the ionization source varies during chromatographic elution according to the Gaussian distribution, ion trap dwell times are not constant over time though function of the amount of analyte ions generated, (that is, the stage of peak elution). Consequently, some resolution is always compromised at the beginning and near the end of peak elution. This is undesirable for fast separations and the analysis of samples scattered with interferences. Moreover, dimensional restrictions limit the total amount of trappable ions and provide smaller dynamic ranges compared with linear quadrupole instruments, while ion storage itself can promote the risk for unwanted in-source reactions and ion losses (3). Both effects need to be particularly anticipated when considering GC–IT MS for routine environmental analyses. Indeed, co-eluting matrix contaminants, which are abundantly present in real samples, are able to interfere through trap flooding and/or in-source reactions. In practice, IT MS methods require critical selection of, preferably, isotope-labeled internal standards and effective clean-up procedures.
Most routine GC–MS applications are performed using electron impact (EI) ionization to generate the ions required for mass spectrometric separation. An effective means to increase specificity involves ionization through CI instead of EI. CI is a soft ionization technique that is compatible with all types of MS and in which ion/molecule reactions occur between reagent gas ions and the molecules eluting from the GC column (4). Therefore, fresh reagent gas is continuously supplied to the ion source in order to sustain an ionic plasma with which the analyte molecules interact.
Over the years, various reagent gases have been applied in CI work, though methane, isobutane and ammonia are by far the most popular. Compared with the bombardment of electrons in EI, ion–molecule reactions are far less energetic so that extensive fragmentation occurs less frequently in CI. Depending upon the type of reagent gas and the applied voltages, either positive or negative ions are formed and a division is made between positive and negative CI, respectively. The basic principles of the chemistry behind chemical ionization are well known and dedicated ionization sources have been made available by all major instrument manufacturers. However, given the special requirements to perform chemical ionization on a routine basis, the technique is not as widely used as EI. Previously, successful application of chemical ionization required highly specialized staff in order to keep the instrument up and running. However, the next generation of MS detectors, which are equipped with accurate control of reagent gas flow-rate and efficient autotune algorithms provide consistent data and have considerably lowered the threshold towards routine implementation. From a pure potency viewpoint, the NCI mode in particular is an extremely powerful ionization technique. When applied properly, it permits selective ionization of only those compounds that contain electron-capturing substituents, such as organochlorine pesticides, polychlorinated biphenyls (PCBs), or chlorobenzenes in the presence of high amounts of other (nonresponsive) matrix interferences. Usually, chlorinated compounds are analyzed using GC–ECD in a dual column set-up to reduce the risk of false positives. Although extremely sensitive, the ECD often is not specific enough, even in a dual column set-up, to permit reliable differentiation between target analytes and co-eluting matrix interferences in complex environmental extracts. Of course, dedicated clean-up procedures exist to improve analyte detectability, though usually only when chlorobenzenes or PCBs need to be determinated. Due to their chemical stability, both compound groups can be eluted from a clean-up column packed with acid-impregnated silica. This is by far the most effective medium to remove common interferences such as mineral oils, sulphur, humic acids etc. Unfortunately, most of the organochlorine pesticides do not share this stability and are absolutely incompatible with the harsh acidic environment of the PCB–chlorobenzene clean-up procedure. To a minor extent, some of these interferences are removable, nonetheless. Therefore, clean-up is performed similarly; however, the acid-impregnated silica is replaced by aluminium oxide. Unfortunately, this material is far less efficient compared to acidic silica so that many matrix constituents remain present to potentially interfere with the subsequent chromatographic analysis. Negative CI, however, is able to address this problem, owing to the specific nature of analyte ionization combined with the selectivity provided by subsequent mass spectral differentiation. An example of the amazing power of NCI is given in Figure 2. Here, three chromatograms are depicted in which a highly contaminated soil sample extract is analysed after clean-up with aluminium oxide. The top chromatogram (Figure 2a) was obtained after GC–ECD analysis, the middle chromatogram (Figure 2b) after GC–EIMS, and the bottom (Figure 2c) after GC–NCIMS.
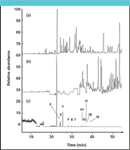
Figure 2: Illustrating the power of negative chemical ionization: a heavily contaminated sample was extracted, submitted to a standard clean-up procedure with aluminium oxide, and subsequently analyzed. (a) Analysis by GC-ECD, (b) by GC-EIMS in SIM mode, and (c) by GC-NCIMS in SIM mode. Column: CP-Sil 8 CB (50 m à 250 μm, 0.25 μm df, Varian, Middelburg, The Netherlands); GC oven: 60 °C (1 min) to 130 °C at 5 °C/min, to 180 °C at 12 °C/min (6 min) to 250 °C at 4 °C/min (15 min). Injection technique: cold splitless.
The differences between the three chromatograms are remarkable. Particularly near the end of the chromatograms, the limited specificity of both ECD and EIMS is indisputably demonstrated. The observed interferences probably originate from an oily source, because they could be removed by means of clean-up with acid-impregnated silica. Although NCI is sufficiently specific to differentiate between matrix and target analytes, it is advisable to include a clean-up step into any standard procedure in order to remove nonvolatile matrix constituents that might be present in the sample extract. Chromatographic performance will benefit from this additional step, because problems related to the accumulation of dirt inside the injection system will be circumvented more easily.
Compounds that do not generate an acceptable response in NCI usually can be analyzed by PCI. Unfortunately, PCI is far less interesting than NCI because the probable gain in specificity is now limited to the reduction in molecular ion fragmentation compared to EI. If feasible, it is, therefore, interesting to consider derivatization of non-NCI-responding target analyte(s) and introduce NCI sensitive functional groups such as the pentafluorobenzyl group, for instance. An example of such a type of derivatization reaction is provided in Figure 3. The low molecular weight amines, dimethyl- and diethyl amine, were determined successfully in water after extraction with toluene, derivatization with 2,4-dinitrofluorobenzene and evaporative preconcentration (5). Under these circumstances, detection limits for both compounds were 5 μg/L with a sample volume of only 5 mL. Moreover, removing the active hydrogens in both compounds drastically improved chromatographic performance so that a standard polysiloxane coated column could be used.
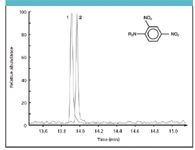
Figure 3: Analysis of dimethylamine (1) and diethylamine (2) in water samples using GC-NCIMS after derivatization with 2.4-dinitrofluorobenzene (DNFB). Column: CP-Sil 8 CB (50 m L à 250 μm i.d., 0.25 μm df, Varian, Middelburg, The Netherlands); Injection technique: cold splitless; MS: SIM mode, dimethylamine m/z = 211; diethylamine m/z = 239. Analyte concentration: 100 μg/L. Sample preparation: see text.
Of course, similar specificity-enhancing approaches are available to LC separations. Here, MSn, albeit by triple quadrupole mass filtration (QqQ MS) or IT MS, is a well-established technique that has found wide acceptance in the routine environmental laboratory, mainly for the analysis of polar pesticides and their metabolites. This trend already was initiated some years ago and has gained even more momentum with the advance in interfacing and column technology and SPE. An excellent overview of the advantages of LC–MSn techniques to routine environmental analysis was given by Sandra and colleagues in a special edition of LCGC Europe in November 2002 dealing with recent applications in LC–MS (6).
Large-Volume Injection
Over the past several years, large-volume injection (LVI) has evolved from a state-of-the-art research topic to a sound and mature technique with substantial benefits for anyone involved in routine analytical work. Advantages include the ability to use higher injection volumes as a way to elevate sample throughput and reduce total cost per sample. In practice, increasing the injection volume is primarily used as an alternative to intermediary evaporative preconcentration or to permit a proportional decrease in initial sample volumes. In fact, sample size downscaling is the prime characteristic of LVI, particularly when automation of sample preparation is pursued as a means to optimize sample throughput because smaller sample volumes are handled more easily and accommodated by standard autosampler devices. An example of such an approach is provided in the section dealing with automation in this article. As such, large-volume injection is particularly appealing to optimize procedures that comprise a tedious sample preparation step and where an increase in detector specificity is not immediately feasible. Of course, decreasing method detection limits also is possible through LVI, though more often other, more straightforward means exist to achieve this goal.
Several approaches have been described to perform LVI in GC analyses. There are two approaches particularly suitable for a routine environment. The first technique applies on-column injection to analyse relatively clean extracts of analytes with a broad range of molecular weights, such as mineral oils for example. In practice, successful on-column LVI requires a GC instrument equipped with an autosampler with a programmable injection speed, a properly deactivated precolumn that permits full trapping of the large volume of solvent, and a solvent vapour exit (SVE) to vent the excess of solvent prior to chromatography. Owing to the clean extract prerequisite, effective sample clean-up is of utmost importance to successfully performing on-column LVI on a routine basis. If omitted or even neglected, injection-related problems as a result of the direct introduction of nonvolatile matrix interferences are inevitable, and chromatographic performance will deteriorate very quickly. More details with respect to on-column LVI may be retrieved from literature (7).
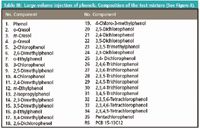
Table III: Large-volume injection of phenols. Composition of the test mixture
In routine analysis, more dirty environmental extracts are analyzed using LVI with a programmable temperature vaporizer (PTV) injector. Similar to regular PTV injections, LVI–PTV is far less susceptible to injection-related chromatographic distortions and is substantially more robust on a long-term basis. Currently, we have one application running in our laboratory in which LVI–PTV is applied routinely to make sample preparation easier. In this particular application, phenolic hydrocarbons are determined in aqueous samples after derivatization with acetic anhydride. The reason to select this application for LVI results from the complexity of the standard sample preparation procedure. Under standard conditions, the method requires considerable sample volumes to be processed to reach the low ppb quantification limits imposed by legislative authorities. Moreover, the additional derivatization step, which is needed to improve overall chromatographic behavior of the target analytes, largely hampers straightforward processing of large numbers of samples. By means of LVI, however, it was possible to reduce the initial sample volume down to 10 mL and substantially improve sample processability. A typical chromatogram of a 5 ppb standard is depicted in Figure 4. See Table III for peak identification. More details regarding method performance and characteristics can be found in reference 8.
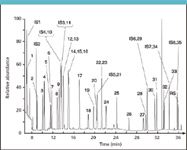
Figure 4: Analysis of phenolic hydrocarbons in water using PTV-LVI after derivatization with acetic anhydride. Column: DB-XLB (30 m L à 250 μm i.d., 0.25 μm df, Agilent Technologies, Palo Alto, California); GC oven: 40 °C (1.64 min) to 100 °C at 15 °C/min (5 min) to 140 °C at 2 °C/min to 240 °C at 15 °C/min and to 320 °C at 60 °C/min (1.39 min); MS: time-selected SIM mode with dual ion confirmation. Analyte concentration level: 5 μg/L. For peak identification, see Table III.
Large-volume PTV injection was performed using the "at once" technique. In this approach, the large volume of organic solvent, (i.e., 100 μL of n-hexane, is introduced very rapidly (20 μL/s) inside the injector to minimize the loss of volatile analytes during solvent evaporation). In order to trap the solvent, the injector was maintained at 40 °C and equipped with a dedicated liner with sintered interior to increase the internal surface area. Of course, similar results can be obtained when liners filled glass beads or some kind of packing material, such as Tenax, are used. Selection of the most appropriate packing material has to be performed with sufficient care, however. The material must be sufficiently strong to adequately retain the analytes of interest, though still permit quantitative release after injection. After solvent trapping, the major part of the solvent is vented through the split vent by means of a large flow of carrier gas, generally located in the range of 100 to 500 mL/min. Loss of volatiles is rather limited during solvent evaporation owing to the generation of a cold spot inside the injection liner. However, total solvent evaporation time has to be determined accurately. If too short, peaks will be substantially distorted owing to column flooding. Overlong evaporation times are not appropriate either since the most volatile analytes will be (partially) lost. Moreover, a small amount of solvent should be contained inside the injector prior to closure of the split valve in order to have the volatile analytes benefit from the solvent effect.
Owing to the large difference in flow during evaporation and splitless injection, flow stabilization inside the injector prior to injection definitely is equally important in this respect. Heating the injector prior to full stabilization of flow and pressure should be avoided. Therefore, it is generally proposed to include an initial time at ambient temperature after closure of the split valve. Afterwards, analyte transfer progresses in an identical manner to regular cold splitless injection. In practice, optimum injection parameters usually are determined using a standard mixture containing a homologue series of n-alkanes. In order to minimize the loss of volatile analytes, the addition of a small percentage of a keeper, (i.e., a higher boiling solvent might prove helpful). With hexane, it is preferable to use iso-octane as keeper. In the instance of dichloromethane, this is chloroform.
Automation
With the current level of dedicated instrumentation, basically every step of an analytical procedure can be automated. It is sufficient to accurately describe the various steps of the procedure that has to be automated and translate the outcome of this investigation into demands that the intended robotic system needs to fulfil. During the process of procedural description, however, it is, important not to "over automate" the procedure. Minimal human intervention, albeit only as an intermediary control tool, is important to preserve, particularly when dealing with environmental samples with highly variable composition. Nonetheless, the advantages of automated sample preparation, such as increased sample throughput, quasi-continuous operation, increased reproducibility, and less consumption of expensive and often toxic solvents and chemicals, remain abundant. As mentioned earlier, automation is often complementary with large-volume injection. This is because the possibility of downscaling initial sample size after LVI makes automation easier with respect to instrumental development, sample accommodation, and processing. Recently, we implemented an automated procedure in our laboratory. The procedure employs a regular tridirectional xyz autosampler and is used to prepare soil sample extracts for subsequent mineral oil analysis. When manually prepared, the procedure is extremely tedious, time-consuming, and occupies a great deal of laboratory bench space, as can be seen from Table IV.

Table IV: Overview of the mineral oil sample preparation procedure for soil samples*
By far the most cumbersome step of the procedure is the third step, in which the initial extract is washed with water with the purpose of quantitatively removing the acetone. Owing to the highly unfavorable distribution behavior of acetone between both the water and hexane phases, quantitative removal can only be established by using large excesses of water, generally situated in ratios of at least 20 to 1, together with long extraction times. The removal of residual acetone is mandatory when preparing mineral oil extracts for GC analysis because of the final step in the procedure, (i.e., the Florisil clean-up). If omitted, the Florisil material will simply be destroyed by the polar acetone and lose its ability to remove any of the co-extracted semipolar analytes that might be present in the extract and interfere with the analysis. Therefore, the autosampler was designed to perform acetone removal automatically from soil sample extracts and in a consecutive batch-type sequence. In order to simultaneously dry the hexane extract, an aliquot of the hexane phase is in the final step of the procedure transferred to a standard 1.5-mL vial, which is prefilled with Na2SO4. The remainder of the procedure, (i.e., the Florisil clean-up step(s), is performed manually to maintain a certain degree of control over the contamination level of the extracts prior to injection and analysis).
It should be mentioned that in order to compensate for the absence of preconcentration in the automated procedure, the injection volume was increased from 1 μL to 10 μL. Because this volume is still relatively small compared to "regular" on-column LVI procedures, injections were performed directly, (i.e., without the use of a SVE (see earlier).
Combined Analysis
A final strategy to enhance laboratory productivity takes advantage of the fact that the sample preparation procedures of most analytes are very much alike. As a result, it is perfectly possible to use one single extract and simultaneously screen this extract for the presence of a number of components that usually are analyzed separately. Common problems associated with this strategy, such as increased contamination levels and/or insufficient sensitivity, can be bypassed by including a quick clean-up procedure, for example, by matrix solid-phase dispersion using MS detection in selected ion monitoring (SIM) mode and/or large-volume injection. An example of a combined analysis is depicted in Figure 5 for the simultaneous analysis of PAHs, PCBs, chlorobenzenes, and organochlorine pesticides in soil.
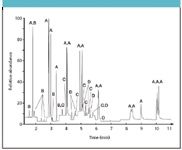
Figure 5: Chromatogram illustrating the simultaneous analysis of 16 PAHs (A), 7 chlorobenzenes (B), 10 organochlorine pesticides (C), and 7 PCBs (D). Column: RapidMS (10 m L à 530 μm i.d., 0.12 μm df, Varian, The Netherlands); GC oven: 50 °C (1 min) â⺠190 °C (3 min) at 30 °C/min â⺠280 °C at 40 °C/min; MS: time-selected SIM mode with dual ion confirmation. Analyte concentration levels were between 50 and 175 ppb. Common problems associated with this stategy, such as increased contamination levels, can be overcome by including a quick clean-up procedure such as matrix solid-phase dispersion.
In order to reach the quite stringent detection limits of the PCBs (< 1 μg/kg dry matter), a significant preconcentration had to be performed. In practice, approximately 8 g of soil was, therefore, extracted with acetone/hexane (1:1) and diluted to 50 mL. Next, 20 mL of this extract was concentrated to 1 mL, cleaned by adding a small amount of aluminium oxide, and analyzed. Injection volume was 3 μL.
Future Trends
In the quest for techniques, methods, and instrumentation that might exhibit an increase in specificity, sensitivity, and/or speed compared with standard procedures, several promising new developments have arrived in the spotlight during the last couple of years. Perhaps the most promising technique to implement on a routine basis is comprehensive two-dimensional GC (GC × GC). Unsurpassed in peak capacity, GC × GC might just be the technique to be used in complex screening analyses in which various compounds of different chemical families are determined simultaneously. Common drawbacks of this technique remain the uncertainty regarding the preference in the type of modulation system and the need for detectors with high data acquisition rates. In this respect, non-MS detectors such as FID and ECD are not really attractive for use in routine environmental work. The additional dimension provided by MS is mandatory to permit easy extraction and identification of analytes that belong to the same family from the complex GC × GC profiles. Unfortunately, GC × GC is currently only hyphenatable to the very expensive time-of-flight MS instrument and generates an equivalent amount of raw data per single analysis. Combined with dedicated data-processing software, perhaps future generations of linear quadrupoles will be able to address these drawbacks and deliver the speed required for routine implementation of the technique at a more acceptable price. Other approaches that might prove useful in analytical method redesigning are chemical sensing by means of a stand-alone mass spectrometer, direct thermal extraction of soil samples, and dedicated sample preparation workstations.
Acknowledgements
The authors would liek to thank J. Vervenne (Interscience, Belgium) for providing the Finnigan DSQ MS to perform the NCI experiments, D. Claus (Interscience, Belgium) for fruitful discussions, and H. Van De Weghe (VITO, Belgium) for undertaking the initial method development and providing the necessary feasibility data in the automated mineral oil sample preparation project.
References
(1) J. Peene, J. de Zeeuw, and R. De Jong,
Int. Lab.
9,
41–44 (2000).
(2) B. D. Quimby, V. Giarrocco and M. S. Klee, Agilent Application Note 228–294, February 1995, publication number (43) 5963-5190E, Agilent Technologies, Wilmington, Delaware.
(3) F.J. Santos and M.T. Galceran, J. Chromatogr., A 1000, 125–151 (2003).
(4) A.G. Harrison, Chemical Ionisation Mass Spectrometry (CRC Press, London, U.K., 1992).
(5) D.R. Knapp, Handbook of Analytical Derivatization Reactions (John Wiley & Sons, Hoboken, New Jersey, 1979),.
(6) P. Sandra et al., LCGC Europe's Recent Applications in LC–MS, November 2002, 2–11 (2002).
(7) K. Grob and M. Biedermann, J. Chromatogr., A 750, 11–23 (1996).
(8) A. Vermeulen , K. Welvaert, and J. Vercammen, accepted for publication in J. Chromatogr., A.
Joeri Vercammen is Team Leader of the Organic Laboratory of the Laboratoria Van Vooren NV, Zelzate, Belgium.d Boos.
Kelly Françs, Michèle Wolf, and An Vermeulen are analysts in the Organic Laboratory of the Laboratoria Van Vooren NV, Zelzate, Belgium, responsible for development, implementation and validation of new analytical methods.
Katrien Welvaert is General Laboratory Manager in the Laboratoria Van Vooren NV, Zelzate, Belgium.

New Method Explored for the Detection of CECs in Crops Irrigated with Contaminated Water
April 30th 2025This new study presents a validated QuEChERS–LC-MS/MS method for detecting eight persistent, mobile, and toxic substances in escarole, tomatoes, and tomato leaves irrigated with contaminated water.
University of Tasmania Researchers Explore Haloacetic Acid Determiniation in Water with capLC–MS
April 29th 2025Haloacetic acid detection has become important when analyzing drinking and swimming pool water. University of Tasmania researchers have begun applying capillary liquid chromatography as a means of detecting these substances.

.png&w=3840&q=75)

.png&w=3840&q=75)


.png&w=3840&q=75)


.png&w=3840&q=75)


