Elevated Temperatures in Liquid Chromatography, Part II: Basic Thermodynamics of Elevated Temperature LC, Including the van 't Hoff Relationship
LCGC North America
The authors explore some basic thermodynamic relationships.
In part I of this series, we discussed various advantages and practical considerations of performing elevated-temperature separations (1). Here in part II, we continue our discussion of this topic, exploring some basic thermodynamic relationships, including the derivation and use of the van 't Hoff equation.
We believe that an improved understanding of basic thermodynamics, including the van 't Hoff relationship, will better help chromatographers perform elevated-temperature liquid chromatography (LC). Therefore, here in part II of this three-part series, we introduce some of the basic thermodynamics of liquid chromatography (LC), leading to the van 't Hoff equation. In part III, we will present a more detailed discussion of the van 't Hoff equation, exploring its usefulness and relevance using various examples from the literature.
Basic Thermodynamic Relationships
Enthalpy of Transfer
The enthalpy of transfer (ΔH0) of an analyte in a chromatographic separation is the change in enthalpy that occurs when it moves from the mobile phase to the stationary phase. Enthalpy is defined as H = E + PV, where E is the internal energy, P is the pressure, and V is the volume. Thus, for the nearly constant pressures and volumes that are present in analyte transfer in LC, ΔH ≈ ΔE. In addition, at constant pressure, which is also closely approximated in LC, ΔH = q, where q is the heat transferred in the process. Thus, the enthalpy of transfer provides a measure of the difference between the bonding interactions (for example, London dispersion, dipole-induced dipole, dipole-dipole, and hydrogen bonding) of the analyte with the mobile phase compared to its interactions with the stationary phase. The presence of retention in a chromatographic separation implies that the analyte has at least some affinity for the stationary phase. This further implies that, in general, the enthalpy of transfer of the analyte from the mobile phase to the stationary phase is favorable, which is signified by a negative ΔH0 value. (Positive values of ΔH0 are unfavorable.)
Entropy of Transfer
The entropy of transfer (ΔS0) of the analyte is the change in entropy that occurs when the analyte moves from the mobile phase to the stationary phase. Entropy can be viewed as a measure of the change in the randomness, mobility, or ability to diffuse of the analyte or, explained more formally, as the change in the number of available states of a system. In general, as an analyte moves from the mobile to the stationary phase its mobility is restricted, which causes the entropy of transfer to be unfavorable. This is signified by a negative ΔS0 value. (Unlike changes in enthalpy, positive values of ΔS0 are favorable.)
The explanation presented above for the change in enthalpy or entropy in analyte transfer from the mobile to the stationary phase is admittedly simplistic. Nevertheless, in many cases it will capture a significant fraction of the thermodynamics of the problem, and at the very least provide a starting point for thinking about the problem. Of course, to fully understand these parameters, one would need to consider all interactions in the system, including those of the solvent with itself, and any that may come as a result of the analyte replacing solvent molecules that may be adsorbed on the stationary phase.
Gibbs Free Energy
Gibbs free energy (ΔG0) predicts whether an overall process is favored (indicated by a negative value of ΔG0) or disfavored (signified by a positive value of ΔG0). ΔG0 has a contribution from the change in enthalpy, ΔH0, a contribution from the change in entropy, ΔS0, and it depends on the absolute temperate in kelvins, T, as follows:

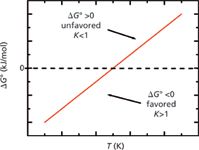
Figure 1 shows how the values of ΔH0 and ΔS0 in a typical reversed-phase separation (negative and favored for ΔH0 and negative and unfavored for ΔS0) interact with temperature in the Gibbs equation (equation 1). This relationship helps us understand the typically observed phenomenon of the retention factor, k, decreasing with temperature. As illustrated in Figure 1, at lower temperatures ΔH0 is dominant and negative so ΔG0 is negative — lower temperatures favor retention. However, as the temperature increases, the "– TΔS0" part of equation 1 causes ΔG0 to become less negative (again, because ΔS0 is negative in our case) and at some point, ΔG0 becomes positive. That is, as temperature increases, adsorption (retention) is increasingly disfavored.

Figure 1: ÎG0 plotted as a function of temperature in ÎG0 = ÎH0 â TÎS0 for ÎH0 negative (favored) and constant, and also ÎS0 negative (unfavored) and constant, which are good approximations for a typical reversed-phase separation. At lower temperatures, ÎG0 is negative (favored), which leads to higher values of the equilibrium constant, K, and larger values of the retention factor, k. At higher temperatures, ÎG0 is positive (unfavored), which leads to lower values of K and smaller values of k.
This same analysis provides an even more straightforward explanation for retention in gas chromatography (GC), in which decreases in retention occur with increases in temperature. ΔH0 will definitely be negative (favored) for analyte adsorption or partitioning into the stationary phase from the mobile phase in GC because one is essentially comparing no chemical bonding interactions in the gas phase to, at a minimum, London dispersion forces upon adsorption. Furthermore, there will be a substantial decrease in the entropy of the system upon adsorption or partitioning because of the high entropies of gas-phase species compared to the lower entropies of the same species in a condensed phase.
Therefore, a relatively simple thermodynamic analysis helps us understand why retention in some of the most important forms of chromatography will, in general, decrease with temperature. Of course, there are some underlying assumptions here, one of which is that ΔH0 and ΔS0 are independent of temperature, and another is that the stationary phase and mobile phase remain unchanged with temperature. These assumptions, which in many cases are reasonable, are discussed in greater detail below and in part III of this series.
Equilibrium Constant
The equilibrium constant, K, for the transfer of an analyte from the mobile phase to the stationary phase is

where [A]S is the concentration of the analyte in the stationary phase and [A]M is the concentration of the analyte in the mobile phase.
Now, in general, K is not easily measured in a chromatographic separation. However, using the definition of concentration as moles solute per unit volume, K can be expressed in terms of the retention factor, k (see below), which is an easily measured parameter, as follows:

where molS and molM are the number of moles of the analyte A in the stationary phase and mobile phase, respectively, and VS and VM are the volumes of the stationary and mobile phases, respectively.
Retention Factor
The retention factor, k, is the ratio of the time the analyte spends in the stationary phase divided by the time it spends in the mobile phase:

where tR is the retention time of the analyte and t0 is the mobile phase hold-up time or dead time. (A variety of approaches can be taken to determine the thermodynamic dead time of a column, which include the disturbance peak [unretained components in the analyte mixture] or the use of isotopically labeled eluent components [2,3]).
Basic chromatographic theory also teaches us that during a separation, k equals the number of moles of analyte in the stationary phase divided by the number of moles of analyte in the mobile phase:

Phase Ratio
The ratio of the volume of the mobile phase to the volume of the stationary phase is known as the phase ratio, or phase volume ratio, β:

So equations 3, 5, and 6 can be combined to obtain the following relationship for K:

Thus, we see that K is directly proportional to k. As noted, this equation is important because it relates K to something we can measure easily — the retention factor, k.
How Gibbs Free Energy Relates to the Equilibrium Constant
A well-known expression relates ΔG0 to K through the gas constant, R, and the absolute temperature:

Through equation 8, we see that a change in ΔG0 has a direct impact on the equilibrium constant, and therefore retention factor: If ΔG0 = 0 then K = 1, if ΔG0 > 0 then K < 1, and if ΔG0 < 0 then K > 1.
The van 't Hoff Relationship
The van 't Hoff equation is closely tied to the thermodynamics of the transfer of the analyte from the mobile phase to the stationary phase. To obtain the van 't Hoff equation, we first combine equations 1 and 8:

We then isolate ln K:

Next, we substitute equation 7 into equation 9:

Finally, with a little more algebra we obtain the van 't Hoff equation, as it is typically seen in LC:

Now, we can compare equation 12 to the basic equation for a straight line:

where m is the slope of the line and b is its y intercept. Thus, y corresponds to ln k, x corresponds to 1/T, m corresponds to –ΔH0/R, and b corresponds to ΔS0/R – ln β. Hence, if we plot ln k versus 1/T, and then take the slope and intercept of this line, we can directly obtain the enthalpy of transfer of the analyte from the mobile phase to the stationary phase as ΔH0 = -mR, and the entropy of transfer from the intercept of the line, provided we know the phase ratio, β, where we are assuming the plot produces a straight line, which it often does.
So, in a straightforward way we have derived the van 't Hoff equation, which allows us to gather information about two key thermodynamic parameters through some direct chromatographic measurements. That is, we simply measure the retention factor of an analyte in two or more different chromatograms at different temperatures under otherwise identical conditions, and then plot and analyze ln k vs. 1/T.
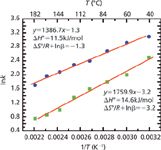
Figure 2 is a mock (synthesized data) example of a van 't Hoff plot for two different hypothetical analytes. The slopes of the two fit lines are different in that the steepest slope (analyte 2) corresponds to the largest value of ΔH0, and the largest value of ΔS0 comes from the curve with the largest intercept (analyte 1). Note that because 1/T is plotted on the x-axis, temperature increases from right to left and not left to right, which is typical. Consistent with the plot of Gibbs free energy (Figure 1), the van 't Hoff plot (Figure 2) shows the usual reversed-phase high performance liquid chromatography (HPLC) behavior of an increase in temperature resulting in a decrease in retention. With this information, separation conditions may be chosen to optimize resolution and analysis time.

Figure 2: Plot of ln k vs. 1/T (van ’t Hoff plots), for two analytes (mock and synthesized data). Analytes 1 and 2 correspond to the circles (top) and squares (bottom), respectively.
Prelude to the Next Installment on High-Temperature LC
In our next installment of this series on elevated temperatures in LC, we will discuss the van 't Hoff equation in greater detail, including: the van 't Hoff equation and retention mapping (4,5), the thermodynamics of linear van 't Hoff plots (6), nonlinearities in van 't Hoff plots because of phase transitions (7–9), irregularities in van 't Hoff plots because of pH effects (10,11), confirmation of the linearity of van 't Hoff plots and evaluating changes in entropy (12), as well as some concerns about the van 't Hoff equation (13,14).
Conclusions
In this installment, we introduced some of the basic thermodynamics of liquid chromatography that lead to the van 't Hoff equation. The next installment in this series will describe examples from the literature and important considerations for the van 't Hoff equation.
References
(1) D.S. Jensen, T. Teutenberg, J. Clark, and M.R. Linford, LCGC North Am. 30(9), 850–862 (2012).
(2) Y.V. Kazakevich and H.M. McNair, J. Chromatogr. Sci. 31(8), 317–322 (1993).
(3) J.H. Knox and R. Kaliszan, J. Chromatogr. A 349(2), 211–234 (1985).
(4) J.W. Dolan, J. Chromatogr. A 965(1–2), 195–205 (2002).
(5) L.R. Snyder, J.J. Kirkland, and J.W. Dolan, Introduction to Modern Liquid Chromatography (Wiley, 2010).
(6) Y. Liu, N. Grinberg, K.C. Thompson, R.M. Wenslow, U.D. Neue, D. Morrison, T.H. Walter, J.E. O'Gara, and K.D. Wyndham, Anal. Chim. Acta 554(1–2), 144–151 (2005).
(7) K.B. Sentell and A.N. Henderson, Anal. Chim. Acta 246(1), 139–149 (1991).
(8) S. Heinisch and J.-L. Rocca, J. Chromatogr., A 1216(4), 642–658 (2009).
(9) J.F. Wheeler, T.L. Beck, S.J. Klatte, L.A. Cole, and J.G. Dorsey, J. Chromatogr. A 656(1–2), 317–333 (1993).
(10) T. Teutenberg, Anal. Chim. Acta 643(1–2), 1–12 (2009).
(11) S. Pous-Torres, J.R. Torres-Lapasió, J.J. Baeza-Baeza, and M.C. García-Álvarez-Coque, J. Chromatogr. A 1163(1–2), 49–62 (2007).
(12) T.L. Chester and J.W. Coym, J. Chromatogr. A 1003(1–2), 101–111 (2003).
(13) F. Gritti and G. Guiochon, J. Chromatogr. A 1099(1–2), 1–42 (2005).
(14) F. Gritti and G. Guiochon, Anal. Chem. 78(13), 4642–4653 (2006).
David S. Jensen and Matthew R. Linford are with the Department of Chemistry and Biochemistry at Brigham Young University in Provo, Utah. Direct correspondence to: mrlinford@chem.byu.edu.
Thorsten Teutenberg is with the Institut für Energie- und Umwelttechnik e. V. in Duisburg, Germany.
Jody Clark is with Selerity Technologies Inc., in Salt Lake City, Utah.

Distinguishing Alcohol- from Non-Alcohol-Associated Liver Cirrhosis with LC-MS
May 7th 2025A pilot study investigating whether nicotinamide adenine dinucleotide kinase (NADK) expression is selectively diminished in alcohol-associated liver cirrhosis (AC), as well as evaluating its potential as a biomarker for this condition, measured AC and non-AC (NAC). Nicotinamide adenine dinucleotide (NAD+) and nicotinamide adenine dinucleotide phosphate (NADP+) levels in human liver samples were measured using liquid chromatography-mass spectrometry (LC-MS).

.png&w=3840&q=75)

.png&w=3840&q=75)


.png&w=3840&q=75)


.png&w=3840&q=75)


