Do Soil Samples Contaminate the Gas Chromatography System?
Soil samples are associated with contamination in the inlet and gas chromatography (GC) column and may require system maintenance such as replacing the liner, inlet seal, and clipping the front of the column. In this article, components of soil—humic acid, folvic acid, tannic acid, and bentonite—are extracted, concentrated, and analyzed repeatedly to determine if these components are responsible for nonvolatile contamination that impacts system performance.
Ghost peaks were examined in the last instalment of “Practical GC”, specifically siloxane contamination (1), but contamination from samples has not yet been addressed. This article will take a literal approach to dirt in the gas chromatography (GC) system. The extraction of soil samples for the analysis of a broad range of semivolatile environmental pollutants is one of the most challenging matrices. These samples contaminate the entire GC system, including the injection port, column, and the mass spectrometer (MS) source. There are a variety of approaches to extracting organic analytes from soils, such as soxhlet, microwave, automated solvent extraction (ASE), and sonication using predominately methylene chloride. Besides filtration and the removal of water, most clean-up techniques are not incorporated into the workflow, as they can adversely affect target analyte recoveries. When conducting analysis of samples, the lowest possible detection limits are desired, which requires limited dilutions of highly contaminated extracts. Some soil samples are relatively clean, while others require instrument maintenance following analysis. Understanding the basic composition of soil reveals the diversity of this complex matrix, and provides insights into how physical and chemical characteristics are related to dirt in the GC system.
Grass and soil | Image Credit: © Okea - stock.adobe.com

Properties of Soils
Soil is made up of roughly 24% air, 25% water, 45% minerals, 4% humus, and 2% plants and organisms. Clay and sand is part of the mineral component, and humus, plants, and organisms make up the organic portion (2). Since some of the humus compounds can be extracted by methylene chloride, the focus of this work will be on these substances.
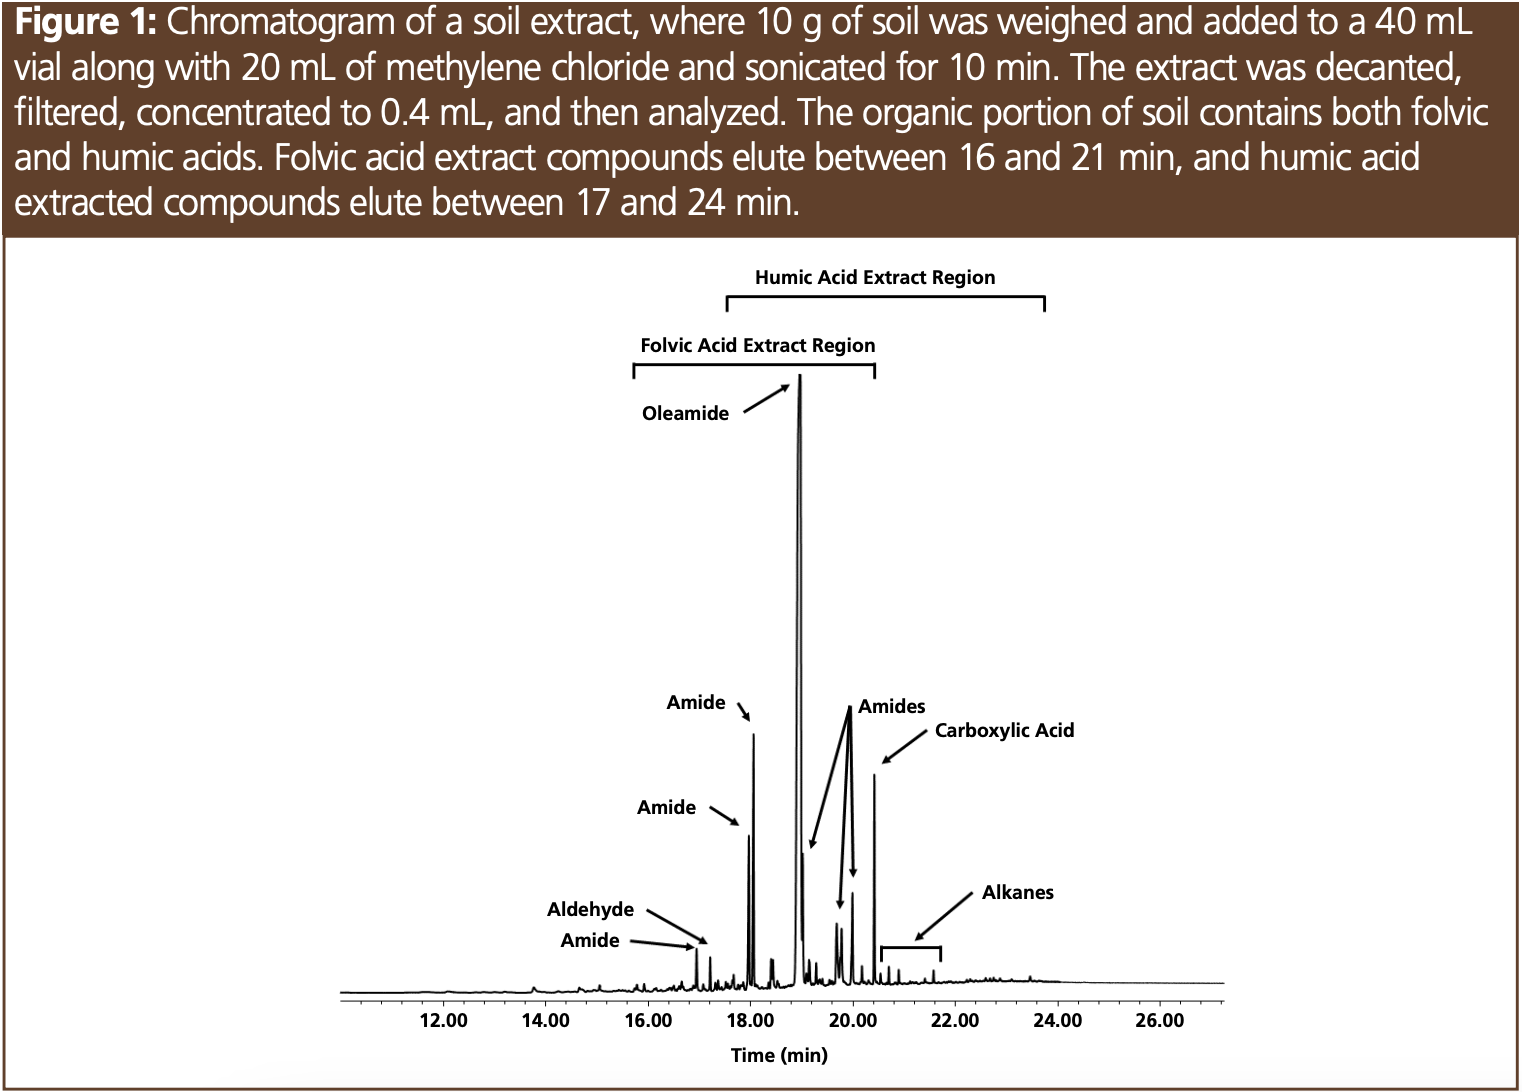
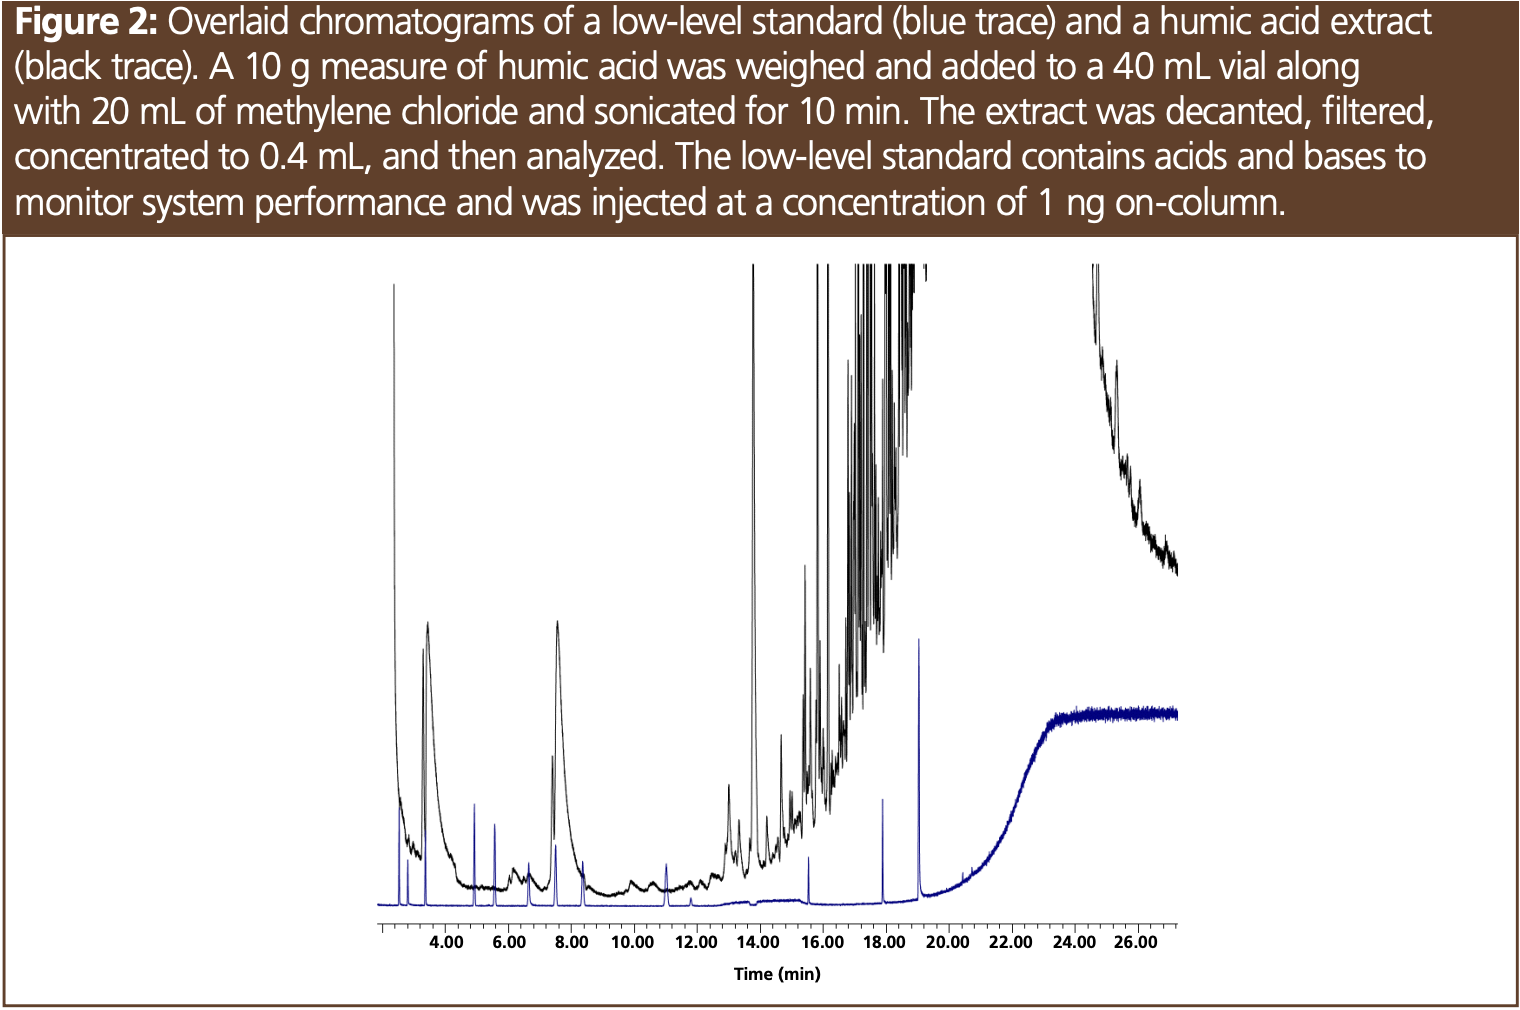
Humus are humic substances composed of fulvic acid, humic acid, and humin. Fulvic acids are of lower molecular weight, are water-soluble, and are light brown in colour, while humic acid is dark brown and insoluble in acidic or pH neutral water. Some compounds found in fulvic acid and humic acid are soluble in methylene chloride. Fulvic acids are lower molecular weight and contain more oxygen content than the less functionalized humic acids. Humins are macro-organics with molecular weights of over 100,000 and are not soluble in any solvent (3). Different plant materials result in different distributions of fulvic and humic acids; for instance, grasslands are nearly 75% humic acid compared to forest soils where folvic acid makes up over 60% of the organic composition. Higher order plants such as oak, pine, and hemlock may contain tannins (polyphenols) (4). In this article, a soil sample will be examined (Figure 1) and compared to different organic substances found in soil. This will be followed by the analysis of low-level standards to monitor system performance (Figure 2).
Experimental Design
A 10 g measure of folvic acid (Live Earth Products, Inc.), humic acid (Sigma Aldrich), tannic acid (Sigma Aldrich), bentonite (Sigma Aldrich), and local soil were weighed out and 20 mL of methylene chloride was added to the samples in 40 mL glass vials. In addition, samples were weighed out and extracted with acetone. The samples were then sonicated for 10 min followed by decanting into a Norm-Ject Syringe connected to a 0.22 µm PTFE filter (all Restek). The 20 mL extract was concentrated to 0.4 mL using a gas stream of nitrogen and 70 °C. Extracts were analyzed 10 consecutive times in splitless mode to introduce the maximum amount of sample onto the column. A 30 m × 0.25 mm, 0.25-µm 5-type column (Restek) was used with the following oven programme: 125 °C starting temperature with a hold time of 11 min followed by a 20 °C/min ramp to 340 °C with a final hold time of 5 min. Analysis was performed using a gas chromatograph–mass spectrometer (GC–MS) (Agilent) with a scan range of 35 to 550 amu. After every 10 extracts three replicates of a quality control standard were analyzed in split mode for a concentration of 1 ng on-column (Figure 2). The quality control mix contained acidic and basic compounds and was used to determine the effects of each soil extract sample on the analytical system. In the test mix the peak areas of 1,6 hexanediol, 2,4-dinitrolphenol, 2-ethylhexanoic acid, and pentachlorophenol were compared to the peak areas of stable compounds in the mixture and these peak area ratios were monitored.
Results and Discussion
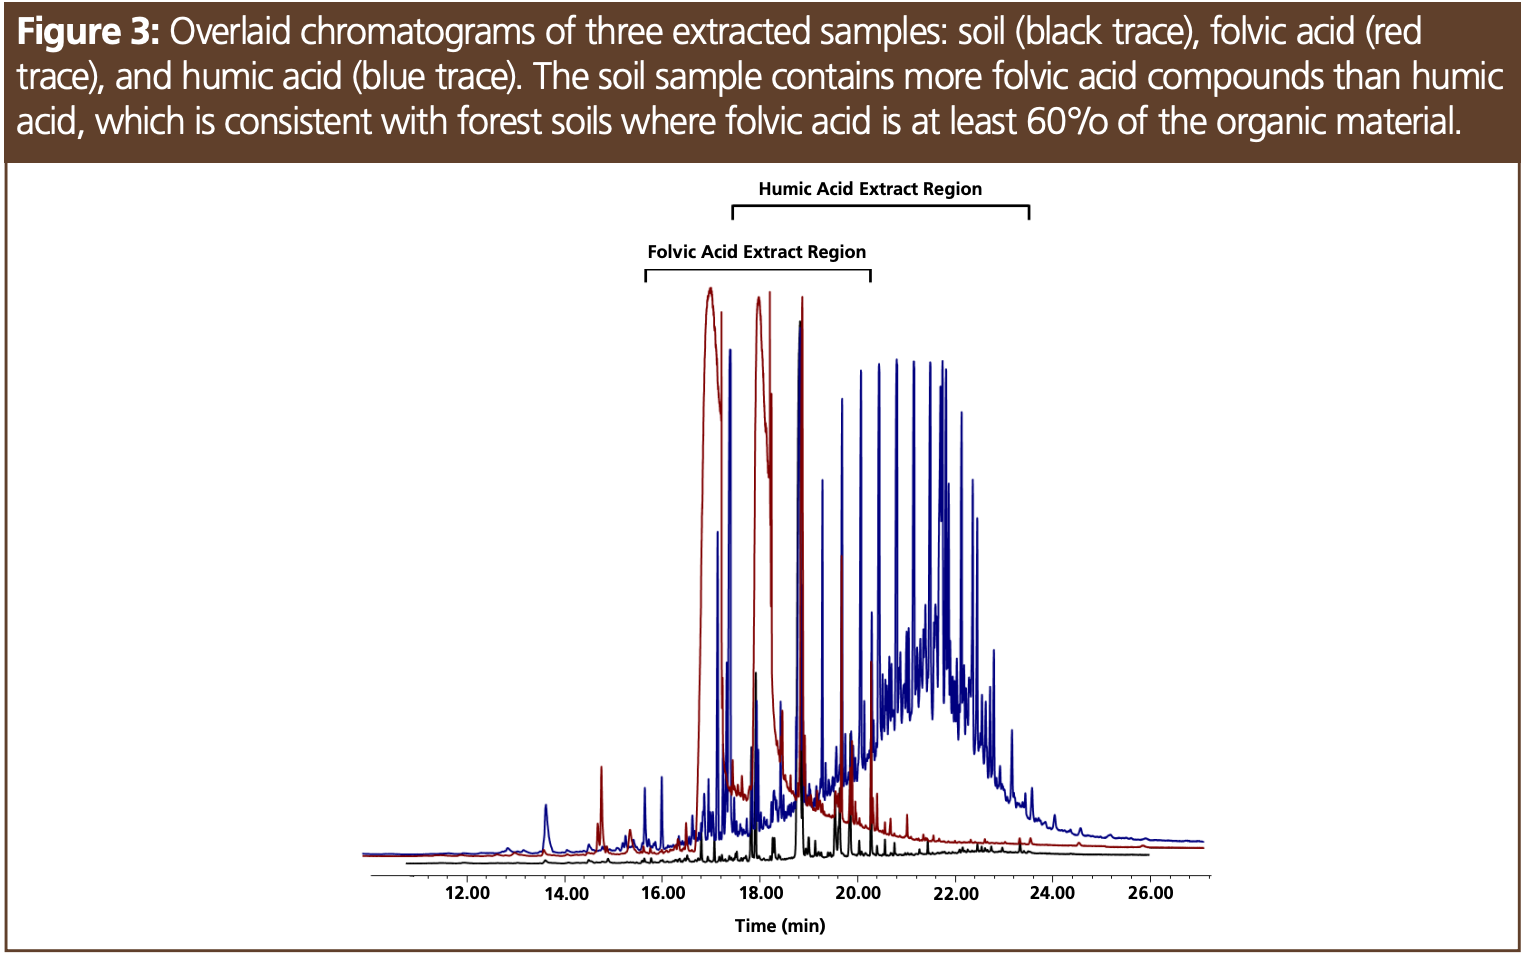
The soil sample was sourced from a hardwood forest and was comprised of primarily folvic acid compounds (Figures 1 and 3), which is consistent with forest soils where folvic acid makes up at least 60% of the organic material (2). Figure 1 shows the composition of the soil sample based on mass spectral identification, indicating a variety of amides, aldehydes, and alkanes among other compounds. Figure 3 shows the retention of these analytes in the elution region of the folvic acid sample. While soil samples can contain high-molecular-weight material, such as those found in soils high in humic acids, our soil extract was relatively clean. Even after 50 injections, the peak area ratios in our test mix—which evaluated system performance— remained unchanged. Two extraction solvents were evaluated, acetone and methylene chloride, and the chromatograms were overlaid and showed no observable differences between all the samples evaluated. Tannic acid is commonly found in hardwood forests, and the extraction of this sample resulted in only trace compounds that were not related to breakdown compounds of this polyphenol. While bentonite is one of the many inorganic clays found in soil, the extraction of this material not surprisingly resulted in only trace compounds. The analysis of tannins and bentonite was also performed to evaluate the possibility of nonvolatile residue contaminating the liner and column and reducing response to the test compounds. Each of these extracts were analyzed 10 times, with no change in peak area response for the active test probes. The same results were observed with humic acid and folvic acid. Compounds from these extracts were able to be baked off the column using a final oven temperature of 340 °C with minimal carryover—even after 50 injections (Figure 3).
Conclusion
The chromatographic profile of soils is based on flora, age, and biological activity. Soil samples taken at different depths at the same location can have different humus distributions based on age and weathering (3). Humus is comprised of folvic and humic acid where folvic acid is more functionalized (contains more aldehydes, amides, and carboxylic acids) and humic acid is higher molecular weight. System contamination was found to be easily managed with frequent “baking” of the column or inlet, thereby indicating that these components of soil were not responsible for nonvolatile dirt in the system requiring maintenance.
Acknowledgements
Jaap de Zeeuw and Erica Pack for technical advice and review.
References
(1) English, C. Understanding the Origins of Siloxane Ghost Peaks in Gas Chromatography. The Column 2022, 18 (6), 10–15.
(2) Pidwirny, M., Ed., Introduction to Soils; University of British Columbia, 2006.
(3) Sparks, D., Ed., Advances in Agronomy; Elsevier, 2011.
(4) Stevenson, F. J., Ed., Humus Chemistry: Genesis, Compositions, Reactions; Wiley, 1982.
About the Author
Chris English has managed a team of chemists in Restek’s innovations laboratory since 2004. Before taking the reins of the laboratory, he spent seven years as an environmental chemist and was critical to the development of Restek’s current line of volatile GC columns. Chris holds a B.S. in environmental science from Saint Michael’s College, USA.
Email: chris.english@restek.com
Website: www.restek.com

Detecting Hyper-Fast Chromatographic Peaks Using Ion Mobility Spectrometry
May 6th 2025Ion mobility spectrometers can detect trace compounds quickly, though they can face various issues with detecting certain peaks. University of Hannover scientists created a new system for resolving hyper-fast gas chromatography (GC) peaks.
Altering Capillary Gas Chromatography Systems Using Silicon Pneumatic Microvalves
May 5th 2025Many multi-column gas chromatography systems use two-position multi-port switching valves, which can suffer from delays in valve switching. Shimadzu researchers aimed to create a new sampling and switching module for these systems.
New Method Explored for the Detection of CECs in Crops Irrigated with Contaminated Water
April 30th 2025This new study presents a validated QuEChERS–LC-MS/MS method for detecting eight persistent, mobile, and toxic substances in escarole, tomatoes, and tomato leaves irrigated with contaminated water.
University of Tasmania Researchers Explore Haloacetic Acid Determiniation in Water with capLC–MS
April 29th 2025Haloacetic acid detection has become important when analyzing drinking and swimming pool water. University of Tasmania researchers have begun applying capillary liquid chromatography as a means of detecting these substances.

.png&w=3840&q=75)

.png&w=3840&q=75)


.png&w=3840&q=75)


.png&w=3840&q=75)

