Direct Analysis Serum Lipidomics Using High Performance Time of Flight Mass Spectrometry — High Resolution, Accurate Mass, and Zucker Rats
The Application Notebook
Polar lipids and other metabolites extracted from plasma from lean, diabetic, and obese Zucker rats were analyzed by flow injection using high resolution time of flight mass spectrometry. Metabolites were confidently identified and differences in the metabolite profiles determined.
Polar lipids and other metabolites extracted from plasma from lean, diabetic, and obese Zucker rats were analyzed by flow injection using high resolution time of flight mass spectrometry. Metabolites were confidently identified and differences in the metabolite profiles determined.
The need for high-throughput analysis of biological samples is of growing importance owing to its clinical utility and the ability to leverage new developments in technology. This is particularly true in metabolomics where screening to evaluate significant differences in key metabolites and metabolite families can be selectively observed using new tools. One such tool is high performance time of flight mass spectrometry. The mass accuracy and resolving power now offered allows for confident evaluation of metabolites with little sample preparation.
Samples and Analysis
Rat plasma (Zucker; Bioreclamation) was precipitated with 80% cold methanol and the supernatant analyzed directly. Polar lipids in the extracts were analyzed by injection into a stream of acetonitrile/water with formic acid.

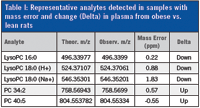
Table I: Representative analytes detected in samples with mass error and change (Delta) in plasma from obese vs. lean rats
Analytical Conditions
Mass Spectrometer – Citius™ LC-HRT (LECO Corporation, Saint Joseph, MI)
Mass Range – 240–940
Acquisition Conditions – 1 spectra/s; R =100,000; positive ion mode
Solvent delivery Conditions – 60 µL /min (acetonitrile/water/0.1% formic acid)
Injection Volume – 2 µL
Acquisition time – 2 min
Results
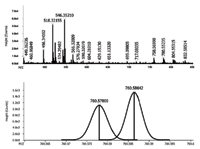
The analyses provided a rich spectrum which can be background subtracted to yield useful information on the lipid content of the simple plasma extract. This is shown in Figure 1 for data acquired at 100,000 resolving power. The resolving power allows for separation of the M+H+2 isotope and M+H of unsaturated forms as shown for PCs containing 34 carbons. This requires a resolving power in excess of 80,000.

Figure 1: Mass spectrum at R > 100,000 from plasma extract â (top) full acquisition; (bottom) M+2 isotope of PC34:2 and the M of PC34:1 resolved.
Conclusions
The direct analysis of lipids using high performance time of flight provides a quick and efficient tool to screen differences in lipids in complex extracts. The analysis time of 2 min provides for a rapid evaluation with the high resolving power allowing for selective analysis.

LECO Corporation
3000 Lakeview Avenue, St. Joseph, MI 49085
tel. (269) 985-5496, fax (269) 982-8977
Website: www.leco.com

New Method Explored for the Detection of CECs in Crops Irrigated with Contaminated Water
April 30th 2025This new study presents a validated QuEChERS–LC-MS/MS method for detecting eight persistent, mobile, and toxic substances in escarole, tomatoes, and tomato leaves irrigated with contaminated water.

.png&w=3840&q=75)

.png&w=3840&q=75)


.png&w=3840&q=75)


.png&w=3840&q=75)


