Development of Stability‑Indicating Analytical Procedures by HPLC: An Overview with Best Practices (Part 1)
This article is first in a series of two white papers on stability studies and testing of pharmaceuticals, which focuses on the development of stability-indicating high performance liquid chromatography (HPLC) methods for drug substances and products. It provides an overview of the fundamentals, including the traditional approaches, as well as modern trends and software tools for expediting the process. The regulatory guidance on the necessary contents of a well-written method, strategies for efficient method execution, and life cycle management of analytical procedures, are described in Part 2 of the series.
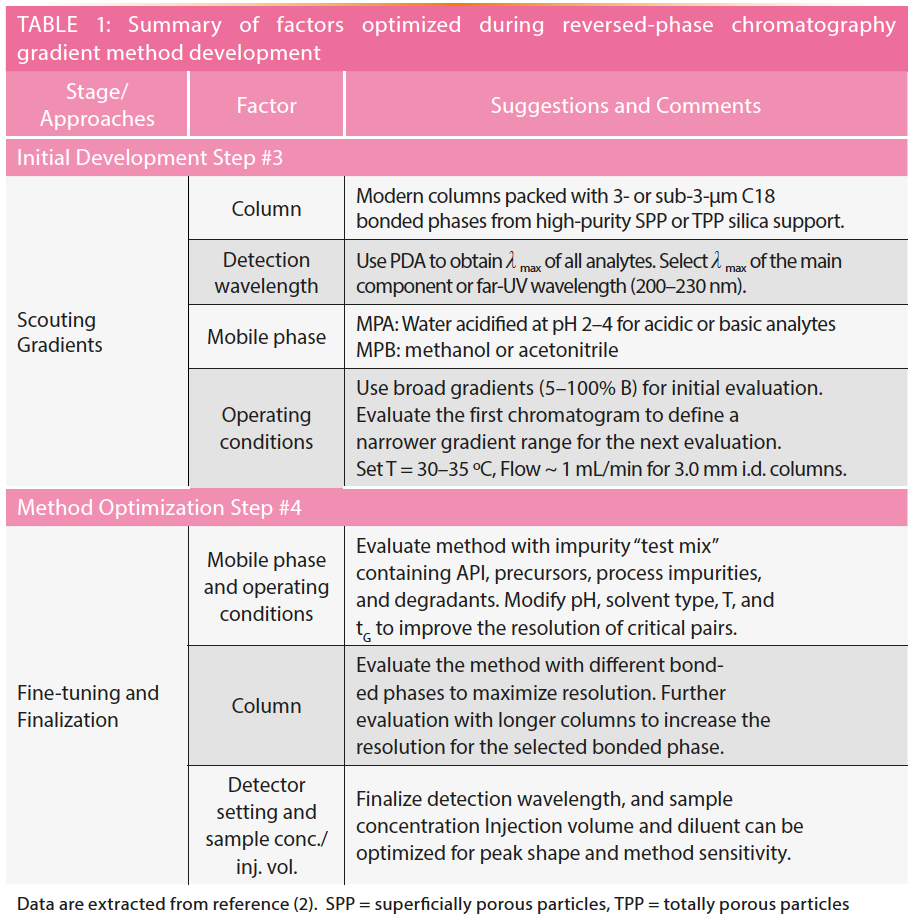
High performance liquid chromatography (HPLC) method development can be a time-consuming process, particularly for stability-indicating analytical procedures of new chemical entities (NCEs). Most of the procedures for small-molecule drugs employ gradient reversed‑phase liquid chromatography (RPLC) with ultraviolet (UV) detection. These methods are designed to separate and quantitate the active pharmaceutical ingredients (APIs) and all process impurities and degradation products in drug substance (DS) and drug product (DP) samples. This important HPLC method category provides quality assessment data required in product release and stability studies in regulatory filings and procedures (Table 1). Information on the HPLC method development process and requirements are available in many textbooks (1–6), journal articles (7–13), regulatory guidance documents (14–16), and other resources (17). In this instalment, we strive to provide a concise but comprehensive overview of the essential steps of the method development process, supported with case studies, common practices, regulatory guidance, and citations of critical references.
Why Gradient RPLC with UV Detection for Stability‑Indicating Methods?
Let us start with the fundamentals and the rationale for the use of RPLC and UV methods in stability-indicating analytical procedures, which must separate the API from all impurities, and meet stringent regulatory requirements in method performance (6,14–16).
First, the primary retention mechanism in RPLC is hydrophobic interaction, particularly useful for compounds with intermediate polarities, and an excellent match of most small-molecule drugs with oral bioavailability (2). The weak dispersive forces in RPLC ensure that all components in the sample can be eluted from the column using strong purging solvents at the end of the gradient, thus yielding 100% recovery of the injected sample.
Second, the elution order in RPLC is highly predictable. It follows the “Linear Solvent Strength Model” (4). In most cases, the log k (retention factor) of the analyte is inversely proportional to %MPB (mobile phase B or % of the strong organic modifier). In addition, most drugs are basic, but have sufficient hydrophobicity to be retained in RPLC in the ionized forms in acidic mobile phases. The retention of the “solvated” analytes can be manipulated to provide increased resolution by changing the composition of the mobile phase (for example, water, organic solvents, and pH), that interacts with the analytes in the “solvated” state, and moderates their retention on the stationary phase (1,2). Gradient elution is commonly used in stability-indicating assays to yield higher peak capacity and sensitivity for both hydrophilic and hydrophobic components in the sample (2).
Third, most NCEs are chromophoric, having one or more conjugated double bonds or aromatic moieties in their structures, thus providing high detection sensitivity with UV detectors. A peak area precision of 0.1–0.5% relative standard deviation (RSD) is routinely achievable in HPLC-UV assays, because the entire injected sample passes through the UV flow cell. This high precision performance is necessary for quality control applications for DS release testing (with typical specifications of 98.0–102.0%). In contrast, the precision performance of <1% is difficult to achieve with mass spectrometry (MS) detection, because only a small fraction of the nebulized eluent stream is ionized and detected (2). Furthermore, a UV detector offers a wide linear response range exceeding five orders of magnitude (1 × 10⁻⁵ to ~2 absorbance units [AU]), allowing the use of a single-point calibration curve for early-phase assays, and normalized area % analysis for the determination
of impurities (2).
There are some notable exceptions to the adoption of RPLC-UV methods. For NCEs with no or low chromophoric properties, a gradient-compatible near-universal detector, such as a charged aerosol detector (CAD) or an evaporative light-scattering detector (ELSD), is typically employed (2). For the determination of enantiomers, a normal-phase separation using chiral LC or supercritical fluid chromatography (SFC) separation, is generally preferred, because the analytes are present in an unassociated and non-ionized state, which often leads to higher selectivity differences between the enantiomers (2).
Another exception is the determination of potentially genotoxic impurities at parts-per-million levels (not discussed here), which may require a high‑sensitivity analytical procedure, such as LC with mass spectrometry detection (LC–MS) (2).
Objective of This Article
The objective of this instalment is to describe the traditional five‑step strategy in HPLC method development, according to Snyder and associates (1), and illustrate the use of the selectivity-tuning for method optimization with case studies.
The Traditional Five-Step Method Development Approach
A traditional five-step approach for HPLC method development was proposed by Snyder and associates, based on the concept of selectivity‑tuning to increase the resolution of critical pairs (close-eluting peaks) for accurate quantitation (1,2). The five‑step approach is outlined here.
Step 1: Defining Method Types
The first step is to define the method type. Is it a preparative, qualitative, or quantitative method? The most common method type is a stability-indicating analytical procedure (also known as an assay and impurities determination) for the quantitation of the API and impurities in pharmaceuticals. It is a challenging method development task to develop this type of method, because all key components in the sample must be physically separated in one chromatogram with method performance compliant to ICH guidelines (14). In comparison, other pharmaceutical methods for identification, limit tests, or performance assays, are simpler to develop, validate, and execute. Typically, the DS method is developed first for the NCE, and the DP method is then optimized based on the DS method.
Step 2: Gathering Sample and Analyte Information
The next step is to gather information on the sample and analytes. For NCEs, the structures and molecular formulae are well established, allowing the inference or calculation of physicochemical properties, such as pKa, logP, logD, polarity, numbers of acidic, basic, or aromatic functional groups, and chiral centres. These characteristics can be useful in the selection of columns, mobile phases, and sample diluents. The pKa values can be used to select a mobile‑phase pH that ensures the compound is in a singly charged state. Knowledge of the acidic, basic, and aromatic functional groups can be helpful in column and mobile-phase selection, and provides forewarnings of potential stability or reactivity issues. Finally, knowing the presence and number of chiral centres is vital for planning an analytical procedure that includes diastereomeric separations. Though not entirely in the scope of this article, possible diastereomeric combinations may be separated with an achiral RPLC column (shown in the case study). Enantiomeric separation offers a different challenge that will require selecting the appropriate chiral‑selective column for the determination of enantiomers of the API using a different analytical procedure. To gather analyte information, resources such as Certificate of Analysis (CoA) from suppliers or technical packages from the API manufacturers are invaluable in obtaining initial information regarding sample purity, methodologies, spectral and safety data, and other attributes of the API.
Step 3: Initial Method Development
This is the first laboratory-based step in the development process, and it involves performing “scouting” runs to obtain the first chromatograms. Details in column and mobile-phase selection are covered in many books (1–3). To illustrate the initial method development step, we will start here with the most common choice of a C18 column used with an acidified aqueous mobile phase and organic solvent. Step #3, outlined here, is extracted from a case study published in reference 2.
Here, a sample of the API is dissolved in a default diluent (in this case, 1 mg/mL in 50% acetonitrile in water) and injected into an HPLC-UV system (with a photodiode array (PDA) detector and an MS instrument. A common broad-gradient RPLC method can be used (such as mobile phase A [MPA] = 0.1% formic acid in water; mobile phase B [MPB] = acetonitrile; C18 column: 3-µm, 100 mm × 3.0 mm i.d., 5–100% acetonitrile in 10 min at 1 mL/min and a column temperature at 30 °C). Full spectral data in UV (220–400 nm) and MS (100–1200 amu with positive ionization) are collected to allow reconstruction of chromatograms at any monitoring wavelengths.
It is important to choose an MS‑friendly mobile phase in this step if possible, to reduce the need for any method changes when using MS later. Results from the first scouting run can generate pertinent data, such as a “rough” sample impurity profile, estimation of purity and hydrophobicity of the API, maximum absorbance wavelength (λmax), (M+H)1+ data of the NCE, and any observed impurities. These initial data are used for determining the next logical steps in method fine‑tuning.
The process is often modified for polar or water-soluble NCEs, which may be better retained on an AQ‑type‑C18 or polar‑embedded column (2). For drug candidates with low or no UV chromophoric activities, detectors such as CAD, ELSD, or MS may be employed. One crucial issue in the initial method development of NCEs is the rare availability of an “ideal test mix” sample containing the API and all key impurities or degradation products, deterring a systematic application of automation systems. This dilemma of sample availability will be discussed later.
Step 4: Method Fine-Tuning and Optimization
This is the most time-consuming step for the development of stability‑indicating procedures. The process is typically reliant on “selectivity tuning” by changing selectivity (α) in a rational fashion by adjusting mobile phases (organic modifier, pH, buffer strength) and operating parameters (flow [F], gradient time [tG], column temperature [T]) (1–3). Often, changing to a column packed with different bonded phases other than C18 may be needed (such as, for example, phenyl, polar-embedded, or cyano) to achieve the separation of a critical pair of coeluting peaks.
The next step is often to employ a “shallow middle gradient segment” indexed to the hydrophobicity of the API to increase the resolution around the main component (2). This use of a “multi‑segment gradient approach” is preferred for complex NCEs and is discussed later.
The method fine-tuning or optimization process typically takes a few days or 1–2 weeks, depending on the complexity of the NCE and the availability of key impurities as reference materials (such as isomers) that are used as retention time markers. This process is often iterative, and is performed before or after the initial forced degradation studies where degradation products are generated to challenge the separation power of the initial method. Peak purity should be evaluated with PDA and MS. Quite often, the initial column used (for example, C18) is found to be inadequate in the separation of a critical pair (for example, API and the immediate synthetic precursor) (2). This would invariably trigger a column screening experiment to find a better column with a different selectivity (for example, phenyl, polar-embedded, or cyano) (2,3). The use of MS can be a valuable tool in column screening, as it can help to track known impurities from column to column as well as degradation products formed during forced degradation studies. Knowledge of the molecular weights helps to determine the molecular structures of the degradation products.
For laboratories specializing in method development, the use of automated column and mobile‑phase screening systems and other software platforms can expedite this time‑consuming step. The last steps in the method development phase are the final minor method adjustments needed to improve sensitivity and peak shape (injection volume, sample concentration, diluent, monitoring wavelength), and analysis time.
It should also be noted that the drug product will also require assays and impurity analysis throughout the life cycle of the NCE. The best and shortest approach to DP method development is to use the chromatographic conditions for the DS with a modified sample preparation procedure.
Step 5: Method Prequalification
Step 5 for methods used to test regulated products is a method prequalification or prevalidation step. This step will ensure the method can be successfully validated by determining the potential to pass typical method validation criteria (2,16), including specificity, precision, linearity, sensitivity, and often accuracy also. This prequalification step can take from a few hours to 1 or 2 d for most methods.
Examples of the Selectivity Tuning Approach by Changing Mobile Phase, Column, or Both
Figures 1 to 3 show studies of the use of selectivity tuning by changing the mobile phase, column, or both. Figure 1 shows the separation of a 12-component test mixture of basic, acidic, and neutral drugs and the changes in peak spacings with the gradient separation on a C18 column by switching the organic mobile phase (MPB) from methanol to acetonitrile. Note that acetonitrile is a stronger organic modifier in RPLC; thus, the elution time is considerably shorter. The peak shapes are also sharper due to its lower viscosity (1,2). While the elution order remains the same without any peak crossovers, the band spacings are changed due to selectivity differences. Note that acetonitrile is an aprotic solvent, while methanol is capable of hydrogen bonding and polar interaction with the analytes. In cases of analytes that can hydrogen-bond or have polar interaction, the elution order may be different when changing from methanol to acetonitrile.
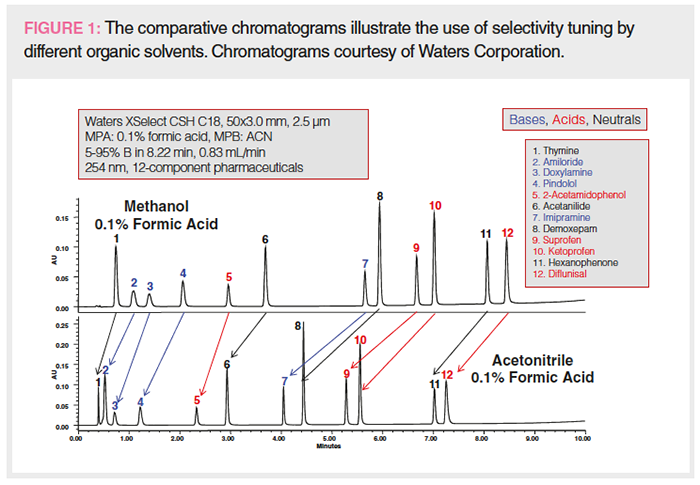
Figure 2 shows eight comparative chromatograms of a 7-component mixture of basic drugs using columns packed with different types of C18, phenyl, cyano, and pentafluorophenyl phases from a single manufacturer. All columns have the same dimension and are packed with similar particle sizes of ~1.7 µm. Chromatograms show similar elution order but with many differences in band spacings for C18 phases, whose predominant retention mechanism is hydrophobic interaction. However, the elution order can be substantially different in columns packed with different bonded phases that have additional retention mechanisms from π-π, polar, and hydrogen bonding interactions. To find the best column for a specific separation, the most efficient approach is to use an automated column and mobile phase screening system (2,3,12).
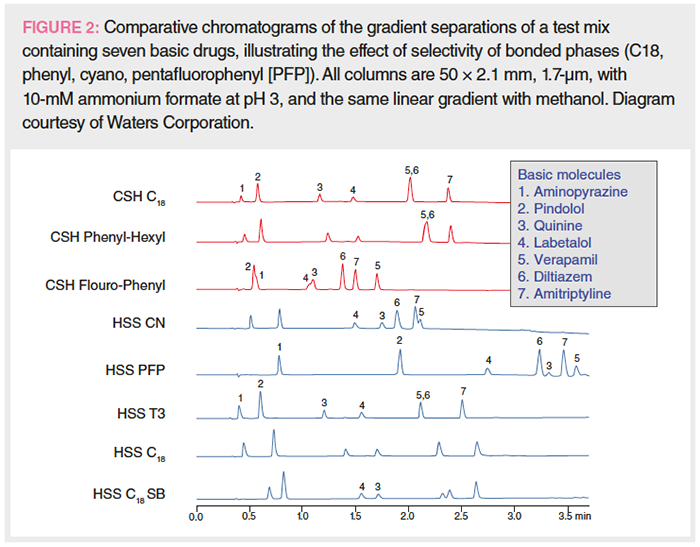
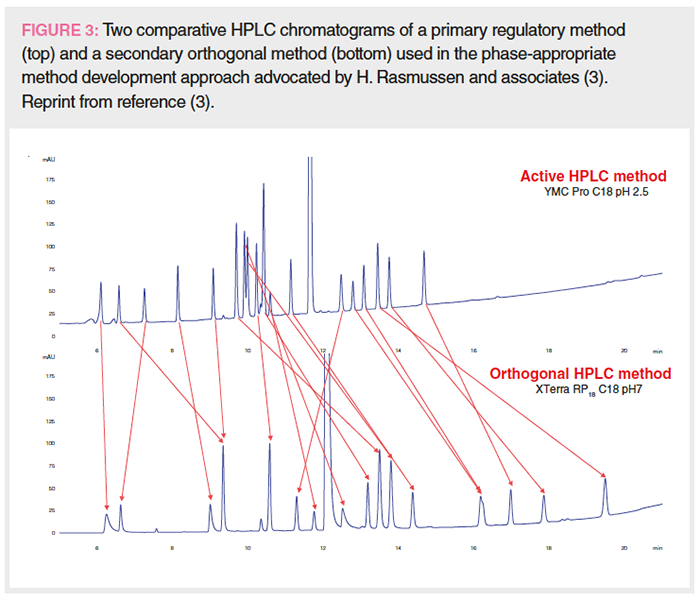
Figure 3 shows two comparative chromatograms in a case study on proactive phase-appropriate method development advocated by Rasmussen and associates (3,17). The top chromatogram shows the separation of a retention marker solution of an API spiked with available impurities that is analyzed by a primary stability-indicating method for a DS method using a C18 column and an MPA at pH 2.5. The bottom chromatogram shows the separation of the same test mix using the secondary orthogonal method on a polar-embedded phase at a neutral MPA pH. More discussion on the development of a secondary orthogonal method will be discussed in Part 2.
Acknowledgements
The authors express their gratitude to the following colleagues for their time and efforts to provide timely reviews of the manuscript to improve content accuracy and clarity: Tao Jiang of Mallinckrodt; Anissa Wong and Chris Foti of Gilead Sciences; Mike Shifflet of Johnson and Johnson Consumer Health Care; He Meng of Sanofi; Adrijana Torbovska of Farmahem; Alice Krumenaker of TW Metals, LLC; Mark Shapiro of MCS Pharma Consulting; Szabolcs Fekete of U. Geneva; Deidre Cabooter of KU Leuven; Tamara Andreoli of Medinova AG, Schweiz; Michael DeHart of CMP Pharma; Marc Foster of Mythctest.
References
- L.R. Snyder, J.J. Kirkland, and J.L. Glajch, Practical HPLC Method Development (John Wiley & Sons, Hoboken, New Jersey, 1997), Chapters 1–2 and 8–9.
- M.W. Dong, HPLC and UHPLC for Practicing Scientists, (John Wiley & Sons. Hoboken, New Jersey, 2nd Edition, 2019), Chapters 2–6 and 9–11.
- S. Ahuja and M.W. Dong (Eds.), Handbook of Pharmaceutical Analysis by HPLC (Elsevier. Amsterdam, Netherlands, 2005), Chapters 5 and 6.
- L.R. Snyder and J.W. Dolan, High-Performance Gradient Elution: The Practical Application of the Linear-Solvent-Strength Model, (Wiley-Interscience, Hoboken, New Jersey, 2007), Chapter 3.
- Y.V. Kazakevich and R. LoBrutto (Eds.), HPLC for Pharmaceutical Scientists (John Wiley & Sons, Hoboken, New Jersey, 2007), Chapter 8.
- K. Huynh-Ba, Ed., Handbook of Stability Testing of Pharmaceutical Products: Regulations, Methodologies, and Best Practices (Springer, New York, New York 2009), Chapter 7.
- M.W. Dong, LCGC North Am. 33(11), 764–775 (2015.)
- D. Kou, L. Wigman, P. Yehl, and M.W. Dong, LCGC North Am. 33(12), 900–909 (2015).
- M.W. Dong, LCGC North Am. 25(7), 656–666 (2007).
- M.W. Dong, LCGC North Am. 31(8), 612–622 (2013).
- M.W. Dong, LCGC North Am. 34(6), 408–419 (2016)
- M.W. Dong and K. Zhang, Trends in Anal. Chem 63, 21-30 (2014).
- M. Dong, D. Guillarme, D. Prudhomme, et al., LCGC North Am. 32(11), 868–876 (2014).
- International Council for Harmonisation of Technical Requirements for Pharmaceuticals for Human Use, ICH Q1A (R2), Stability Testing of New Pharmaceutical Products (Geneva, Switzerland, 2003).
- International Council for Harmonization (ICH) Q14, Analytical Procedure Development, and Revision of Q2(R1) Analytical Validation (Concept Paper), 2018.
- International Council for Harmonisation of Technical Requirements for Pharmaceuticals for Human Use, ICH Q2 (R1), Validation of Analytical Procedures: Methodology (Geneva, Switzerland, 1996, updated 2015).
- M.W. Dong and H.T. Rasmussen, HPLC Method Development Short Course, Eastern Analytical Symposium, Somerset, New Jersey, 2004.
Michael W. Dong is a principal of MWD Consulting, which provides training and consulting services in HPLC and UHPLC, method improvements, pharmaceutical analysis, and drug quality.
Kim Huynh-Ba is the managing director of Pharmalytik LLC. (www.pharmalytik.com), which provides consulting services in stability sciences, quality management systems, and analytical development
Joshua T. Ayers is the Principal Consultant at ASQ Solutions, LLC, which provides analytical, stability, and quality consulting services to the pharmaceutical industry. Direct correspondence to: amatheson@mjhlifesciences.com
Extracting Estrogenic Hormones Using Rotating Disk and Modified Clays
April 14th 2025University of Caldas and University of Chile researchers extracted estrogenic hormones from wastewater samples using rotating disk sorption extraction. After extraction, the concentrated analytes were measured using liquid chromatography coupled with photodiode array detection (HPLC-PDA).
Polysorbate Quantification and Degradation Analysis via LC and Charged Aerosol Detection
April 9th 2025Scientists from ThermoFisher Scientific published a review article in the Journal of Chromatography A that provided an overview of HPLC analysis using charged aerosol detection can help with polysorbate quantification.
Removing Double-Stranded RNA Impurities Using Chromatography
April 8th 2025Researchers from Agency for Science, Technology and Research in Singapore recently published a review article exploring how chromatography can be used to remove double-stranded RNA impurities during mRNA therapeutics production.


