Cryogenic- and Flow-Modulation Comprehensive Two-Dimensional Gas Chromatography–Mass Spectrometry: Obtaining Similar Chromatography Performances
In the present research, similar chromatography fingerprints were obtained using finely-tuned cryogenic-modulation (CM) and flow-modulation (FM) comprehensive two-dimensional gas chromatography–mass spectrometry (GC×GC–MS) experimental conditions.
The CM applications were carried out by using a loop-type modulator while the FM ones were performed using a seven-port wafer chip. The CM GC×GC–MS column combination consisted of a low-polarity 30 m × 0.25 mm i.d. × 0.25-μm df column and a mid-polarity 1.5 m × 0.25 mm i.d. × 0.25-μm df one. With regard to the FM GC×GC–MS column combination, the same stationary phases were used, coated on a 20 m × 0.18 mm i.d. × 0.18-μm df column and a 5 m × 0.32 mm i.d. × 0.25-μm df one. A mixture of 64 cosmetic allergens was employed to measure different chromatography parameters, such as peak widths, resolution, and signal‑to‑noise ratios. It is noteworthy that the FM combination of columns has been proposed as a standard column set, and the results herein reported confirm those previously attained (on a sample of bio-oil) in recent research.
Comprehensive two-dimensional gas chromatography (GC×GC) has been a fixture in separation science for 30 years, with the first paper published in 1991 (1). The great strength of this technique is the generation of a two‑dimensional (2D) separation space, exploiting the presence of two columns with different stationary phases, and a modulator (2). The hundreds, if not thousands, of peaks observed in GC×GC separations makes the use of mass spectrometry (MS) mandatory.
Over the last two decades, several modulators have been developed, with these divided into two large families according to the operational principle, namely thermal and valve-based modulators (3). Thermal modulation is based on the use of low temperatures to trap and focus analytes eluted from the first-dimension (1D) column and high temperatures to reinject them onto the second-dimension (2D) column. Thermal modulators can be further divided into sub‑categories, with cryogenic modulation (CM) being by far the most popular method. Further description of thermal modulators would be outside the scope of the present paper (3).
Valve-based modulators use an auxiliary pressure source for analyte transfer from the 1D column to the 2D one. The valve can be linked directly or indirectly to the 1D and 2D columns. Consequently, valve‑based modulators can be divided into subcategories as well (3).
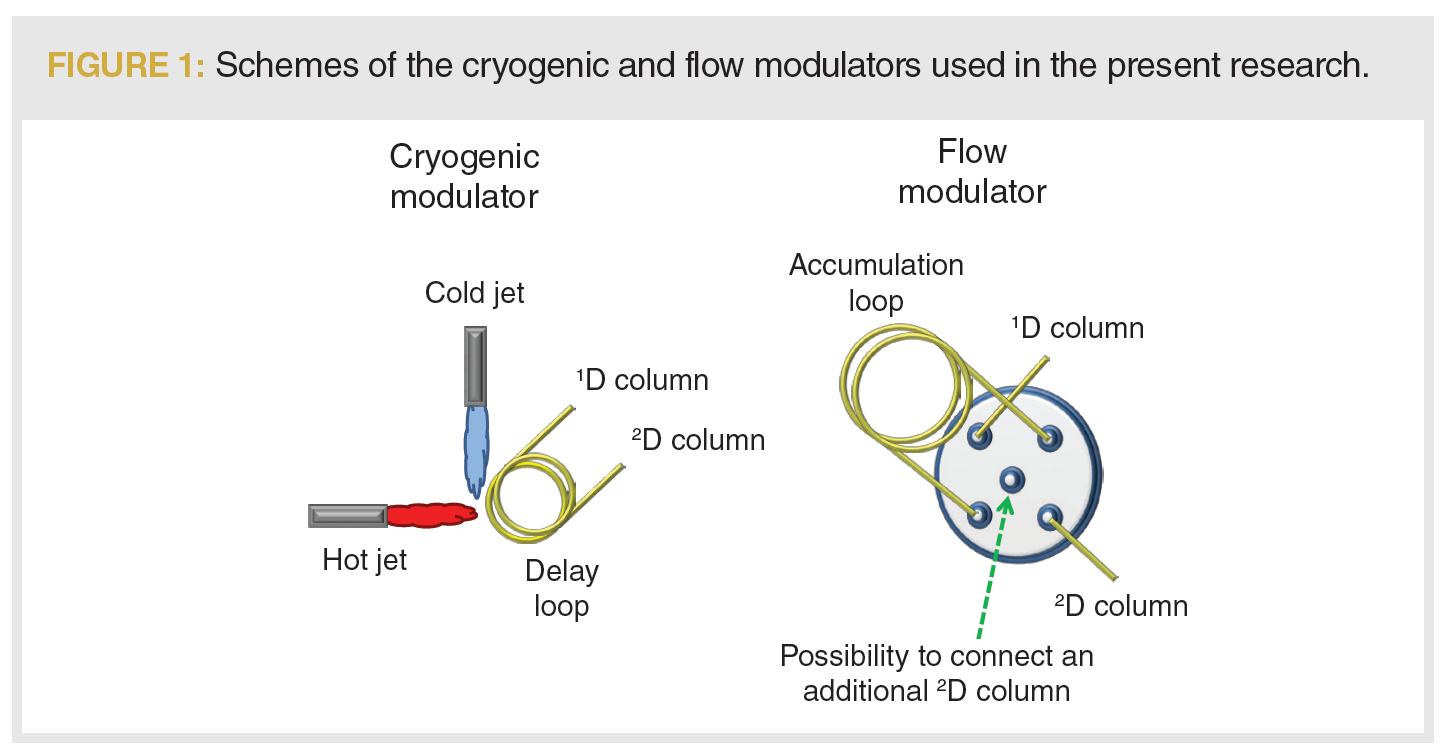
In the present research, dual‑jet loop‑type CM was used while flow‑modulation (FM) was performed by employing a seven-port wafer chip. The former approach employs a closed cycle refrigerator–heat exchanger to produce a −90 °C cold jet (eliminating the need for liquid nitrogen), and resistance heating to produce the hot jet (4). By using a delay loop (a segment of column coiled twice at the point of intersection of the hot and cold jets), it is possible to carry out dual-stage modulation employing only two jets (5). On the other hand, FM was carried out by using a seven‑port wafer chip with internal micro‑channels and an accumulation loop (6,7); such an FM method stems from an approach introduced in 2006 (8).
In a previous investigation, very similar chromatography fingerprints were obtained on a sample of coconut bio-oil by using finely‑tuned FM and CM GC×GC–MS experimental conditions (7). The aim of the present research was to confirm the results attained previously on an entirely different type of sample, namely a mixture of 64 cosmetic allergens.
Experimental
Standard Compounds and Sample Preparation
Two solutions containing 24 (fragrance allergen mix A1) and 40 (fragrance allergen mix A2) contact allergens (Table 1) were provided by Merck Life Science (Merck KGaA). The two solutions were mixed and diluted with methyl tert-butyl ether to a concentration of 10 mg/L.
Instrumentation
Cryogenic-modulation GC×GC–MS
The CM analyses were performed on a GC×GC–MS system (Shimadzu) consisting of two independent (GC2010) gas chromatographs, a cryogenic loop‑type modulator, and a single quadrupole mass spectrometer (GCMS‑QP2020). The first GC instrument was equipped with an AOC‑20i auto‑injector and a split-splitless injector (280 °C). The injected volume was 1.7 μL, at a split ratio of 10:1.
The first dimension, a SLB-5ms (SLB-5ms silphenylene polymer with similar polarity to poly [5% diphenyl:95% dimethyl siloxane]) 30 m × 0.25 mm i.d. × 0.25-µm df, was connected to a 1.5 m × 0.18 mm i.d. uncoated capillary column, used as a delay loop. The loop was then connected to a 1.5 m × 0.25 mm i.d. × 0.25-µm df SLB‑35ms proprietary polymer with similar polarity to poly (35% diphenyl:65% dimethyl siloxane) second‑dimension column. The column‑loop connections were made using two Trajan SilTite mini-unions (Ringwood). The GC conditions were as follows: The temperature program was 50–330 °C at 6 °C/min (in both GC ovens).
Meanwhile, the carrier gas (He) conditions were as follows: Constant average linear velocities of about 18.5, 80.4, and 103.9 cm/s, were generated in the first dimension, the delay loop, and the second dimension, respectively.
Modulation was carried out using a liquid nitrogen free chiller unit Zoex ZX2 (under license from Zoex Corporation). The modulation period was 4000 ms, with a hot pulse (280 °C) duration of 200 ms.
For the MS conditions, the sample was analyzed in the scan mode (electron ionization at 70 eV) using a mass range of 45–360 m/z, and a spectra generation frequency of 33 Hz. The interface and ion source temperatures were 250 °C. The data was collected using the GCMS Solution software (Shimadzu). Data processing was performed in both CM and FM applications using the ChromSquare software v. 2.3 (Shimadzu). The mass spectral database used was the FFNSC 3.0 (Shimadzu).
Flow-Modulation GC×GC–MS
The FM applications were carried out on a single-oven Shimadzu GCMS‑TQ8040 system. The GC instrument was equipped with an AOC‑20i auto-injector and a split-splitless injector (280 °C). The injected volume was 1.7 μL at a split ratio of 10:1.
The 1D column was an SLB–5 ms 20 m × 0.18 mm i.d. × 0.18-µm df, while an SLB-35ms 5 m × 0.32 mm i.d. × 0.25-µm df column was used as 2D. The columns were heated by using the same temperature program as in the CM applications.
Modulation was performed by using a 7-port wafer chip. The 7-port wafer chip was located inside the GC oven and was connected to a three-way solenoid valve using two symmetric 1.07 m stainless steel tubings of dimensions 0.97 m × 0.51 mm i.d. + 0.10 m × 0.25 mm i.d. The gas flow was supplied to the solenoid valve through an auxiliary pressure control (APC) unit. The modulator loop (stainless steel) was of dimensions 40 cm × 0.51 mm i.d. (volume = 78.6 μL). The seventh port was blocked (used for a second detector, if necessary).
The carrier gas (He) had the following conditions: the average 1D gas velocity was 12.3 cm/s with the gas flow being approximately 0.24 mL/min (injection pressure: ≈ 61 kPa) and 0.20 mL/min (injection pressure: ≈155 kPa) at the beginning and at the end of the analysis, respectively. Loop gas velocity was about 1.9 cm/s during accumulation and approximately 68.0 cm/s during reinjection. The average 2D gas velocity was approximately 257 cm/s with the gas flow being approximately 8.4 mL/min (re‑injection pressure: ≈13 kPa) and 7.1 mL/min (re-injection pressure: ≈79 kPa), at the beginning and at the end of the analysis, respectively.
The modulation period was 4000 ms, with a reinjection period of 400 ms.
The sample was analyzed in the scan mode (electron ionization at 70 eV) using a mass range of 45–360 m/z, and a spectra generation frequency of 33 Hz. The interface and ion source temperatures were set to 250 °C.
Results and Discussion
In previous research, very similar CM GC×GC–MS and FM GC×GC–MS chromatography performance was attained by finely tuning the experimental conditions. These applications involved a sample of coconut fibre bio-oil and were carried out by using a single quadrupole (CM) and a triple quadrupole (FM) mass spectrometer, both in scan mode (7). It is noteworthy that the ion sources were the same in both MS instruments. Moreover, the first quadrupole and the collision cell in the triple quadrupole system were operated only as “fly through” zones, while the operational conditions of the second quadrupole were the same as those used in the single quadrupole MS instrument. The same MS systems have been used in the present investigation.
The main objective of this study is to confirm the results attained previously on an entirely different type of sample, namely a 10 mg/L mixture of cosmetic allergens (Table 1). The injection conditions, temperature program, types of stationary phases, and modulation period (4000 ms) were the same in the CM and FM methods.
CM GC×GC–MS Method
The CM GC×GC–MS instrument was operated in the constant average linear velocity (CALV) mode: the 1D (low polarity, 30 m × 0.25 mm i.d. × 0.25‑µm df) CALV was approximately 18.5 cm/s, leading to a void time of about 162 s. The delay loop (1.5 m × 0.18 mm i.d.) gas velocity was approximately 80 cm/s, enabling a dual-stage modulation process. The 2D (mid-polarity, 1.5 m × 0.25 mm i.d. × 0.25-µm df) CALV was about 100 cm/s, leading to a void time of approximately 1.4 s (Figure 1). The phase ratio of both analytical columns was ≈250.
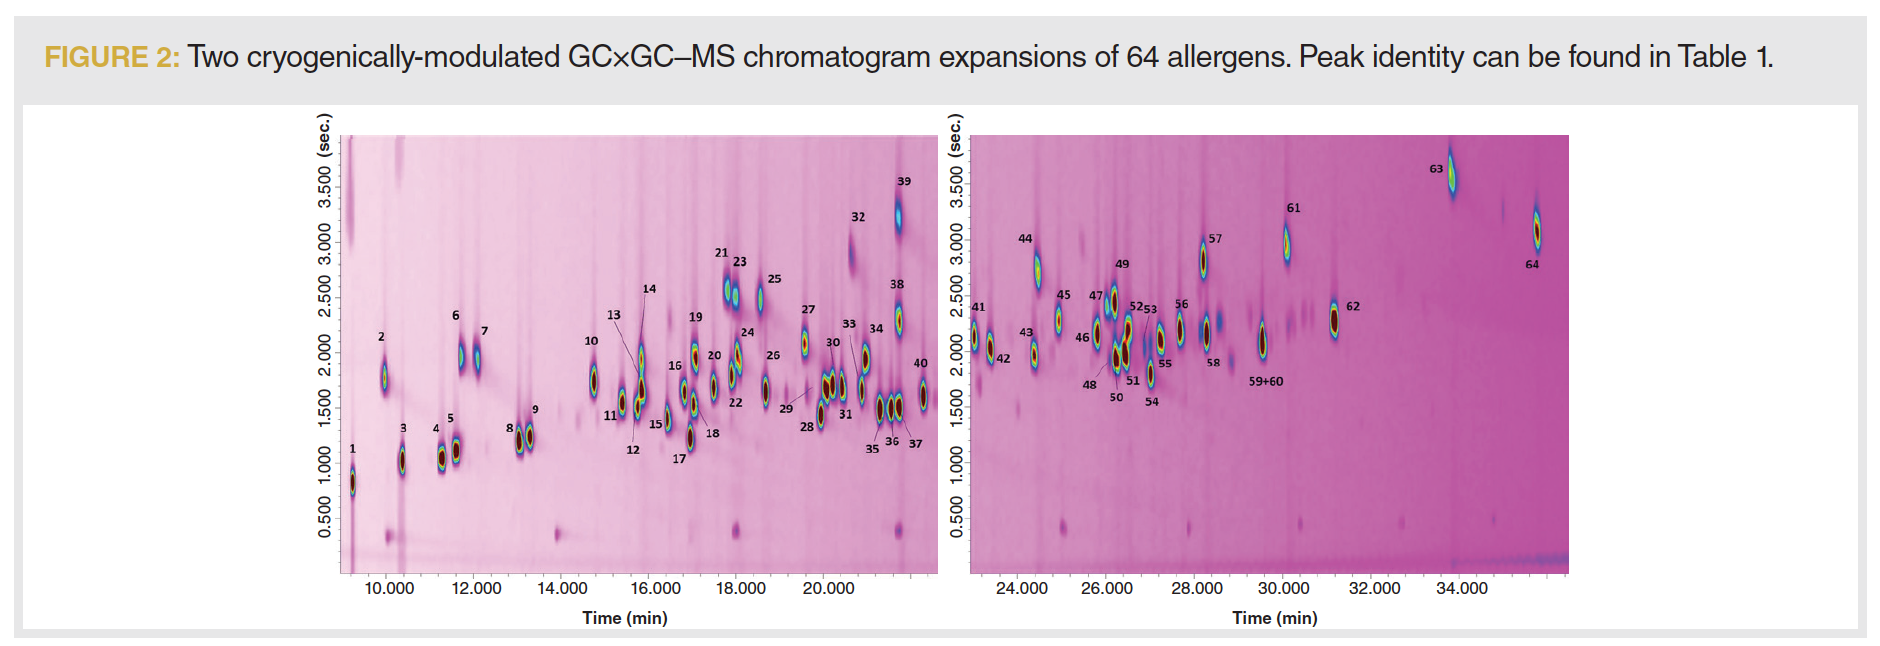
The CM GC×GC–MS result is shown in Figure 2, which contains two wrap‑around corrected chromatogram expansions to better visualize the 2D separation. The 1D retention time window in Figure 2 is equal to approximately 27 min, or 405 modulations. Considering that the 2D column, if operated under ideal chromatography conditions, could generate about 6000 theoretical plates (N) (9), then this would lead to a potential overall N value of 2,430,000 (405 × 6000). The N value of the 1D column is not considered in such a calculation.
FM GC×GC–MS Method
The FM GC×GC–MS system was operated as follows: The 1D (20 m × 0.18 mm i.d. × 0.18-µm df) CALV was approximately 12.3 cm/s, leading to a void time of about 163 s (very similar to that of the CM method). The accumulation loop (40 cm × 0.51 mm i.d.) gas velocity conditions enabled two phases of accumulation and reinjection, resulting a dual-stage process—two accumulation and two re-injection processes. The 2D (5 m × 0.25 mm i.d. × 0.32-µm df) CALV was about 260 cm/s, leading to a void time of approximately 1.9 s. The phase ratios of the 1D and 2D columns were ≈250 and ≈320, respectively. The slightly higher 2D void time in the FM method was, in part, counterbalanced by the higher column phase ratio, leading to a decrease in retention factors. The 7-port wafer chip was characterized by five ports on the front and two on the back for connections to the solenoid valve (Figure 1).
The FM GC×GC–MS result is shown in Figure 3, which again contains two wrap-around corrected chromatogram expansions. The 1D retention time window is the same as that observed in the CM analysis. Considering that the 2D column, if operated under ideal chromatography conditions, could generate circa 15,600 N (9), then this would lead to a potential overall N value of 6,318,000. Again, the efficiency of the 1D column is not considered.

Comparison of the CM and FM Results
A side-by-side measurement between MS similarities, peak widths at half height, and signal-to-noise (S/N) ratios of both systems were made, with the results reported in Table 1.
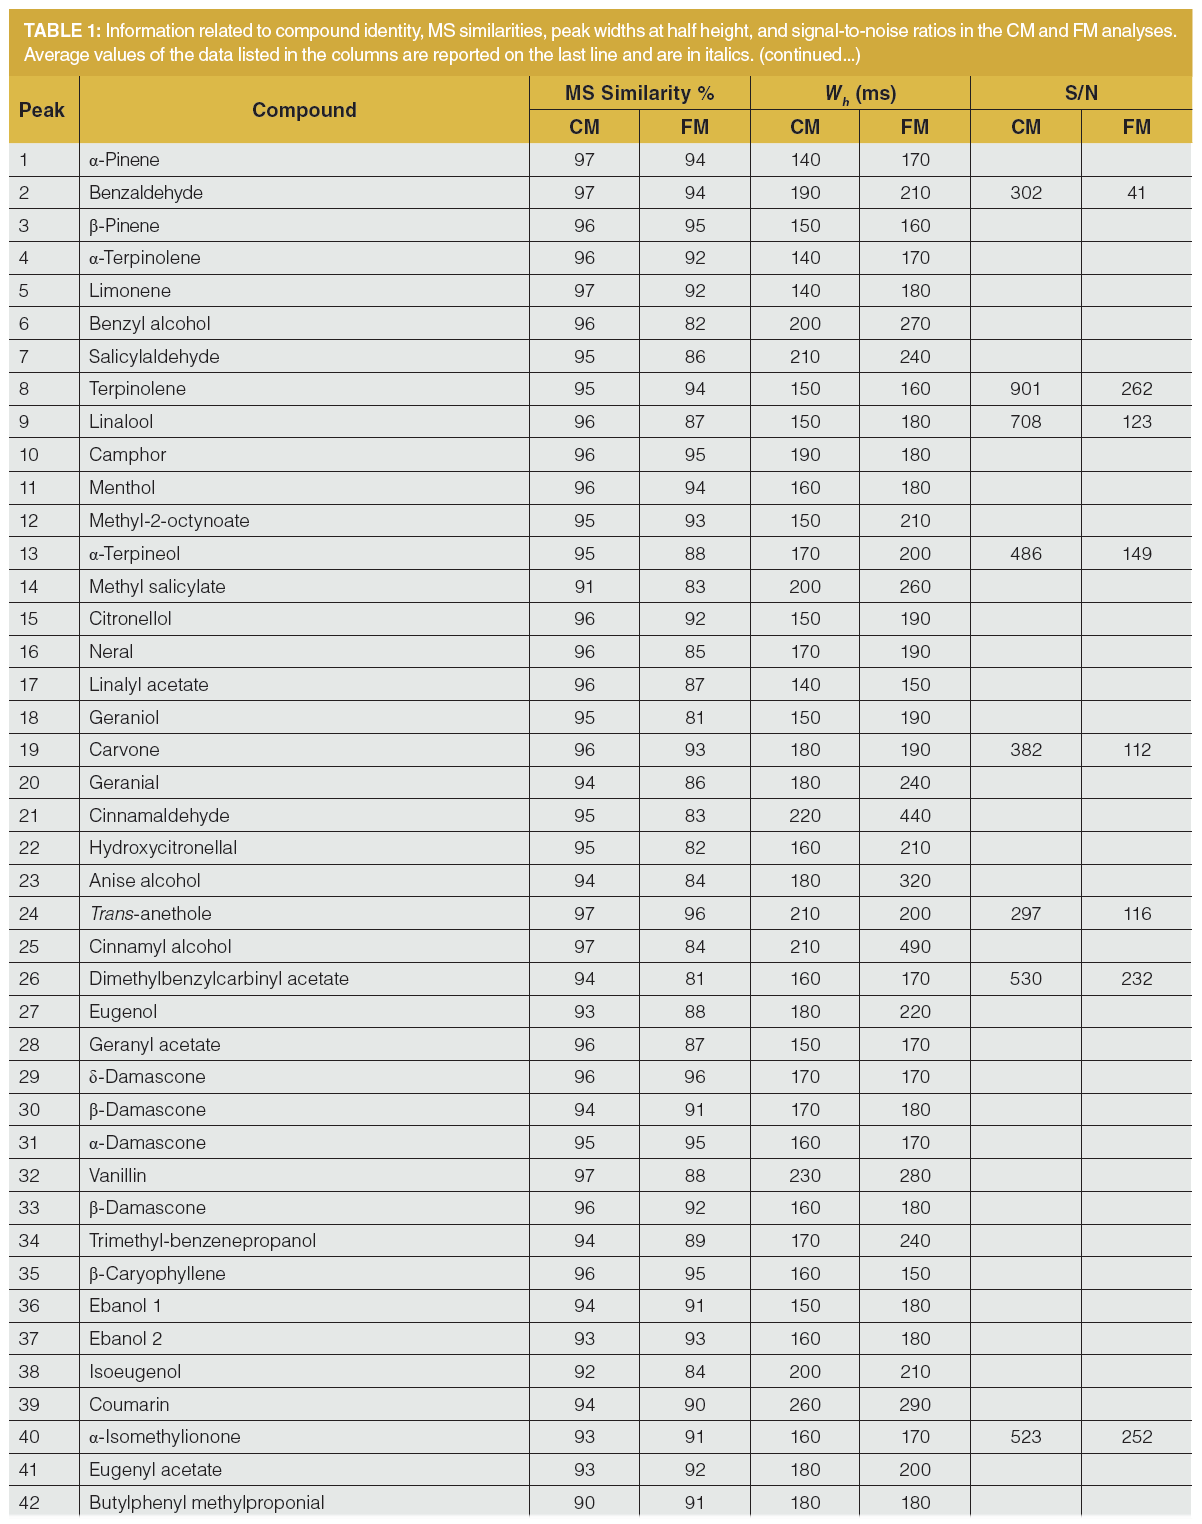
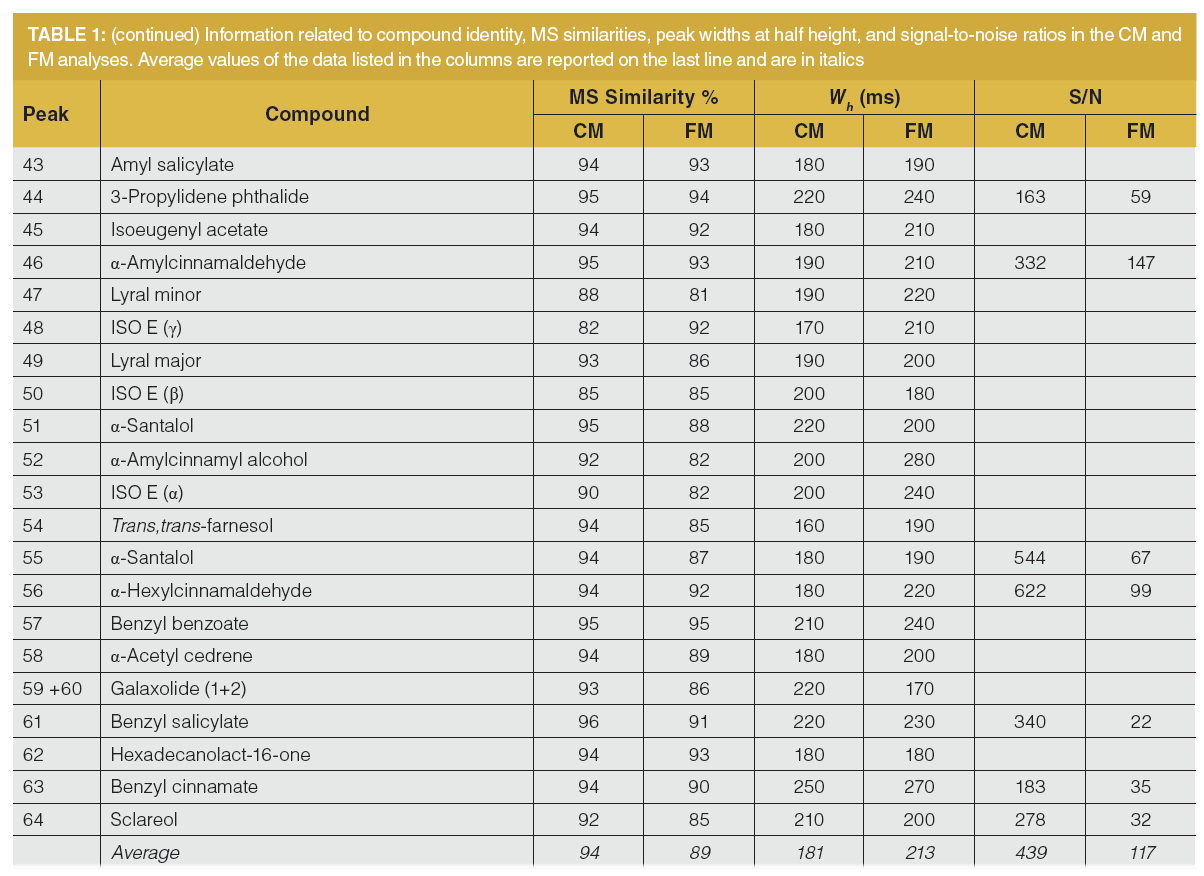
The MS similarity, in both cases, is always higher than 80%, ranging between 82 and 97% for the CM system (with an average value of 94%), and between 81 and 96% for the FM system (with an average value of 89%). The higher values obtained in the CM analysis are due to the higher S/N values. In fact, cryogenic modulation enables the 2D injection of very narrow analyte bands, leading to enhanced sensitivity.
The average peak widths at half height were 181 ms (ranging between 140–260 ms) for the CM system, and 213 ms (ranging between 150–490 ms) for the FM one.
The S/N values in Table 1, relative to 15 allergens, were the average values derived from three consecutive analyses. As expected, S/N values were always higher in the CM analysis, with an overall average increase by a factor of 3.8 (439 against 117).
First dimension retention times were similar, albeit slightly lower in the CM analysis: for 11 compounds (distributed over six pairs) spanning the chromatogram, the minimum and maximum differences were 11.3 and 19.3 s, respectively (Table 2). Such retention time differences caused 1D minimum and maximum elution temperature differences of about 1.1 and 1.9 °C, respectively (for the eleven compounds). Combining such a factor (increasing CM 2D retention), with the lower CM 2D column phase ratio (increasing retention) and the lower CM 2D void time (reducing retention times), lead to a general increase in CM 2D retention times. Again, considering the 11 compounds, the minimum and maximum differences were 0.47 and 0.72 s, respectively, leading to an increase in retention factor (k) values of just over a unit in the CM analysis (Table 2).
Plate numbers were also calculated and were always higher in the CM analysis: The average N values calculated for the 11 compounds in the CM and FM analyses were 3372 and 1917 respectively (Table 2).
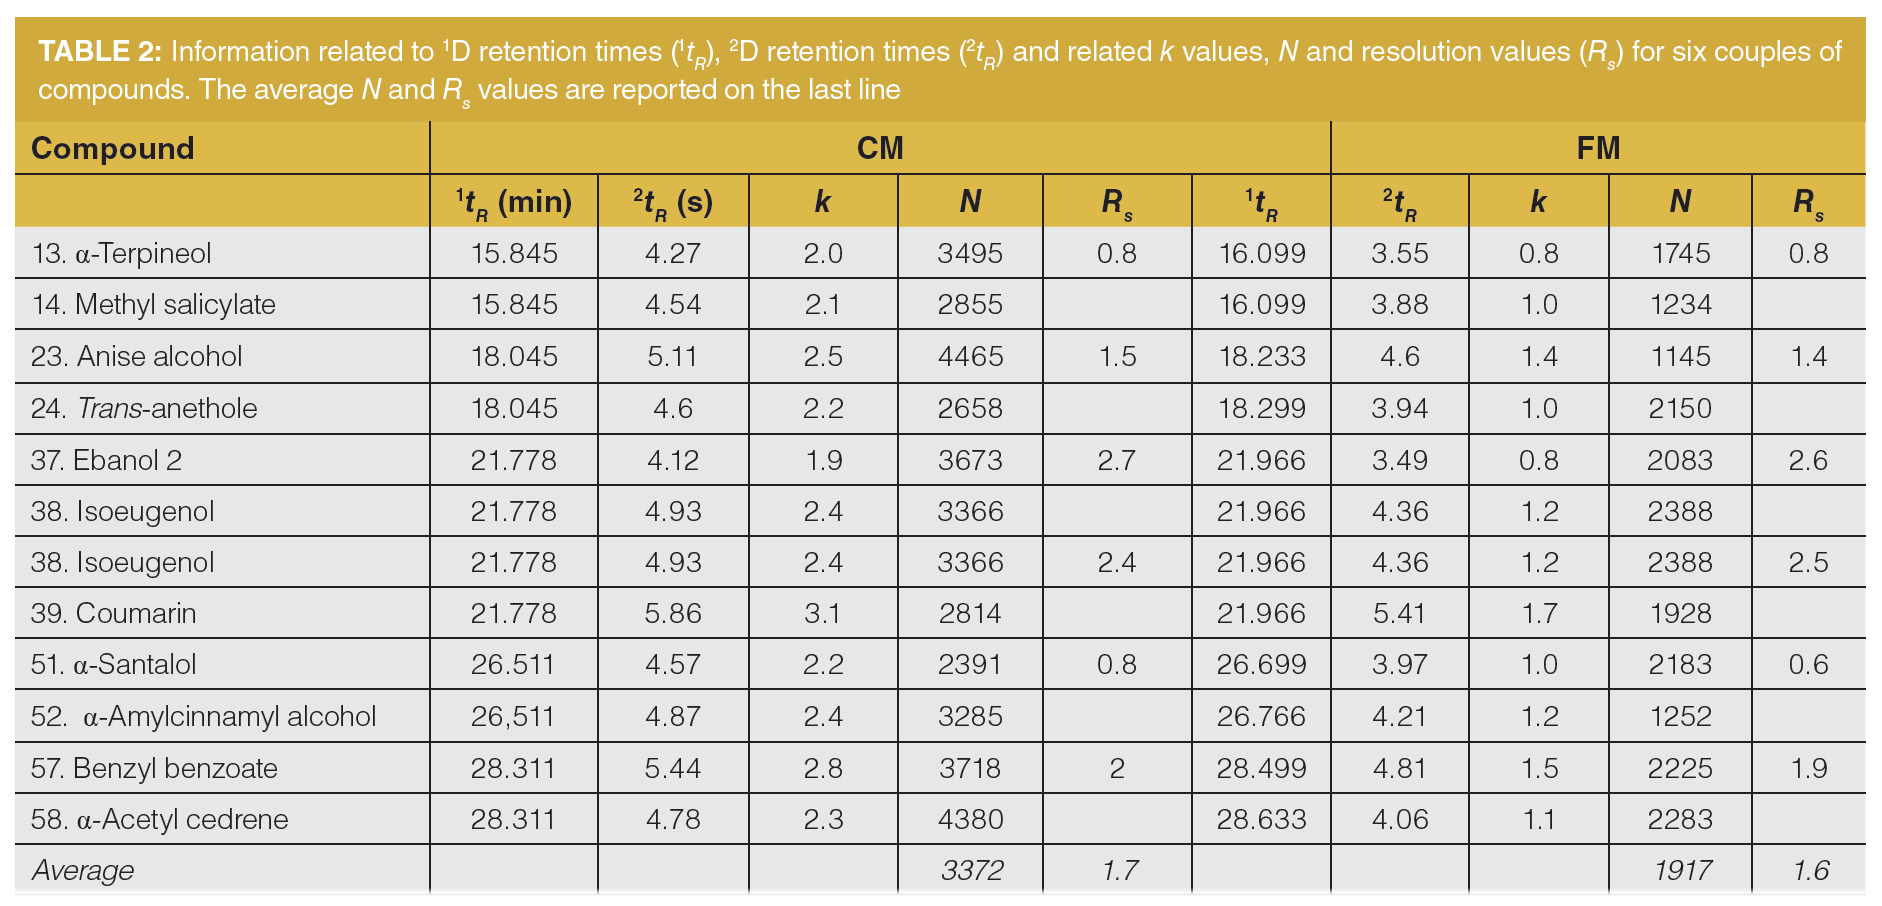
Resolution was calculated for six pairs of compounds, the obtained values are reported in Table 2. As can be seen, the values for CM system are slightly higher, with an average value of 1.7 (ranging between 0.8–2.7), while an average value of 1.6 was obtained for FM system (ranging between 0.6–2.6).
Conclusion
It can be affirmed that the results attained in the present research confirm those reported previously (7). The proposed standard FM GC×GC–MS column set provided an altogether similar chromatography result compared to that obtained by using a CM GC×GC–MS standard column set. The main difference related to the average plate numbers, which were previously found to be slightly higher in the FM approach (average N values for five compounds: 2978 vs. 2680) (7). Such a divergence could be due to the fact that, in reference (7), a 4× higher amount was analyzed in the FM analysis, to counterbalance the higher CM sensitivity. In the present research, equal sample amounts were subjected to analysis using the two methods, leading to lower signals in the FM analyses. Even so, and on the basis of the results attained, the FM GC×GC–MS column set proposed, can be potentially considered as a standard GC×GC column combination within the context of flow-modulated applications.
References
- Z. Liu, and J.B. Phillips, J. Chromatogr. Sci. 29, 227–231 (1991).
- P.Q. Tranchida, Advanced Gas Chromatography in Food Analysis (The Royal Society of Chemistry, Cambridge, United Kingdom, 2020).
- H.D. Bahaghighat, C.E. Freye, and R.E. Synovec, Trac-Trend. Anal. Chem. 113, 379–391 (2019).
- Zoex Corporation. Zx2 Thermal Modulator. https://zoex.com/products/zx2-thermal-modulator.
- P.Q. Tranchida, M. Zoccali, F.A. Franchina, A. Cotroneo, P. Dugo, and L. Mondello, J. Chromatogr. A. 1314, 216–223 (2013).
- F.A. Franchina, M. Maimone, P.Q. Tranchida, and L. Mondello, J. Chromatogr. A. 1441, 134–139 (2016).
- I. Aloisi, T. Schena, B. Giocastro, M. Zoccali, P.Q. Tranchida, E. Bastos Caramão, and L. Mondello, Anal. Chim. Acta. 1105, 231–236 (2020).
- J.V. Seeley, N.J. Micyus, J.D. McCurry, and S.K. Seeley, Am. Lab. 38, 24–26 (2006).
- F. David, D.R. Gere, F. Scanlan, and P. Sandra, J. Chromatogr. A 842, 309–319 (1999).
ABOUT THE AUTHORS
Barbara Giocastro is currently a Ph.D. student in chemical sciences at the University of Messina.
Ivan Aloisi is currently a Ph.D. student in chemical sciences at the University of Messina.
Mariosimone Zoccali is an assistant professor of analytical chemistry in the Department of Mathematical and Computer Science, Physical Sciences and Earth Sciences at the University of Messina, in Italy. His research focuses on the development of multidimensional chromatographic methods for the analysis of complex samples. Direct correspondence to: mzoccali@unime.it
Peter Q. Tranchida is an associate professor of food chemistry in the Department of Chemistry, Biological, Pharmaceutical, and Environmental Sciences at the University of Messina, in Italy. His research activities focus mainly on the study of complex food samples using advanced chromatography processes.
Luigi Mondello is a full professor of Analytical Chemistry at the University of Messina. His research is focused on the development of multidimensional chromatographic instrumentation and software, coupled to state-of-the-art MS, for the study of complex matrices constituents and contaminants. He is the author of around 500 scientific papers and 1000 conference presentations, with an H-index of 64 (Google Scholar) and a total impact factor of more than 1000.
ABOUT THE COLUMN EDITOR
“Column Watch” Editor David S. Bell is a director of Research and Development at Restek. He also serves on the LCGC Editorial Advisory Board. Over the past 20 years, he has focused his efforts on the design, development, and application of chromatographic stationary phases to advance gas chromatography, liquid chromatography, and related hyphenated techniques. His main objectives have been to create and promote novel separation technologies and to conduct research on molecular interactions that contribute to retention and selectivity in an array of chromatographic processes. His research results have been presented in symposia worldwide, and have resulted in numerous peer-reviewed journal and trade magazine articles.
Direct correspondence to: amatheson@mjhlifesciences.com

New Study Reviews Chromatography Methods for Flavonoid Analysis
April 21st 2025Flavonoids are widely used metabolites that carry out various functions in different industries, such as food and cosmetics. Detecting, separating, and quantifying them in fruit species can be a complicated process.
University of Rouen-Normandy Scientists Explore Eco-Friendly Sampling Approach for GC-HRMS
April 17th 2025Root exudates—substances secreted by living plant roots—are challenging to sample, as they are typically extracted using artificial devices and can vary widely in both quantity and composition across plant species.

.png&w=3840&q=75)

.png&w=3840&q=75)


.png&w=3840&q=75)


.png&w=3840&q=75)


