Determining Organotin Compounds in Marine Water and Sediment Samples using HS-SPME–GC–FID
LCGC Europe
This article describes a fast, simple and clean procedure to determine three organotin compounds (monobutyltin, dibutyltyin and tributyltin) in environmental samples.
Organotin compounds (OTCs) have been extensively used as biocides, pesticides, fungicides, bactericides and catalysts,1 and also as antifouling paints for the protection of ship bulls in polyvinyl chloride (PVC) stabilization.2 High concentrations of OTC can, therefore, accumulate in the environment and, because they are soluble in lipids, OTC may penetrate into tissues and the central nervous system with a potentially high toxicity to organisms and tendency to bioaccumulation.3 They can cause serious problems such as disturbances in the hormonal system and even the occurrence of imposex,4 so are regarded as endocrinal disrupters. Moreover, they can be potentially transmitted to humans by the trophic chain.5 As a result, most countries have banned the use of antifouling paints containing tributyltin (TBT) on small boats, and it was included in the European Union priority pollutant list for fresh waters: RD 995/2000 defines TBT as a quality parameter and establishes its annual medium value as 0.02 µg/L.
TBT can be degraded in the environment into more polar metabolites, such as dibutyltin (DBT) and monobutyltin (MBT). The observed toxicity effects strongly depend on the compound and the biological species involved.6,7 The study of their role in ecosystems is important to assess their environmental impact. It is, therfore, important to develop highly sensitive, robust, accurate and fast analytical methods to determine OTC in environmental samples.
KEY POINTS
Most of the analytical methods used in OTC determination combine a separation technique such as gas chromatography (GC)8 or liquid chromatography (LC)9 with element-selective detection such as atomic absorption spectrometry (AAS),10 atomic emission spectrometry (AES),11 mass spectrometry (MS),12 inductively coupled plasma mass spectrometry (ICP-MS),13 flame photometric detection (FPD)14 or pulsed flame-photometric detection (PFPD)15 to provide sufficient sensitivity.
To apply GC techniques to determine OTCs, a derivatization step is useful to form a key step. The three most common derivatization procedures are hydride generation,16 Grignard alkylation17 and ethylation with sodium tetraethylborate (STEB).18 STEB methods have been favoured over Grignard alkylation methods because ethylation with STEB can be performed in aqueous media, and it suffers less interference than the hydride generation method.
Preconcentration techniques play an important role for the extraction and determination of low OTC concentrations in real environmental samples, especially in water samples because of their low solubility. Solid–liquid extraction (SLE) is the most widely used technique for the preconcentration of OTCs.19 However, it is time-consuming (it requires stirring, shaking, sonication and centrifugation) and it involves the use of large volumes of organic solvents, as well as complexing agents.20 Other techniques used include supercritical fluid extraction (SFE),21 microwave-assisted extraction (MAE),22 pressurized liquid extraction,23 liquid phase microextraction (LPME),24 single drop microextraction (SDME)25 and solid-phase microextraction (SPME),26 which have been developed in recent years. SPME is a solvent-free technique with the advantages of simplicity and low cost. In addition, in the headspace mode (HS), the fibre is protected from matrix compounds, the extraction of non-volatile compounds is avoided and the extraction process can be faster.27,28 Recently, a review about TBT residues determination in marine environment was published.29
In this article we propose a methodology that consists of headspace solid-phase microextraction of the OTCs, previously ethylated with STEB, followed by gas chromatography and flame ionization detection (HS-SPME–GC-FID). We have mainly focused on the evaluation of the parameters of derivatization of OTCs and HS-SPME to reduce the analysis time,11 the reagent and solvent consumption15 and the costs, as well as improving the method sensitivity with respect to previously published works.9,24 The usefulness of the method was demonstrated by evaluating OTC pollution in marine water and sediment samples from Gandia's port area (Valencia, Spain); it is an interesting study because this port combines commercial, fishing and sport areas.
Experimental
Reagents and solutions
All the reagents were of analytical grade. Monobutyltin (MBT), dibutyltin (DBT), tributyltin (TBT) and sodium tetraethylborate (STEB) were obtained from Aldrich (Stenheim, Germany). Acetonitrile and methanol were of HPLC grade from J.T. Baker (Deventer, Holland). Hydrochloric acid and sodium acetate trihydrate were obtained from Scharlau (Barcelona, Spain). Stock solutions of organotin compounds were prepared in methanol. Working mixture solutions were prepared by dilution with deionized water. All solutions were stored in the dark at 4 °C.
The STEB solution [2% (m/v)] was prepared in a glovebag under dry nitrogen, in a degasified 0.1 M sodium hydroxide solution.18 STEB solution aliquots were frozen (stable during a month) until the analysis.
Apparatus and chromatographic conditions
The SPME holder and fibres [100 µm thickness polydimethylsiloxane (PDMS)] were obtained from Supelco (Bellefonte, Pennsylvania, USA). The gas chromatographic system was equipped with flame ionization detector (FID) (Hewlett-Packard 6890 Series, Little Falls, Delaware, USA). The injection mode was splitless and the temperature was set at 250 °C. The column was a 30 m x 0.32 mm i.d. x 0.25 µm film thickness HP-5 (Agilent Techonologies). The oven was programmed from 40 °C (1 min) at 20 °C/min to 220 °C (3 min) and the carrier gas was helium at a constant pressure of 80 kPa. The detector temperature was set at 250 °C. An ultrasonic cleaner bath and a centrifuge were obtained from J.P. Selecta (Barcelona, Spain).
Analytical procedure for water samples
Analysis of aqueous standards: Working aqueous standard solutions were prepared by adding the appropriate volume of the aqueous mixture solution (15 µg/L of each analyte) to 19 mL of miliQ-Water in 40 mL amber vials with silicon septa (Supelco). Then, 1 mL of sodium acetate buffer (pH 5; 0.15 M) and 10 µL of STEB [2% (m/v)] solution were added to derivatize the analytes. The standard concentrations obtained were between 0.05–15 µg/L for each OTC. After 5 min stirring at 800 rpm, the fibre was exposed to the headspace for 15 min at 40 °C. Then, the fibre was withdrawn into the needle of the holder and it was placed into the GC injector to perform the derivatives desorption (3 min).
Analysis of water samples: To evaluate the pollution by OTCs in Gandia's port area, three marine water samples were collected from different points of the port. They were filtered through 0.45 µm syringe filters (Teknokroma, Barcelona, Spain). After that, the same analytical procedure described above for aqueous standards was applied to the samples. Each sample was analysed in triplicate.
Analytical procedure for sediment samples
Analysis of aqueous standards: Working aqueous standard solutions were prepared by adding 300 µL of the methanolic OTC mixture solutions (5–0.5 µg/mL for MBT, 0.5–0.05 µg/mL for DBT and 0.5–0.05 µg/mL for TBT) to 3 mL of an extractant mixture (concentrated hydrochloric acid–acetonitrile, 1:1, v/v). The mixture was sonicated for 15 min. Then, the pH of 2 mL mixture was fixed at 5 by adding the appropriate volume of sodium hydroxide (10 M) and sodium acetate buffer (pH 5, 1.5 M) solutions to 19 mL. The resulting solution was stirred (40 °C for 3 min). After that, 20 µL of STEB [2%, (m/v)] solution was added to volatilize the derivatives for 5 min, and then the fibre was 5–50 µg/L for MBT and between 0.5–5 µg/L for DBT and TBT.
Analysis of sediment samples: Three marine sediment samples (Gandia's port area) were analysed. 0.5 g of sediment was accurately weighed and then 3 mL of the extractant mixture was carefully added. The mixture was sonicated during 15 min and centrifuged at 3200 rpm for 5 min. After that, the same analytical procedure described above for aqueous standards was applied to the samples. Each sample was analysed in triplicate.
Results and discussion
Optimization of the derivatization and the headspace solid-phase microextraction
The HS-SPME was selected as sampling technique because of its suitability in the determination of butyltin compounds derivatizated with STEB. The parameters evaluated were: STEB solution volume, reaction pH, absorption time, headspace volume, procedure temperature and desorption time. All these parameters were tested for an aqueous standard solution of 15 µg/L of each analyte.
Before SPME, the analytes were derivatized with STEB using volumes between 10–500 µL. Lower STEB volumes were not assayed to ensure a fifty-times excess over the analyte concentration. It was observed that reducing the STEB volume, the derivatives signals increased and the secondary STEB products were removed. As a result, 10 µL was the optimum volume for water samples and 20 µL for sediment samples. The presence of other organometallic compounds in sediment samples would explain the necessity of increasing the STEB volume in this kind of samples. It is important to note that the STEB concentration used in this work was significantly reduced compared with previous works.15,18
Then, the reaction pH was tested between 3 and 9. At pH ≤ 4 OTCs did not react with STEB and at pH ≥ 7 TBT peak slightly increased, but MBT and DBT peaks decreased. Therefore, pH 5 was selected as optimum to perform the simultaneous derivatization of the three analytes. It was fixed by means of a sodium acetate buffer. These results are in accordance to that obtained in the bibliography.18
The volatilization of the derivatives required 5 minutes. After that, the fibre was exposed to the headspace and the absorption time was ranged from 5–25 minutes. It was observed that the signals increased until 15 min and no improvement was observed for longer times (see Figure 1). So, 15 minutes was selected as the optimum absorption time.
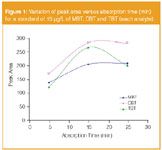
Figure 1
Three vials (2, 20 and 40 mL) were used to study the optimum headspace volume (1, 10 and 20 mL, respectively). All the chromatographic peaks increased with the headspace volume: a headspace volume of 20 mL provided peak areas between 10 and 20 times higher than a headspace of 1 mL. Therefore, 20 mL was selected for further work.
The temperature of the procedure (derivatization and extraction) was studied between 20–80 °C. Figure 2 shows the influence of the temperature over the peak area. As we can see, the best signals for the three organotin compounds were obtained working at 40 °C. Signals decreased at higher temperature levels, which can be explained by the exothermic process involved in the SPME absorption.
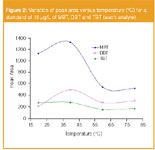
Figure 2
Finally, the fibre was introduced in the GC system and desorption time was evaluated between 1 and 5 minutes. It was observed that the fibre was completely clean with 3 minutes of desorption. Therefore, it was selected as optimum desorption time. On the basis of the above results, the conditions selected were as follows: 10–20 µL of STEB solution, reaction pH of 5, 15 minutes of absorption time, 20 mL of headspace volume, 40 °C of procedure temperature and 3 minutes of desorption time.
Optimization of the solid–liquid extraction (SLE)
The evaluation of the SLE efficiency was performed on 0.5 g of OTC-free sediment which was spiked with 300 µL of methanolic standard. The mixture was placed in an ultrasonic bath for 30 min to disperse the analyte thoroughly into the matrix and then the methanol was evaporated using a nitrogen stream. The effects of several extraction parameters (mixture, volume, number of extractions and temperature) were evaluated.
First, the organic solvent type (acetonitrile, methanol and hexane) and acid type (acetic, hydrochloric and sulphuric) were assayed. In general, the extraction efficiency of OTCs improved with the mixture acetonitrile–hydrochloric acid, providing satisfactory recoveries for TBT (84 ± 9%) and DBT (68 ± 6%).
Next the ratio between acetonitrile and hydrochloric acid was studied (1:0, 1:1, 1:3 and 1:9). Best recoveries were obtained with the 1:1 ratio (93 ± 4% for TBT, 69 ± 3% for DBT). After that, the hydrochloric acid was evaluated at two concentrations (2 and 12 M). Results showed that the recoveries increased with the acid concentration used (92 ± 2% for TBT, 75 ± 5% for DBT). Therefore, 12 M was selected as optimum.
Then the extraction mixture volume was studied (3 and 6 mL). However, no influence was observed over the chromatographic signals, so 3 mL was the volume selected for further work. After that, the number of SLE was studied. Results showed that only one extraction was required to obtain maximum recoveries (100 ± 3% for TBT, 70 ± 4% for DBT and 20 ± 5% for MBT).
Finally, the extraction temperature was studied from 20–90 °C. Temperatures higher than 70 °C caused the degradation of OTCs and no improvement was observed between 20–70 °C, so 20 °C was selected for further work.
On the basis of the above results, the conditions selected were as follows: 3 mL of hydrochloric acid 12 M:acetonitrile (1:1) and extraction temperature of 20 °C. Some difficulties were found relating to MBT extraction from sediment, the average recovery was 25 ± 4%. This fact can be explained by its higher polarity. Therefore, a higher polarizability solvent would be required to increase the MBT extraction efficiency.
Analytical performance
Analytical data have been obtained for aqueous standards by means of the analytical procedures proposed for water and sediment samples, respectively.
Analytical procedure for water samples: The calibration equations are presented in Table 1. The values on this table indicate adequate linearity in the working concentration interval (0.05–15 µg/L, each analyte). The limits of detection (LOD) were determined experimentally by processing standard solutions containing decreasing concentrations of the analytes. The LODs were established as concentrations that produced a peak with a signal-to-noise ratio of three. The values obtained are also listed in Table 1. As we can see, the LODs obtained were 100 times lower than those obtained in previous works.9,24,26 The precision was studied by means of the intra-day and inter-day variation coefficients. As we can see in Table 1, these coefficients were ≤20% in all cases.
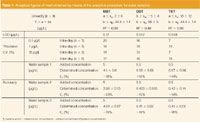
Table 1: Analytical figures of merit obtained by means of the analytical procedure for water samples.
Validation studies were performed by spiking three real marine water samples with 5 µg/L of MBT, 0.5 µg/L of DBT and 0.5 µg/L of TBT. The concentrations of the three analytes in these samples were established from the calibration equations listed in Table 1. As we can see in Table 1, the determined concentrations were comparable to the added concentrations, with relative errors between +14 and -20%.

Table 2: Analytical figures of merit obtained by means of the analytical procedure for sediment samples.
Analytical procedure for sediment samples: The calibration equations are presented in Table 2. The values on this table indicate adequate linearity in the working concentration interval (30–300 ng/g for MBT and 3–30 ng/g for DBT and TBT).
The LODs obtained are also listed in Table 2. They were between 5–15 times lower than those obtained in previously published papers.14,20 The intra-day and inter-day variation coefficients were ≤20% in all cases.
Validation studies were performed by means of standard addition curves applied to three real marine sediment samples. Therefore, 300 µL of methanolic solutions with appropriate concentration of OTCs (0.5–5 µg/L of MBT, 0.05–0.5 µg/L of DBT and 0.05–0.5 µg/L of TBT) were added to the sediment samples. They were placed in the ultrasonic bath for 30 min and the organic solvent was evaporated by means of a nitrogen stream to achieve samples as similar as possible to the real solid ones. Finally, the same SLE procedure described above was applied to these samples.
Recoveries, calculated as R=(Ss/Saq) x 100, where Ss is the standard addition curve slope and Saq is the external calibration curve slope, are shown in Table 2. As we can observe, they did not depend on the origin of sample. The mean recovery values were 28 ± 4% (MBT), 75 ± 11% (DBT) and 111 ± 11% (TBT), therefore, MBT and DBT presented matrix effect.
These recovery results were compared with those obtained by means of other extraction methods using methanol, toluene, hexane, acetic acid and complexing agents (tropolone, NaDDC), as well as increasing the sonication time to 1 h. It was observed that the accuracy did not improve, obtaining recoveries from 270–280% for MBT, from 70–90.8% for DBT and from 90.8–99% for TBT.19,26
Application to real samples
Analysis of water samples: The concentrations found in the determination of OTCs in water samples (Table 3) were between 0.15–0.24 µg/L for MBT and between 0.043–0.13 µg/L for DBT. TBT was not found in any sample. These results allow the evaluation of the pollution of the area of study and they reflect that TBT may be degraded in the aqueous media into their metabolites, MBT and DBT. It is important to state that higher concentrations corresponded to MBT. Typical chromatograms for the marine water sample 3 and the same sample spiked with 5 µg/L of MBT, 0.5 µg/L of DBT and 0.5 µg/L of TBT are shown in Figure 3.
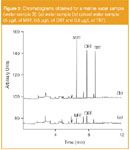
Figure 3
Analysis of sediment samples: The concentrations found in the determination of OTCs in sediment samples are summed up in Table 3. As we can see, sediment samples contained MBT at concentration levels higher than 50 ng/g and TBT at concentration levels around 25 ng/g, but DBT was not found in any sample. Typical chromatograms for the sediment sample 2 and the same sample spiked with 144 ng/g of MBT and 14.4 ng/g of DBT and TBT are shown in Figure 4.
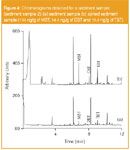
Figure 4
Conclusions
The procedure proposed in this work allows the simultaneous determination of three butyltin compounds in complex matrix samples such as marine water and sediments. This methodology is fast, simple and clean. In fact, compared with previously published papers, the described extraction procedure significantly reduced the sonication time (from 1 h to 15 min),1,27 the volume of extractant mixture (from 20 to 3 mL)26 and the number of extraction steps, avoiding liquid–liquid extraction and solvent evaporation.19 Moreover, the toxicity of the procedure was reduced by using acetonitrile as organic solvent instead of toluene or hexane.17

Table 3: Concentrations of OTCs found in the different water and sediment samples analysed by the proposed procedures (n = 3).
In the study of the derivatization, the amount of STEB used has been minimized, enhancing the sensitivity while reducing the reagent consumption and the cost of analysis and avoiding the appearance of secondary products. The solid-phase microextraction in the headspace gets good selectivity and clean chromatograms. The high sensitivity achieved allows the determination of TBT at concentrations that are below the limits established by water legislation. Therefore, the proposed method can be applied for quality water control.
The results obtained for different environmental samples revealed that the area of study is interesting for an exhaustive evaluation of the pollution because of OTCs and subsequent study of minimization of these compounds.
Maria Consuelo Cháfer Pericás is a scientist at the Polythechnic University of Valencia. She specializes in solid phase microextraction coupled to multidimensional chromatographic methods, particularly for environmental standard analysis.
Susana Meseguer Lloret is adjunct professor at the Polytechnic University of Valencia and specializes in chromatography coupled to chemiluminescence to determine pesticides in real water samples.
Sagrario Torres Cartas is adjunct professor at the Polytechnic University of Valencia. She is involved in a collaborative project based on luminiscence determination of pesticides in environmental samples.
Miguel Rodilla Alamá is a full professor for Environmental Science at the Polytechnic University of Valencia and is now focusing his research at the IGIC as principal investigator on biological resources in coastal ecosystems.
References
1 S. Lo, I. King, A. Alléra and D. Klingmüller, Toxicology in Vitro, 21, 502–508 (2007).
2. I. Arambarri, R. Garcia and E. Millan, Chemosphere, 51, 643–649 (2003).
3. J. Strand and G. Asmund, Environmental Pollution, 123, 31–37 (2003).
4. J. Strand, C.M. Glahder and G. Asmund, Environmental Pollution, 142, 98–102 (2006).
5. B. Rocher et al., Aquatic Toxicology, 79, 65–77 (2006).
6. L. El Hassani et al., Science of the Total Environment, 348, 191–198 (2005).
7. Y. Morcillo and C. Porte, Trends in Analytical Chemistry, 17, 109–116 (1998).
8. K. Bowles et al., Analytica Chimica Acta, 509, 127–135 (2004).
9. K. Békri, R. Saint-Louis and E. Pelletier, Analytica Chimica Acta, 578, 203–212 (2006).
10. B. Krishan, R. Muñoz-Olivas and C. Cámara, Spectrochimica Acta Part A, 59, 209–210 (2004).
11. M. Zabaljauregui et al., Journal of Chromatography A, 1148, 78–85 (2007).
12. G. Centineo et al., Analytical and Bioanalytical Chemistry, 384, 908–914 (2006).
13. R. Wahlen and T. Catterick, Journal of Chromatography B, 783, 221–229 (2003).
14. M. Gallego, M. Liva, R. Muñoz and C. Cámara, Journal of Chromatography A, 1114, 82–88 (2006).
15. A. Locateli, R. Favoreto and M. Santiago-Silva, Chromatographia, 58, 97–102 (2003).
16. R. Ritsema et al., Environmental Pollution, 99, 271–277 (1998).
17. M. Abalos et al., Journal of Chromatography A, 788, 1–49 (1997).
18. K. Bowles, S. Apte and L. Hales, Analytica Chimica Acta, 477, 103–111 (2003).
19. M. Abalos, J.M. Bayona and P. Quevauviller, Applied Organometallic Chemistry, 12, 541–549 (1998).
20. A. Godoi, R. Montone and M. Santiago-Silva, Journal of Chromatography A, 985, 205–210 (2003).
21. J.M. Bayona, Trends in Analytical Chemistry, 19, 107–112 (2000).
22. X. Wang et al., Journal of Chromatography B, 843, 268–274 (2006).
23. A. Wasik, B. Radke, J. Bolalek and J. Namiésnik, Chemosphere, 68, 1–9 (2007).
24. H. Shioji, S. Tsunoi, H. Harino and M. Tanaka, Journal of Chromatography A, 1048, 81–88 (2004).
25. V. Colombini et al., Talanta, 63, 555–560 (2004).
26. E. Millán and J. Pawliszyn, Journal of Chromatography A, 873, 63–71 (2000).
27. C. Devos et al., Journal of Chromatography A, 1079, 408–414 (2005).
28. M. Bravo et al., Analytical and Bioanalytical Chemistry, 383, 1082–1089 (2005).
29. B. Antizar, Environment International, 34, 292–308 (2008).

New Study Reviews Chromatography Methods for Flavonoid Analysis
April 21st 2025Flavonoids are widely used metabolites that carry out various functions in different industries, such as food and cosmetics. Detecting, separating, and quantifying them in fruit species can be a complicated process.
University of Rouen-Normandy Scientists Explore Eco-Friendly Sampling Approach for GC-HRMS
April 17th 2025Root exudates—substances secreted by living plant roots—are challenging to sample, as they are typically extracted using artificial devices and can vary widely in both quantity and composition across plant species.
Sorbonne Researchers Develop Miniaturized GC Detector for VOC Analysis
April 16th 2025A team of scientists from the Paris university developed and optimized MAVERIC, a miniaturized and autonomous gas chromatography (GC) system coupled to a nano-gravimetric detector (NGD) based on a NEMS (nano-electromechanical-system) resonator.
Miniaturized GC–MS Method for BVOC Analysis of Spanish Trees
April 16th 2025University of Valladolid scientists used a miniaturized method for analyzing biogenic volatile organic compounds (BVOCs) emitted by tree species, using headspace solid-phase microextraction coupled with gas chromatography and quadrupole time-of-flight mass spectrometry (HS-SPME-GC–QTOF-MS) has been developed.

.png&w=3840&q=75)

.png&w=3840&q=75)


.png&w=3840&q=75)


.png&w=3840&q=75)


