Determination of Cannabidiol and Additional Cannabinoid Content in Hemp Tea
Quantification of cannabinoids is essential for the accurate labelling of hemp products, both for quality control and for establishing legality with regards to d9-tetrahydrocannabinol (THC) content. For this article, the cannabinoid content of several cannabidiol (CBD)-rich hemp tea samples was determined and was found to often deviate from the content stated on the packaging. Just like the cannabis flower, hemp tea can be analyzed easily and effectively for its cannabinoid content using high performance liquid chromatography (HPLC). The HPLC–UV assay of choice provided good linearity, low limits of detection (LODs), and high precision of retention time and peak area for the 11 cannabinoids under investigation.
Eskymaks/stock.adobe.com
Quantification of cannabinoids is essential for the accurate labelling of hemp products, both for quality control and for establishing legality with regards to d9-tetrahydrocannabinol (THC) content. For this article, the cannabinoid content of several cannabidiol (CBD)-rich hemp tea samples was determined and was found to often deviate from the content stated on the packaging. Just like the cannabis flower, hemp tea can be analyzed easily and effectively for its cannabinoid content using high performance liquid chromatography (HPLC). The HPLC–UV assay of choice provided good linearity, low limits of detection (LODs), and high precision of retention time and peak area for the 11 cannabinoids under investigation.
Cannabis contains more than 500 unique compounds, including over 80 chemical alkaloids known as cannabinoids. Numerous health benefits have been reported that are attributed to their pharmacological characteristics, allowing their use in medical treatment. They can affect physiological processes, such as inflammation, pain perception, and seizures, all important reasons for the growing interest in “medical cannabis” (1,2). While use of cannabis for medicinal purposes is still subject to much debate in Europe, hemp products containing less than 0.3% of the psychoactive compound d9-tetrahydrocannabinol (THC) have long been legal in most countries. With growing interest in the cannabis plant, the market for cannabidiol (CBD)-containing food and cosmetics products is also increasing.
The discussion about legalization of cannabis in Europe is widespread and lively, with a wide range of contrary positions. Spain and Portugal, for example, take a rather progressive approach not only on medicinal but also recreational use of cannbabis, while Italy’s highest court has just outlawed the sale of CBD products, which are legal in other European countries, stating it is a crime to market derivatives of cannabis. While the reasons for controversy are the psychoactive effects of only one of the cannabinoids, namely d9âtetrahydrocannabinol (THC), the use of other phytocannabinoids in combination shows promising results in chronic pain therapy. Efficacy in the treatment of multiple sclerosis, arthritis, and other inflammatory diseases has been indicated (1,2). Pain mitigation and reduced severity of nausea and seizures are just a few of the therapeutic benefits reported. In addition, a large number of studies showed high safety with regard to a wide array of side effects, and no tolerance to CBD has as yet been demonstrated (3). CBD-infused food, food supplements, beverages, and cosmetic products have therefore become increasingly popular.
There are clear definitions of the differences between marijuana, cannabis, and hemp (4). While “cannabis” is the name of the plant itself, marijuana, in its correct use, refers only to the leaves and flowering portions of the plant that contain a wide array of cannabinoids, including > 0.3% of the psychoactive compound THC. On the other hand, hemp describes the sterilized seeds, stems, stalks, and roots of cannabis plants with <0.3% THC. Any product manufactured from these seeds and roots could therefore exhibit therapeutic benefits without the mind-altering “high” produced by THC (5).
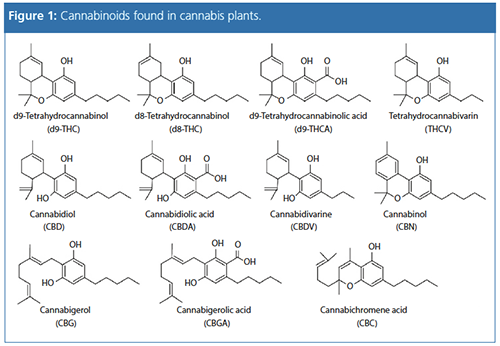
This article describes the application of a fast and simple high performance liquid chromatography (HPLC)–UV method for the separation and quantification
of 11 important cannabinoids (Figure 1) in a variety of CBD-rich hemp tea samples, for quality control relating to the label claim of cannabinoid, as well as THC, content.
Experimental
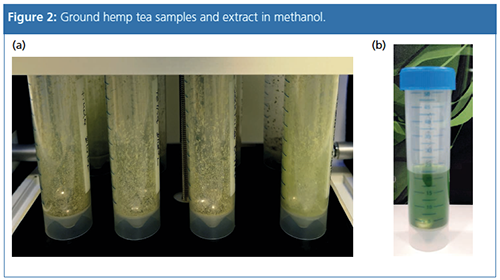
Sample Preparation: Approximately 200 mg of dry hemp tea samples were accurately weighed and placed in centrifuge tubes together with two steel balls. The leaves were homogenized using a 2010 Geno/Grinder from SPEX SamplePrep (Figure 2) at 1000 rpm for 1 min, followed by extraction of the cannabinoids into 20.0 mL of methanol. The samples were again shaken for 1 min at 1000 rpm, and the extract was centrifuged after a wait time of 15 min. The supernatant was then diluted with methanol before filtration and analysis by HPLC.
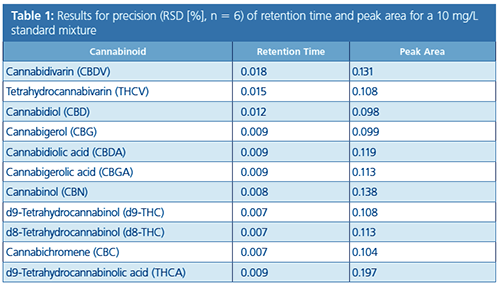
HPLC–UV Analysis: A high-resolution HPLC method using the Shimadzu “Cannabis Analyzer for Potency” instrument was used to create calibration curves in a concentration range from 0.5 to 50 mg/L that demonstrated good linearity (R2 > 0.9999) for each compound of interest. The relative standard deviation (RSD %) for retention time and peak area from six consecutive analyses was ≤ 0.018% and 0.197%, respectively (Table 1). Furthermore, resolution (R), calculated according to the European Pharmacopoeia, for psychoactive cannabinoids d9-THC and d8-THC was obtained with R = 2.6 (6).
Results
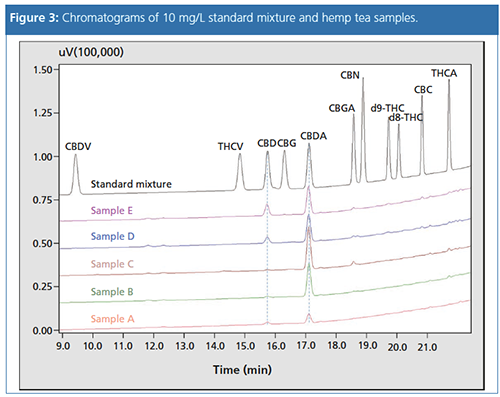
Sample Analysis: Five different hemp tea samples were analyzed for CBD and cannabidiolic acid (CBDA) content. Figure 3 shows an overlay of chromatograms for samples and a standard mixture with 10 mg/L for each compound. The CBD concentration in all samples was low or under the limit of detection (LOD) (sample C) compared to CBDA.
The total CBD content was calculated taking into account decarboxylation of the acid using the decarboxylation factor according to:
Total CBD [wt. %] = [% CBD] + 0.877 × [% CBDA] [1]
Furthermore, a small amount of cannabigerolic acid (CBGA) (< 0.08%) was determined in bud samples C, D, and E. Psychoactive d9-THC could not be detected in any of the samples.
Table 2 shows the results obtained in % w/w compared to cannabinoid content indicated on the packaging. Not all manufacturers make a label claim of cannabinoid content.

Conclusion
The method presented for determination of cannabinoids was suitable for the analysis of hemp tea from leaves and buds. The total content of CBD found in the dry tea samples was in the range of 0.47–1.67%, with % CBDA significantly higher than CBD. The results showed a discrepancy between determined content and label claim. However, the label-stated cannabinoid content relates to brewed tea and not dry sample. In a follow-up experiment, cannabinoid content will be determined in tea brewed according to label instruction (1.5 g in 200 mL hot water).
Sample D, found to contain less CBDA and CBD than stated on the packaging using the sample extraction described above, can be expected to have even less cannabinoid content in a brewed tea preparation, perhaps calling into question the type and accuracy of testing used to justify label claims.
All samples contained less than 0.3% d9âTHC, as expected from hemp products. This study showed that the method presented offers a simple and fast assay for CBD and total cannabinoid content for improved quality control of hemp products.
References
- P.G. Fine and M.J. Rosenfeld, Rambam Maimonides Medical Journal 4(4), e0022 (2013).
- T.W. Klein and C.A. Newton, Adv. Exp. Med. Biol. 601, 395–413 (2007).
- K. Ifï¬and and F. Grotenhermen, Cannabis and Cannabinoid Res. 2(1), 139–154 (2017).
- CBDweb: https://www.cbdweb.org/medical-cannabis-guide/hemp-vs-marijuana-vs-cannabis
- J. Johnson, Medical News Today, Newsletter Dec 2017: https://www.medicalnewstoday.com/articles/317221.php
- General Chapter <2.2.46> in European Pharmacopoeia (Strasbourg Cedex, France).
Gesa Johanna Schad graduated with a diploma in chemical engineering from the Technical University NTA in Isny, Germany, in 2004 and an M.Sc. in pharmaceutical analysis from the University of Strathclyde in Glasgow, UK, in 2005. Until 2006 she worked as a consultant in HPLC method development and validation in an analytical laboratory of the FAO/IAEA in Vienna, Austria. She gained her doctorate for research in pharmaceutical sciences at the University of Strathclyde in 2010 and was employed as an HPLC specialist in the R&D department at Hichrom Ltd. in Reading, UK, from 2009. Since 2013, she has worked as a HPLC product specialist and since 2015 as HPLC Product Manager in the analytical business unit of Shimadzu Europa in Duisburg, Germany.
E-mail:info@shimadzu.euWebsite:www.shimadzu.eu

.png&w=3840&q=75)

.png&w=3840&q=75)


.png&w=3840&q=75)


.png&w=3840&q=75)


