Determination of α-Amanitin in Human Serum by Solid-Phase Extracton Coupled with HPLC-UV
LCGC North America
A method is presented for the determination of ?-amanitin, a toxic cyclic octapeptide of amanitin mushrooms, in human serum by solid-phase extraction coupled with high performance liquid chromatography with UV detection.
The purpose of this study is to develop a fast and sensitive method for the determination of α-amanitin, toxic peptides of amanitin mushrooms, in human serum by solid-phase extraction (SPE) coupled with high performance liquid chromatography with UV detection.
The genus Amanita includes several lethal fungi. More than 90% of the lethal cases of mushroom toxin poisoning in humans are caused by Amanita (1). Based on their different structures and properties, the main toxic substances of Amanita are cyclopeptides that are classified into three toxicological compounds: amatoxins, phallotoxins, and virtoxins. Although there are three groups of cyclopeptides, only the amatoxins have been associated with severe poisoning and death. All amatoxins are bicyclic octapeptides differing only in the number of hydroxyl groups and in the presence or absence of an amine group on an aspartic acid residue. There are nine known amatoxins, with α-amanitin making up approximately 40% of the total amanitin content in most amanitin-containing mushrooms (2). α-Amanitin is a cyclic octapeptide in which the indole ring of a tryptophan residue is bound with a cysteine residue present in the sequence. The chemical structure of α-amanitin is shown in Figure 1.
Highly specific detection of amanitins in body fluids is necessary for an early diagnosis of intoxication that entails a large scale of invasive and expansive therapy (3). Although there are several methods that can be used to determine amanitins in biological samples, each method has its own drawbacks. Radioimmunoassay (RIA) is the main analytical approach for an objective diagnosis. The immunoaffinity extraction (IAE) column used for this method requires the generation and purification of antibodies, a process that is beyond the capabilities of most diagnostic laboratories. A commercially available RIA is possible for determination of amanitins in body fluids, but the tracer is only stable for two months or less. Because the assay is only available during the mushroom season, ingestion of Amanita mushrooms that were stored by deep freezing cannot be monitored throughout the year (4). Another enzyme-linked immunosorbent assay (ELISA) (5) test was reported for β-amanitin in urine, but it has not been made commercially available. The capillary zone electrophoresis (CZE) method seems to be simple and applicable to the analysis of α- and β-amanitin in urine (6,7). It should be confirmed that this method is applicable to the analysis of α-amanitin in more complicated matrix. Moreover, the CZE method in general has reproducibility problems. This is perhaps its biggest drawback for routine quantitative analysis. Gas chromatography–mass spectrometry (GC–MS) is the gold standard in analytical toxicology (4), but nonvolatile toxicants such as the amatoxin peptides cannot be detected by GC–MS (3). Defendenti and colleagues (8) used high performance liquid chromatography (HPLC) with electrochemical (EC) detection for the determination of α-amanitin in urine after a simple solid-phase extraction (SPE). However, the disadvantage in all HPLC–EC methods is the lack of long-term stability of detection. HPLC–MS procedures for detection of α-amanitin in biosamples are simple to operate, sensitive, accurate, and specific (2,3). Despite this, Maurer (3,4) has stated that during validation of the method, problems arose due to urine matrix compounds coeluted with the analytes, thereby disturbing the detection of α-amanitin by hampering their ionization in the electrospray chamber. Furthermore, HPLC–MS instruments are very expensive and are not available in many laboratories, particularly in under-developed countries.
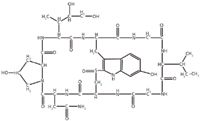
Figure 1: Structure of α-amanitin.
SPE is a well-established extraction technique for different types of samples (9–12). It is widely applied because many different types of sorbents can be used to extract a broad range of analytes. C8/silica-based strong cation exchange SPE cartridges contain a mixed-mode bonded silica support containing hydrophobic chains (octylsilane, n-C8) and strong cation exchange moieties (benzenesulfonylpropysilane). This stationary phase has the ability to retain acidic, neutral, basic, and amphoteric drugs in one cartridge (13). Through the use of sorbents that combine two properties in a single material (11,12), the matrix components (or interferences) and analytes can be eluted separately during the rinsing and the elution steps, respectively, by carefully choosing the pH and solvent in each SPE step.
Polymeric strong cation exchange resin is a sulfonic acid–modified divinyl benzene polymer with both ion exchange and reversed-phase retention properties. The sorbent's chemical structure is shown in Figure 2a. In contrast to the traditional silica-based strong cation exchange sorbent (Figure 2b), the resin is resistant to a wide variety of solvents and is stable in pH ranging from 0 to 14. However, C8/silica-based strong cation exchange SPE cartridges are prevalent (8,13–15), whereas polymeric strong cation exchange SPE cartridges are rarely used.
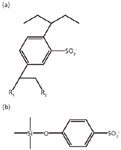
Figure 2: Structures of (a) the polymeric strong cation exchange sorbent and (b) a traditional silica-based strong cation exchange sorbent.
In the current study, a fast and sensitive method was developed for determination of α-amanitin in human serum by SPE coupled with HPLC–UV analysis. The method does not need dedicated instrumentation and is available in most laboratories. To our knowledge, this is the first reported method using a polymeric strong cation exchange SPE cartridge to extract α-amanitin from human serum.
Experimental
Chemicals and Reagents
Standards of α-amanitin (minimum 90% purity) were purchased from Sigma (St. Louis, Missouri). Ultrapure water was obtained from a LD-50G-D system (Chongqing, China). Methanol, acetonitrile, and methylene chloride were HPLC grade. Glacial acetic acid, formic acid, ammonium acetate, and monobasic phosphate (minimum 98% pure) were analytical grade. Human serum samples in this study were collected from volunteers in Guangzhou No.12 People's Hospital (Guangzhou, Guangdong, China).
Instrumentation and Chromatographic Conditions
An Agilent Technologies (Santa Clara, California) model 1100 binary HPLC system with UV detection was used for all reported analyses. The UV detector was operated at a wavelength of 302 nm. The analytical column was a 150 mm × 4.6 mm, 5-µm dp Diamonsil C18(2) column (Dikma Technologies, Lake Forest, California). The mobile phase consisted of 0.01 M ammonium acetate in 0.1% (v/v) aqueous formic acid and 0.01 M ammonium acetate in 0.1% (v/v) methanolic formic acid (70:30, v/v). The column oven temperature was set at 30 °C and the mobile phase was filtered, degassed, and pumped at a flow rate of 1.0 mL/min. The injection volume was 20 µL.
Extraction Using Polymeric Strong Cation Exchange SPE Cartridges
The serum sample extraction and cleanup methods were modified from previously reported procedures (2,8). A 0.5-mL aliquot of serum was combined with 1 mL of 1% (v/v) acetic acid–acetonitrile and sonicated for approximately 2 min. The sample was centrifuged for 10 min at 3000 rpm, and the supernatant was decanted into a 10-mL disposable test tube. After adding 5 mL of methylene chloride, the tubes were inverted several times and centrifuged for 5 min at 3000 rpm. Another 0.5 mL of 0.2 M acetic acid was added to the aqueous (top) layer, and this layer was transferred to a 5-mL tube.
Agilent's mixed-mode SampliQ SCX cartridges (30 mg, 1 mL), with a polymeric strong cation exchange resin sorbent, were conditioned with 3 mL of methanol and 3 mL of water. The aqueous extract was then applied to the cartridge. The cartridge was rinsed with 1 mL of 0.2 M acetic acid and 3 mL of methylene chloride. Upon completion, the cartridge was dried by a vacuum pump. Then the analytes were eluted with 3 mL of methanol under gravity. The eluent was evaporated to dryness under nitrogen. The extract was redissolved in 0.10 mL of water and filtered through a 0.45-µm syringe filter into the HPLC column. All control and fortified samples were prepared in the same manner.
Extraction Using C18/Polymeric Strong Cation Exchange SPE Cartridges
The serum sample extraction and cleanup methods were modified from previously reported procedures (2). A 0.5-mL aliquot of serum was combined with 1 mL acetonitrile and sonicated for approximately 2 min. The sample was centrifuged for 10 min at 3000 rpm and the supernatant was decanted into a 10-mL disposable test tube. A 5-mL volume of methylene chloride was added, and the tubes were inverted several times and then centrifuged for 5 min at 3000 rpm. Then, 0.5 mL of water was carefully added to the aqueous (top) layer and this layer was transferred to a 5-mL tube.
C18/polymeric strong cation exchange SPE cartridges (130 mg, 1 mL) were prepared in our laboratory by packing the mixed sorbent of Supelclean LC-18 cartridges and SampliQ strong cation exchange cartridges (10:3, w/w). These were conditioned by sequential rinsing with 3 mL of methanol, 3 mL of water, and 3 mL of 0.1 M phosphate buffer (pH 6). The aqueous extract was then applied to a cartridge. The cartridge was rinsed sequentially with 2 mL of water, 2 mL of 0.2 M acetic acid, and 3 mL of methylene chloride. After the rinsing steps were completed, the cartridge was dried by a vacuum pump. The analytes were subsequently eluted with 3 mL of methanol under gravity. The eluent was evaporated to dryness under nitrogen. The extract was redissolved in 0.10 mL of water and filtered through a 0.45-µm syringe filter into the HPLC column. All control and fortified samples were prepared in the same manner.
Preparation of Calibration Standards and Fortified Samples
Stock solutions of 100 µg/mL were diluted in methanol and stored at -20 °C, protected from light. Working solutions were prepared by diluting with water to 50, 100, 250, 500, 1000, 2500, and 5000 ng/mL. The dried extract of blank serum sample (0.5 mL), prepared as per the SPE method described above, was fortified with 0.10-mL aliquots of the working solution, vortexed, evaporated to dryness under nitrogen, and then redissolved in 0.10 mL of water. Calibrants were prepared at levels of 10, 20, 50, 100, 200, 500, and 1000 ng/mL.
All fortified samples were prepared by adding an appropriate level of stand solution in water to the blank serum samples and allowing it to equilibrate for at least 20 min before extraction. The recovery was determined by using serum samples (n = 6) fortified with α-amanitin at levels of 20, 50, 100, 200, and 500 ng/mL. The accuracy was determined by using fortified serum samples (n = 6) with different amounts of α-amanitin (20, 40, 80, 160, and 320 ng/mL) and comparing theoretical with measured concentrations. The precision was determined by serial analyses of serum samples (n = 10) fortified at 20, 50, and 100 ng/mL.
Results and Discussion
Optimization of the SPE Procedure and Retention Mechanism
Though the based materials of their sorbents are different, the polymeric strong cation exchange SPE cartridges, C8/silica-based strong cation exchange SPE cartridges, and C18/silica-based strong cation exchange SPE cartridges are all disposable with dual mechanisms (reversed phase and ion exchange). So, initially, we tried the SPE procedure described by Filigenzi (2) and Defendenti (8) for polymeric strong cation exchange SPE cartridges. However, the mean recovery of α-amanitin was only 63.2% and we found that the loss occurred mainly in the rinsing step with water. Reversed-phase SPE is considered the least selective retention mechanism when compared to normal-phase or ion-exchange SPE. In other words, it may be difficult for a reversed-phase method to differentiate between molecules that are structurally similar. However, because reversed-phase SPE will retain most molecules with any hydrophobic character, it is very useful for extracting analytes that are very diverse in structure within the same sample. The hydrophobic interaction between a polymeric skeleton and α-amanitin was not strong enough to retain α-amanitin. This means that the hydrophobic interaction with a styrene–divinylbenzene polymeric skeleton is weaker than with C8 or C18.
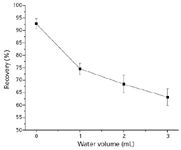
Figure 3: Recovery of α-amanitin with different water volumes in the rinsing step of the SPE (polymeric strong cation exchange) procedure.
To overcome this problem and improve the recovery of α-amanitin, we applied two approaches. One approach was to optimize the SPE procedure using polymeric strong cation exchange cartridges by changing the water volume (Figure 3) and the concentration of acetic acid (Figure 4) in the rinsing step. Then rinsing with water was stopped and the optimized concentration of acetic acid was 0.2 M. For electrostatic retention to occur both the analyte and sorbent functional groups must be in their ionized form. This is done through strict pH control of the sample matrix. Modifying wash solvents by adjusting the pH to match the pKa of the retained compound was likely to enhance the ionic interaction. The other approach was the addition of C18 sorbent to enhance the hydrophobic interaction. The C18/polymeric strong cation exchange cartridges were prepared by packing the mixed sorbent of C18 SPE cartridges and polymeric strong cation exchange SPE cartridges.
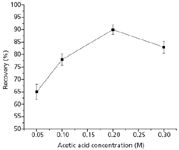
Figure 4: Recovery of α-amanitin with different concentrations of acetic acid in the rinsing step of the SPE (polymeric strong cation exchange) procedure.
Results Obtained Using the Polymeric Strong Cation Exchange SPE–HPLC–UV Method
The limits of detection (LOD, signal-to-noise ratio = 3) and the limits of quantification (LOQ, signal-to-noise ratio = 10) were 6.0 ng/mL and 20 ng/mL, respectively. The linearity was described by the equation y = 0.0851x + 0.194, where x was the concentration of α-amanitin in serum (ng/mL) and y was the peak area. The correlation coefficient (r) of 0.9995 shows good linearity. The recovery was determined by using serum samples (n = 6) fortified with α-amanitin at levels of 20, 50, 100, 200, and 500 ng/mL (Table I). Recovery of this method ranged from 90.0 to 94.1%. The mean recovery was 92.7%. The mean coefficient of variation (CV) was 2.4%. The accuracy was determined by using fortified serum samples (n = 6) with different amounts of α-amanitin (20, 40, 80, 160, and 320 ng/mL) and comparing the theoretical with measured concentrations (Table II). Precision was determined by serial analyses (n = 10) of serum samples fortified at 20, 50, and 100 ng/mL (Figure 5). The CVs were 3.9%, 2.1%, and 2.3%, respectively. The results indicate sufficient accuracy and precision for clinical diagnosis.
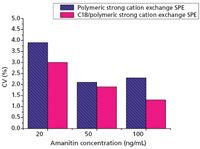
Figure 5: Precision of α-amanitin assay obtained using the SPEâHPLCâUV method. Concentrations of α-amanitin in the control serum samples (n = 10) were 20, 50, and 100 ng/mL.
The C18/Polymeric Strong Cation Exchange SPE–HPLC–UV Method
The LOD and LOQ using C18/polymeric strong cation exchange cartridges were 3.0 ng/mL and 10 ng/mL, respectively. The linearity was described by the equation y = 0.0845x + 0.102, where x was the concentration of α-amanitin in serum (ng/mL) and y was the peak area. The correlation coefficient (r) of 0.9996 shows good linearity. The recovery was determined by using serum samples (n = 6) fortified with α-amanitin at levels of 20, 50, 100, 200, and 500 ng/mL (Table I). Recovery of this method ranged from 83.0 to 86.4%. The mean recovery was 85.0%. The mean CV was 1.6%. The accuracy was determined by using fortified serum samples (n = 6) with different amounts of α-amanitin (20, 40, 80, 160, and 320 ng/mL) and comparing the theoretical concentrations with measured concentrations (Table II). Precision was determined by serial analyses (n = 10) of serum samples fortified at 20, 50, and 100 ng/mL (Figure 5). The CVs were 3.0%, 1.9%, and 1.3%, respectively. The results indicate sufficient accuracy and precision for clinical diagnosis.

Table I: Analytical recovery of the α-amanitin assay (n = 6) using SPEâHPLCâUV

Table II: Accuracy of the α-amanitin assay (n = 6) using SPEâHPLCâUV
Comparison
A comparison between the two extraction methods demonstrated that the method using C18/polymeric strong cation exchange SPE cartridges had better purification from interfering compounds and lower noise than the method using polymeric strong cation exchange SPE cartridges (Figure 6), but had more loss. As a result, the LODs obtained using polymeric strong cation exchange SPE cartridges and using C18/polymeric strong cation exchange SPE cartridges were 6.0 ng/mL and 3.0 ng/mL, respectively. The mean recoveries of these two methods were 92.7% and 85.0%, respectively.
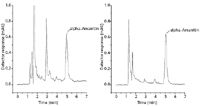
Figure 6: Chromatograms obtained from an extract of human blank serum fortified with 100-ng/mL α-amanitin using a polymeric strong cation exchange cartridge (left) and a C18/polymeric strong cation exchange cartridge (right).
A comparison between the developed methods and those that have been reported over the last 15 years is represented in Table III. The LODs of the developed methods are higher than Abuknesha's ELISA method (5) and Filigenzi's LC–MS method (2). The ELISA method needs special reagents and has not been made commercially available. HPLC–MS instrumentation is very expensive and is not available in many laboratories. The developed methods appear to be useful, although the analyte set is limited.
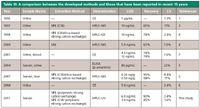
Table III: A comparison between the developed methods and those that have been reported in recent 15 years
Conclusions
Two SPE methods, based on the use of polymeric strong cation exchange SPE cartridge or C18/polymeric strong cation exchange SPE cartridge coupled to HPLC with UV detection, were developed for rapid serum analysis of α-amanitin. Both methods proved to be specific, accurate, and precise across the calibration ranges of 20–500 ng/mL and 10–500 ng/mL. Good linearity was also observed. Mean recoveries of these two methods were 92.7% and 85.0%, respectively. LODs were 6.0 ng/mL and 3.0 ng/mL, respectively, which are suitable for clinical diagnosis. These methods are simple and do not need dedicated instrumentation. The reagents and conditions used are available in most laboratories.
Acknowledgments
This work was supported by the Program Foundation of Science of Guangdong Province (No: 2010B031600271) and the National Natural Science Foundation of China (No. 20875034).
Zhi Zhou, Xiongjun Zuo, and Youwen Tang are with the School of Chemistry and Environment, South China Normal University, Guangzhou, P. R. China. Direct correspondence to: tanglab@scnu.edu.cn.
Min Cao and Liping Zhou are with Guangzhou No.12 People's Hospital, P. R. China.
References
(1) O. Brüggemann, M. Meder, and R. Freitag, J. Chromatogr. A 744, 167–176 (1996).
(2) M.S. Filigenzi, R.H. Poppenga, A.K. Tiwary, and B. Puschner, J. Agri. Food Chem. 55, 2784–2790 (2007).
(3) H.H. Maurer, T. Kraemer, O. Ledvinka, C.J. Schmitt, and A.A. Weber, J. Chromatogr. B 689, 81–89 (1997).
(4) H.H. Maurer, C.J. Schmitt, A.A. Weber, and T. Kraemer, J. Chromatogr. B 748, 125–135 (2000).
(5) R.A. Abuknesha and A. Maragkou, Anal. Bioanal. Chem. 379, 853–860 (2004).
(6) V.A. Robinson-Fuentes, J.L. Jaime-Sanchez, L. Garcia-Aguilar, M. Gomez-Peralta, M.S. Vazquez-Garciduenas, and G. Vazquez-Marrufo, J. Pharmaceut. Biomedi. 47, 913–917 (2008).
(7) Y. Bidnychenko, LCGC 19(9), 1000–1002 (2001).
(8) C. Defendenti, E. Bonacina, M. Mauroni, and L. Gelosa, Forensic Sci. Int. 92, 59–68 (1998).
(9) C. Molins-Legua and P. Campins-Falco, Anal. Chim. Acta 546, 206–220 (2005).
(10) J. Rosen, A. Nyman, and K. Hellenas, J. Chromatogr. A 1172, 19–24 (2007).
(11) N. Fontanals, P.A.G. Cormack, D.C. Sherrington, R.M. Marce, and F. Borrull, J. Chromatogr. A 1217, 2855–2861 (2010).
(12) F. Bucelli, A. Fratini, P. Bavazzano, and N. Comodo, J. Chromatogr. B 877, 3931–3936 (2009).
(13) C. Sanchez de la Torre, M.A. Martinez, and E. Almarza, Forensic Sci. Int. 155, 193–204 (2005).
(14) L. Cullere, M. Bueno, J. Cacho, and V. Ferreira, J. Chromatogr. A 1217, 1557–1566 (2010).
(15) H. Teixeira, A. Verstrate, P. Proenca, F. Corte-Real, P. Monsanto, and D.N. Viera, Forensic Sci. Int. 170, 148–155 (2007).

New Study Reviews Chromatography Methods for Flavonoid Analysis
April 21st 2025Flavonoids are widely used metabolites that carry out various functions in different industries, such as food and cosmetics. Detecting, separating, and quantifying them in fruit species can be a complicated process.
Extracting Estrogenic Hormones Using Rotating Disk and Modified Clays
April 14th 2025University of Caldas and University of Chile researchers extracted estrogenic hormones from wastewater samples using rotating disk sorption extraction. After extraction, the concentrated analytes were measured using liquid chromatography coupled with photodiode array detection (HPLC-PDA).

.png&w=3840&q=75)

.png&w=3840&q=75)


.png&w=3840&q=75)


.png&w=3840&q=75)


