The Effect of SEC Column Arrangement of Different Pore Sizes on Resolution and Molecular Weight Measurements
LCGC North America
The results of a study to determine the influence of SEC column order on molecular size separation and peak broadening
In the practice of size-exclusion chromatography (SEC), the suggested arrangement of columns with different pore sizes appears to be contradictory. Although most column manufacturers recommend that the large-pore-size column be placed first in a set, for example connected to the injector, followed by columns with progressively larger pores, other workers in the field suggest the reverse. In view of these conflicting practices, a study was conducted to determine the influence of column arrangement on molecular size separation and peak broadening using a high-precision SEC chromatographic system and a two-column set with exclusion molecular weight limits of 2 × 10³ and 2 × 10⁶ g/mol. As would be expected, SEC column order was found to have no effect on peak resolution, column efficiency, calibration curve fit, or measured molecular weights on a series of polystyrene standards and poly(tetramethylene ether glycol) samples. These results suggest that any column order can be employed provided that the direction of flow through each column established by manufacturer is used and that the minimum length of low-dead-volume capillary tubing is used for column coupling.
Although size-exclusion chromatography (SEC) is a well-established technique used by most laboratories involved with macromolecule characterization, there is still disagreement about which pore-size column to place first when using a series of SEC columns with different pore sizes. For example, Striegel and colleagues (1) recommend that the smallest-pore-size column should be placed first in a bank of SEC columns, while Mori and Barth (2), as well as most column manufacturers, propose installing columns in order of decreasing pore size. Nevertheless, because any multicolumn or multidimensional separation process, in general, is strictly reversible, the arrangement of individual SEC columns containing packings with different pore sizes should make no difference regarding the final molecular weight (MW) separation.
However, there is an instance whereby SEC column order could influence final results: if a constant-pressure pump with noticeable flow-rate pulsations is used in conjunction with conventional SEC columns packed with soft or semirigid, large-particle-size packings. Because these types of columns help dampen flow-rate pulsations, the first column in a series will take the brunt of the pulsations. Because small-pore-size conventional packings are physically more stable than large-pore-size packings, columns of the former type need to be placed first, followed by the more fragile larger-pore-size packings; in this manner, particle compression or fracture of the latter packing is reduced.
Because of the inherently lower efficiency of conventional columns (for example >50 µm), significant sample dilution would occur when the injected sample reaches the larger-pore-size packing where most of the high-MW separation would occur (1). Consequently, somewhat higher polymer concentrations could be injected without seriously worsening "concentration effects" that would otherwise distort the MW distribution.
By coupling columns with packings of different pore sizes, a desired MW separation range and degree of resolution can be achieved. The downside of this approach is that often it is difficult to arrive at a linear calibration, which inherently has less error than a higher-order polynomial fit. To circumvent this difficulty, individual columns packed with a mixture of two or more different pore sizes (for example, mixed-bed columns) to give a linear-calibration curve are now readily available. Moreover, new packing technology has been introduced in which SEC packings consist of layers of different, tightly controlled pore sizes (3,4). With the use of high-performance mixed-bed and multipore packings, column order is no longer an issue. Nevertheless, the use of columns with individual pore sizes remains popular because of the flexibility they afford.
For this study, we employed an advanced SEC instrument well suited for determining polymer MW with high accuracy and precision (5), especially when used in conjunction with high-resolution SEC columns. Two columns were selected that had substantially different separation ranges and average pore sizes but similar column dimensions to give an overlapping "MW vs. elution volume" calibration curve. Parameters measured and compared for the two column-set arrangements were elution times, peak asymmetry, peak efficiency, resolution, calibration curve polynomial coefficients, and MW measurements and polydispersities. Test polymers were nearly monodisperse polystyrene standards and low-MW poly(tetramethylene ether glycol)s.
Experimental
SEC instrumentation consisted of an EcoSEC GPC system (5,6) (Tosoh Bioscience LLC, King of Prussia, Pennsylvania) equipped with an autosampler, a variable-wavelength UV detector set at 254 nm, and a differential refractive index (RI) detector. Of special interest were the two low-stroke-volume pumps of the Eco SEC GPC unit, in which one pump was for the analytical SEC column and the second pump delivered constant flow through a reference column and then through the reference cell (2.5-µL cell volume) of the temperature controlled RI detector. The column was placed in a double-nested temperature-controlled oven. Strict temperature control of all these elements ensured low baseline noise and drift of the RI signal. Because the pump heads and solvent-delivery lines were temperature controlled, the flow rate was highly reproducible and stable, a requirement for high-quality MW measurements. Furthermore, the overall dead volume of the autosampler, detectors, and coupling tubing was quite low, minimizing extracolumn peak broadening. Data were processed with EcoSEC-WS software (Tosoh Bioscience LLC).
The two-column set used for this study consisted of a TSKgel SuperMultiporeHZ-M column and a TSKgel SuperHZ1000 column. The dimensions of each column were 15 cm × 4.6 mm. The small-pore-size packing, TSKgel SuperHZ1000 column, contained particles with a mean pore size of 15 Å (3-µm dp), while the large-pore-size TSKgel SuperMultiporeHZ-M column contained particles with a mean pore-size of about 140 Å (4-µm dp). The TSKgel SuperMultiporeHZ-M column exhibited a linear MW range that extended from about 400 to 4,000,000, and the TSKgel SuperHZ1000 column had a separation range of about 200 to 1000.
Polymer reference samples were PStQuick MP-M polystyrene standards varying in MW from 266 to 706,000 (Tosoh Bioscience LLC) and Terathane poly(tetramethylene ether glycol) samples T-1000, T-1400, T-2000, and T-2900 (Aldrich Chemical, St. Louis, Missouri) with nominal MWs of 1000, 1400, 2000, and 2900, respectively.
The mobile phase was tetrahydrofuran containing 250 ppm BHT. The flow rate was 0.20 mL/min. The temperature (pump, oven, detector) was 40 °C. The injection volume was 10 µL, and the polymer concentration was 1 mg/mL. Injections were made in triplicate.
Results and Discussion
The objectives of this study were to determine and compare calibration curve coefficients, resolution between select pairs of peaks, and column efficiency of polystyrene standards and average MW and polydispersity values of Terathane poly(tetramethylene ether glycol) samples using two columns in a series when operating these columns in "normal" and "reverse" order. For the purpose of this study, the normal order was arbitrarily defined as the one in which the largest-pore-size column is connected to the injector, followed by the smallest-pore-size column, which is connected to the detector. To ensure no disruption of the packed-bed structure, the columns were coupled together so that the same direction of flow through each column, as prescribed by the manufacturer, was maintained.

Table I: Effect of column order on elution times and log MW vs. elution time calibration curve coefficients of polystyrene standards using UV detection at 254 nm. The column order is listed above each table. In all cases, column 1 is attached to the injector and column 2 is connected to the detector. See Experimental section for chromatographic conditions.
Tables Ia and Ib show the elution times of six polystyrene standards using UV detection (254 nm) and the coefficients for a cubic fit of the log MW vs. elution time calibration curves for the two column arrangements. As indicated, there was no significant difference between the retention times and polynomial equation coefficients of the normal and reverse column orders. Please note that each separate column would have given a linear or quadratic polynomial calibration fit; however, because pore volumes of the two columns are not exactly the same and the separation ranges overlap, the resulting calibration curve is best described by a cubic fit.

Table II: Effect of column order on column efficiency, peak symmetry, and resolution of polystyrene standards as measured with UV detection at 254 nm. The column order is listed above each table. In all cases, column 1 is attached to the injector and column 2 is connected to the detector. See Table I for chromatographic conditions.
Column efficiencies as determined with the three highest MW polystyrene peaks, which were well resolved, were essentially the same for both column arrangements, as shown in Table II. The theoretical plates for polystyrene were low, as would be expected for a macromolecule because of the higher resistance to mass transfer and slight polydispersity of these polystyrene standards. Peak symmetry data in Table II also were independent of column order. Peak symmetry values larger than one were indicative of peak tailing caused by chromatographic peak broadening or skewness as a result of slight polydispersity and deviation from a symmetrical or Gaussian molecular weight distribution. Finally, resolution data of these three peaks, listed in Table II, were almost identical for both column arrangements. These data confirm that SEC column order has no effect on peak broadening or on the molecular size separation process.
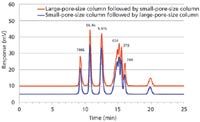
Figure 1: Overlay of UV chromatograms of PStQuick MP-M polystyrene standards obtained using coupled TSKgel SuperMultiporeHZ-M and TSKgel SuperHZ1000 (15 cm à 4.6 mm each) columns. The first column listed in the legend is attached to the injector and the second column is connected to the detector.
Visual proof that column order did not affect the MW profile is shown in Figure 1, which is an overlay with baseline offset of the series of six polystyrene standards present in the PStQuick MP-M polystyrene standard mixture using UV (254 nm) detection. Baseline widths of all peaks, as well as elution volumes, were perfectly superimposable. The last positive peak was not assigned a MW because its identity is not known. By including the 15-Å single-pore-size packing in this column set, the elution volume of the potentially interfering unknown low-MW component was increased and moved away from the oligomeric peak profile, as shown in Figure 1. A calibration curve for polystyrenes is shown in Figure 2. For clarity, only one column order is shown in Figure 2, because both calibration curves virtually superpose as indicated by the similar polynomial coefficients given in Tables Ia and Ib.
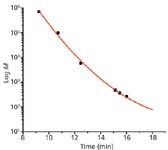
Figure 2: Calibration curve of polystyrene standards for TSKgel SuperHZ1000 and TSKgel SuperMultiporeHZ-M (15 cm à 4.6 mm each) coupled columns. The first listed column is attached to the injector and the second column is connected to the detector.
A series of commercially available, polydisperse Terathane poly(tetramethylene ether glycol) samples was used to determine the effect of column order on MW measurements. A log MW vs. elution volume calibration curve was constructed by assuming that each peak maximum found in the Terathane chromatograms corresponded to the nominal MW values given by the supplier. Table III shows that the measured MW and polydispersity values of the normal column arrangement (Table IIIa) were in excellent agreement to the reverse column arrangement (Table IIIb). Furthermore, the "recovered" Mw values obtained using the SEC calibration curve agreed closely with supplier's nominal values, as would be expected.
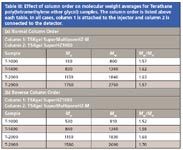
Table III: Effect of column order on molecular weight averages for Terathane poly(tetramethylene ether glycol) samples. The column order is listed above each table. In all cases, column 1 is attached to the injector and column 2 is connected to the detector.
Conclusions
Based on elution times, polynomial coefficients of the calibration curve, theoretical plates, peak asymmetry, and resolution obtained from a series of polystyrene standards and MW measurements of Terathane poly(tetramethylene ether glycol) samples, the arrangement of two SEC columns consisting of 15-Å single-pore-size particles and 140-Å average pore size of multipore particles has no effect on these measurements. By inference we can safely assume that any number of SEC columns containing packings with different pore sizes, irrespective of column dimensions or pore size, can be arranged in any order.
Bruce Kempf and Roy Eksteen are with Tosoh Bioscience in King of Prussia, Pennsylvania. Direct correspondence to Roy.Eksteen@tosoh.com.
Howard G. Barth is with Analytical Chemistry Consultants and can be reached at howardbarth@gmail.com.
References
(1) A.M. Striegel, W.W. Yau, J.J. Kirkland, and D.D. Bly, Modern Size-Exclusion Liquid Chromatography (John Wiley, New York, New York, 2009).
(2) S. Mori and H.G. Barth, Size Exclusion Chromatography (Springer Verlag, Berlin, Germany, 1999).
(3) H.G. Barth, LCGC, LC Column Technology Supplement, 22(6), 43 (2004).
(4) H.G. Barth and G. Saunders, LCGC, LC Column Technology Supplement, 38 (April 2006).
(5) X. Villarreal and H.G. Barth, Amer. Lab. 41, 20 (2009).

Polysorbate Quantification and Degradation Analysis via LC and Charged Aerosol Detection
April 9th 2025Scientists from ThermoFisher Scientific published a review article in the Journal of Chromatography A that provided an overview of HPLC analysis using charged aerosol detection can help with polysorbate quantification.
Analyzing Vitamin K1 Levels in Vegetables Eaten by Warfarin Patients Using HPLC UV–vis
April 9th 2025Research conducted by the Universitas Padjadjaran (Sumedang, Indonesia) focused on the measurement of vitamin K1 in various vegetables (specifically lettuce, cabbage, napa cabbage, and spinach) that were ingested by patients using warfarin. High performance liquid chromatography (HPLC) equipped with an ultraviolet detector set at 245 nm was used as the analytical technique.
Removing Double-Stranded RNA Impurities Using Chromatography
April 8th 2025Researchers from Agency for Science, Technology and Research in Singapore recently published a review article exploring how chromatography can be used to remove double-stranded RNA impurities during mRNA therapeutics production.


