Current Applications of UHPLC in Biotechnology Part II: Proteins and Glycans
LCGC North America
A discussion of how UHPLC is used to conduct intact protein–antibody analysis and glycoprofiling to characterize biopharmaceutical drugs
As mentioned in part I of this series, there are four major applications areas of ultrahigh-pressure liquid chromatography (UHPLC) for biotechnology: peptide mapping, amino acid analysis (AAA), intact protein and antibody analysis, and glycan analysis or glycoprofiling. The first two of these areas were extensively covered in Part I. This installment will emphasize intact protein–antibody analysis and glycan analysis or glycoprofiling and why they are used.
In part I of this two-part series on the current usage of ultrahigh-pressure liquid chromatography (UHPLC) in biotechnology, we introduced the fundamentals of performing UHPLC and discussed specific applications for peptide mapping and amino acid analysis (AAA) (1). Readers are encouraged to read part I before part II. There are four major applications areas where UHPLC has become important for biotechnology: peptide mapping, amino acid analysis, intact protein characterization, and glycan analysis or glycoprofiling. These applications are essential analytical challenges in biopharmaceutical development, in which UHPLC has proven valuable (2–6). The first two topics were discussed in part I; here, we will focus on the latter two (6,7).
Using much smaller particle diameter packing materials, and shorter or narrower columns, has improved virtually all chromatography for larger proteins or antibodies, as well as for their smaller cousins. Such trends will, of course, continue into the future. When using UHPLC for biotechnology applications, perhaps the very first areas of emphasis have been intact proteins, especially mixtures of protein variants in a drug substance (DS), or antibody variants, isoforms, or glycoforms.
The structure of intact proteins presents a difficult analytical problem because the pharmacological activity of these large molecules is altered by small chemical changes to the protein. The modifications affect a tiny fraction of the chemical properties, so it is necessary to use multiple modes of separation to detect and measure them. The common approaches of reversed-phase chromatography, size-exclusion chromatography (SEC), and ion-exchange chromatography (IEC) are now available in UHPLC.
The reversed-phase high performance liquid chromatography (HPLC) of intact proteins, especially large molecules such as antibodies, is usually characterized by broad, diffuse, and poorly resolved peaks, with low plate counts and often large asymmetry values. These molecules are the "bad actors" of HPLC because their high molecular weights, slow mass transfer, and low diffusion coefficients lead to large peak volumes. Specific chemical interactions also degrade the analysis through mixed modes of separation (hydrophobic and hydrophilic patches and ionic binding), as well as poor solubility in most HPLC solvents. When UHPLC materials were being developed for proteins, it was efficient to consider both implementation of small particles with shorter diffusion distances and optimized particle chemistry for reduced chemical interactions. As illustrated in some of the figures in part I, this combination has facilitated using UHPLC for proteins or antibodies. For example, Figure 1 in this installment compares two different columns with the same base particle, bonded phase, and bonding chemistry, operated under identical conditions in two different particle sizes: 3.5 µm and 1.7 µm. It is a controlled comparison between conventional HPLC (3.5-µm particles) and UHPLC (1.7-µm particles). The relative retentions for all of the peaks are the same in the two chromatograms, but more resolution is apparent with the smaller particles. The sample consists of light chains (LC) and heavy chains (HC) of an antibody (immunoglobulin, or IgG) with the heavy chains having different degrees of glycosylation or modifications (post-translational modifications, or PTMs). In addition, the sample was reduced and intentionally alkylated only partially to further increase the sample heterogeneity as a test of chromatographic resolving power. The improved resolution with the UHPLC packing material and instrumentation is apparent. It also should be noted that the run time could be reduced by using different dimensions of the columns. Thus, the area of intact proteins remains one of the four most important applications of UHPLC in use today. It will surely remain so in the future.

Figure 1: UHPLC separation of light and heavy chains of a reduced and partially alkylated monoclonal antibody (IgG). (Reprinted with permission from reference 8.)
Intact protein profiling via UHPLC serves several functions in regulatory submittals. It provides a chromatographic profile of the number of variants present and their relative ratios (percent peak areas), and it helps to define lot-to-lot variations among different production batches. It is important that each peak in such a DS profile be uniform, homogeneous, and a single variant, if possible. Such intact protein profiling then defines a "typical" production batch, as well as batch-to-batch variations and their limitations. It also is a very important and reliable application for comparing biosimilars and proprietary drug substances.
The other major application area we will emphasize in this installment is glycan analysis or glycoprofiling. The sugars that are attached to proteins have profound effects on the biological properties of proteins, including binding specificity, stability, affinity, and potential immunogenicity. The analysis of oligosaccharides derived from glycoproteins or antibodies is, therefore, a fundamental required characterization test. The biosynthesis of pharmaceutical proteins yields a mixture of proteins with the same amino acid sequence, but with variable glycans attached. Because the vast majority of biotechnology-derived DSs today contain glycoforms as the variants, it has become de rigueur for any regulatory submittal to define the nature of glycans found in the preparation of glycoproteins. This characterization includes determining the distribution of all the glycans found in the sample, the proportions of each protein glycoform, and the location or position of attachment of the glycan to specific amino acids in the protein backbone. The proportion of the glycoforms is most often measured using intact-protein liquid chromatography–mass spectrometry (LC–MS), and points of attachment are characterized as part of peptide mapping, as discussed in part I of this column. Glycan analysis or glycoprofiling really refers to describing all the oligosaccharides or monosaccharides (if any) that are found on a total mixture of glycoproteins, as well as their relative or absolute amounts.
Each oligosaccharide must be structurally defined or sequenced, often versus authentic reference standards, and chromatograms must be provided in a submittal that shows the glycoprofile of the glycoproteins versus authentic reference standards of the glycans found. A glycan is an oligosaccharide, often composed of different monosaccharides and exhibiting extensive branching. These PTMs can be N-linked or O-linked, depending on the protein and on the cell system used for synthesis. A recombinant protein to be used as a biotherapeutic will always be a mixture of glycoforms reflecting the heterogeneity of the attached glycans. For analysis, the sugars are released by chemical or enzymatic methods. The released glycans are then qualitatively and quantitatively analyzed. There are numerous methods now available for glycoprofiling, but two have become more popular than others. The two popular, or common, techniques are high performance anion-exchange chromatography with pulsed amperometric detection (HPAEC–PAD) and hydrophilic liquid interaction chromatography (HILIC) with fluorescence detection of derivatized sugars. Often, these and other techniques are applied to initially derivatized glycans.
As with intact protein profiling, glycoprofiling serves several functions in regulatory submittals. It defines the nature of the glycan pool that is present, as another way to structurally define the mixture of glycoproteins or others. It helps to demonstrate chemical equivalency, lot-to-lot, for release testing, and it can be very useful when comparing biosimilars to innovator glycoprotein DSs or drug products (DPs). It also provides a demonstration that the drug production process is within certain tolerance limits of variabilities. If the glycoprofiling finds a certain mixture of glycans present, then these also must be found on one or more of the glycoproteins in the DS. It is often possible to define the exact amino acid sequence, as well as glycan and glycan locations on every variant in a glycoprotein DS. These must agree, batch-to-batch, or else something is amiss in the production process.
Intact Protein Analysis
As mentioned in part I and above, there are serious challenges for successful protein separations. In general, reversed-phase HPLC applications have been less than ideal, in terms of final peak shapes, efficiencies, resolutions, and peak capacities. Success requires the detection of small chemical differences, often between quite large molecules (molecular weight, size, and shape). Successful UHPLC now employs a variety of analytical techniques that are sensitive to different properties of the proteins (hydrophobic, hydrophilic, ion exchange, hydrogen bonding, and others). Currently, the most popular techniques are IEC for changes in net charges of the proteins (salt or pH gradients are popular); SEC for changes in size or aggregation; and reversed-phase chromatography for detecting a wide range of small changes in the proteins. Success in each of these modes depends on choosing the ideal packing material, particle size, pore size, length of ligand (C18 versus C4), mobile phase, gradients, flow rates, temperature, and other variables available in UHPLC. In developing reversed-phase UHPLC protein separations, it was not sufficient to just use sub-2-µm particles. It also was necessary to re-examine the properties of the base particle, the pore size, the bonded phase, and the bonding chemistry (9–11).
Figure 2 illustrates the chromatographic differences as a consequence of pore size in the packing material for the same mixture of proteins and mobile phase conditions (8). The larger pore size leads to improved peak shapes and narrower peaks, with minimal effect on selectivity. However, some proteins still do not give the sharp symmetrical peaks expected for UHPLC. For example, peak 3 in Figure 2 is bovine serum albumin (BSA), for which the separation includes several variants that are coeluted under this one, broadened peak. This is not a characteristic of the UHPLC conditions, but rather a reflection of the limitations of reversed-phase mechanisms to discriminate among small chemical changes on a very large molecule. However, larger pore sizes generally allow the proteins to diffuse more freely and rapidly in and out of the pores, where the majority of the interactions with the bonded phase occur. Differences in distribution coefficients and mass transfer of the proteins can thereby effect overall improved peak shapes and improved separations. It is really a matter of the proteins being able to approach equilibrium interaction with the surface ligands of the bonded phase. Unfortunately, it is not possible to suggest a molecular weight limit in which the separation must be done on 300-Å pore packings. The protein assumes a three-dimensional structure that is usually larger than the native protein (but different for every protein sequence) because of the disordering of the protein structure at low pH in relatively high concentrations of organic solvents.
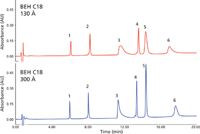
Figure 2: In reversed-phase UHPLC, there is an effect of pore size on resolution and peak shapes possible for a typical mixture of proteins, as indicated. Peaks: 1 = ribonuclease, 2 = cytochrome c, 3 = bovine serum albumin (BSA), 4 = β-lactoglobulin, 5 = enolase, 6 = phosphorylase b. (Reprinted with permission from reference 8.)
A similar set of experiments examined the effect of varying the bonded phase chain length (C18 versus C4), again in reversed-phase-UHPLC, on the peak shapes for a mixture of standard proteins (Figure 3) (8). In this particular illustration, all peak shapes, peak narrowness (asymmetry factor), peak heights, resolutions, and plate counts are improved by going to the smaller C4 chain length (all other particle and mobile-phase conditions were identical). With large proteins, their interactions with very hydrophobic ligands, such as C18, lead to slower mass transfer, stronger hydrophobic–hydrophobic interactions with the proteins, and thus peak tailing, loss of peak shape, and loss of efficiency, as well as overall decreased resolutions. With much smaller peptides, C18 is usually the stationary phase of choice, but for larger proteins, C4 or even C3 is preferred for all of the reasons stated earlier. It is important, however, to recognize that there is no obvious cutoff molecular weight whereby analysts should automatically choose the shorter chain bonded phase. As with pore size, this observation is related to the sequence-dependent disordering of protein structures.
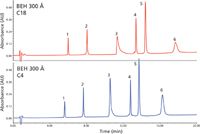
Figure 3: Effect of varying bonded phase chain length in reversed-phase UHPLC separation of a mixture of standard proteins, as indicated. Peaks: 1 = ribonuclease, 2 = cytochrome c, 3 = BSA, 4 = β-lactoglobulin, 5 = enolase, 6 = phosphorylase b. (Reprinted with permission from reference 8.)
An additional operational parameter to consider is that mass transfer is often improved at higher temperatures. The kinetics of equilibrium between the mobile and stationary phase are faster because of a reduced viscosity and resistance to flow, leading to improved mass transfer effects. Recoveries tend to be improved at elevated temperatures. For these reasons, it is often suggested that reversed-phase separations be performed at 70 °C. However, some proteins show worse peak shapes at the higher temperature. The chromatographic behavior of proteins at low pH and with organic solvents reflects a complicated interplay among mass transfer, solubility, and the equilibrium of disordered structures. Good practice seems to favor testing each sample at both low and high temperatures, perhaps 45 °C and 75 °C, to identify the range to be used for optimizing the final separations.
Several other operational parameters are of importance in the reversed-phase-UHPLC analysis of proteins. Acidic mobile phase modifiers (formic acid, trifluoroacetic acid, and others) are generally used and higher concentrations of these reagents lead to better peak shapes and resolutions. Trifluoroacetic acid is preferred for the best peak shape and resolution, and formic acid gives better sensitivity and spectral quality with MS detection.
The effects of flow rate and column length also can be useful and have the expected effects on resolution. In the case of column length, longer columns usually lead to improved or better resolution of proteins. Lower flow rates improve peak shapes and resolution because the large protein molecules diffuse slowly in and out of the pores. This effect has been underutilized in developing protein separations because the run times increase significantly. It has often been observed, however, that a shorter column at lower flow rates will outperform a longer column at scaled flow rates that give the same run time. Computerized method development software routines, usually commercially available today, can also be useful for systematically optimizing UHPLC conditions (9–11).
SEC has traditionally been a critical tool for the analysis of biopolymers. UHPLC columns for this separation mechanism are just now becoming available. Perhaps the earliest players in biopolymer separations were packings such as Sephadex or Sepharose, polysaccharides, that were used in open-column, low-pressure biopolymer separations on semipreparative and preparative scales. Analytical SEC became popular at least 40 years ago, with the introduction of HPLC columns with hydrophilic coatings or bonded phases on silica particles. More recently, packings have been introduced at the UHPLC scale that are able to withstand high back pressures, higher temperatures, and higher flow rates, and they can resolve proteins, aggregates, antibodies, and fragments in one analysis. Although SEC has traditionally been a low-resolution technique because of the size and slow mass transfer of these analytes (often with extensive band broadening), modern size-exclusion UHPLC gives substantially better resolution in shorter run times. Figure 4 illustrates a typical separation of four proteins, ranging in molecular weight from 17,000 to 669,000 Da, along with a completely included, low-molecular-weight analyte, uracil. The four proteins are all baseline resolved in under 5.50 min, which is considerably less than what has been possible with conventional size-exclusion HPLC, for the very same proteins. Peak shapes are excellent with very low asymmetry factors, high plate counts, and baseline resolution in under 5.50 min. This is truly excellent size-exclusion UHPLC, perhaps the very best ever demonstrated and far superior to conventional size-exclusion HPLC.
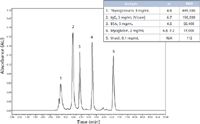
Figure 4: Size-exclusion chromatography of standard proteins in UHPLC. (Reprinted with permission from reference 8.)
SEC has become a very important technique in biotechnology, in part, because it is able to resolve high-molecular-weight aggregates of proteins and especially of antibodies (see Figure 5). Aggregates (also termed associates), in general, are noncovalent clusters of a monomer, which are usually formed in equilibrium with the monomer as a function of temperature, time, solvent conditions, and even pressure. Figure 5 illustrates the ability of modern size-exclusion UHPLC to resolve fully to the baseline all aggregates present, even at 1.12–1.22% composition versus the monomer. These are almost all baseline resolved. Aggregates can be dimers, trimers, and higher order species of the monomer, or mixed aggregates with various combinations of heavy and light chains (IgG) present. These are usually considered impurities of the DS, often being immunogenic. Regulatory agencies want to know how many and how much of these aggregates are present in the final DP and if they are immunogenic in humans. They also can ask to have such aggregates removed before the DP can go to market (12).
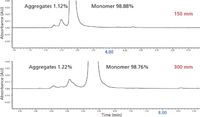
Figure 5: Size-exclusion UHPLC of antibody aggregates, as a function of column length. (Reprinted with permission from reference 8.)
For characterization of the peaks observed in SEC, both multiple angle light scattering (MALS) and MS, readily interfaced with UHPLC, can provide molecular weight information (15). When considering the use of information-rich detectors with SEC, it is important to remember that the technique measures the size and shape of a protein in solution. It has the great advantage that the separation can be conducted under the conditions where the native, biologically active structure is maintained. However, those separation conditions may be inconsistent with the best performance of the detector. And, of course, the optimal conditions for detection may disturb the protein's structure. This is particularly relevant for MS detection, which performs best in a volatile mobile phase at low pH with relatively high concentrations of organic solvent. SEC can be performed under these conditions, but the observed elution volume will no longer reflect the structure of the protein as it existed in its native, biologically active state.
Despite this, there is value in SEC-MS. As shown in Figure 6, the SEC separation of a reduced and alkylated monoclonal antibody can be executed in a mobile phase that is optimal for electrospray ionization (ESI) (12). The heavy chain, light chain, covalent dimers, and clips are conveniently separated, and the mass of each is measured. This analysis is very useful for high-throughput assays such as reaction monitoring or fraction screening. There is no requirement for gradient re-equilibration and no need to develop methods for specific samples in this approach. Although SEC–MS is not a direct path to characterizing structural variants, it is still a source of valuable information about the protein sample (12).
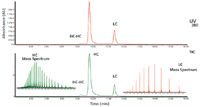
Figure 6: Size-exclusion chromatographyâUV-MS analysis of a reduced and alkylated monoclonal antibody, showing both UV and MS (total ion chromatogram) chromatograms and mass spectra for both heavy chains and light chains (12).
The fundamental question in biopharmaceutical analysis is the composition of the original sample, with respect to protein three-dimensional structure, and especially aggregation. Several approaches to this problem, alone or in conjunction with SEC, are available. Perhaps in a future "Biotechnology Today" column we will discuss at greater length the advantages of using MALS, SEC–MALS, analytical ultracentrifugation, and field-flow fractionation for both protein monomer and aggregate studies.
IEC is the third significant chromatographic separation mode applied to biopharmaceutical characterizations. To date, true UHPLC packing materials suitable for protein separations have not become commercially available. New materials, however, have been introduced by several manufacturers that give higher resolution chromatography than was available even a few years ago. These materials represent recent advances in surface chemistry that maximize protein selectivity and minimize secondary interactions. These materials also exhibit the reduced band-broadening characteristic of UHPLC on sub-2-µm particles. But all of the materials use large particles that mimic superficially porous materials by one of several, proprietary mechanisms. These modern packings do offer improved resolution of complex protein samples, as shown in Figure 7 (13).
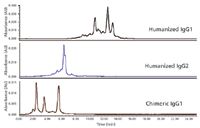
Figure 7: Comparison of three different antibody samples by ion-exchange chromatography using larger particles that mimic superficially porous materials (13).
It also is interesting to observe that IEC analysis of proteins has benefited from the recent developments in instrument design and control that began as refinements to meet the requirements of UHPLC separation mechanisms. Dispersion in the sample fluid path was minimized and more exact control of mobile-phase delivery was established. This has been extended to method programming tools that are specific to protein chromatography today. Because protein separations are most effectively adjusted by optimizing pH and ionic strength, it proved useful to develop algorithms (Auto-Blend Plus Technology, Waters Corporation, Milford, Massachusetts) that allow programming of four solvent pumping systems, directly in units of pH and salt concentration, as shown in Figure 8 (14).
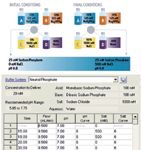
Figure 8: The use of Auto-Blend Plus software allows programming of a four-solvent pumping system directly in units of pH and salt concentrations in ion-exchange UHPLC of proteins or antibodies (14).
We have now considered three ways to analyze proteins. Each is based on different properties of the molecules, so all are employed to help ensure complete characterization of the different kinds of variation that can occur in protein structures. Now, let's move on to describe the analysis of one of the most important kinds of PTMs of biopharmaceutical proteins today — the attachment of glycans.
Glycoprofiling (Glycan Analysis)
As mentioned above, a key analytical technique that has become required in virtually all regulatory submittals of glycoproteins involves total glycan and monosaccharide analyses. In general, glycoproteins contain glycans, or oligosaccharides (sugars), and usually do not contain attached monosaccharides. Characterization of any glycoprotein requires the determination of the sugars that are present, measurement of their configurations as glycans, determination of the site or sites of attachment on the protein, and finally, the distribution of glycoforms (also known as variants,PTMs, or isoforms) of the protein within the sample.
One of the quality control and characterization methods available today first releases all bound glycans (or just N-linked glycans first), and then digests or hydrolyzes the freed glycans into their monosaccharide constituents. Then, the monosaccharides are monitored by a variety of accepted techniques, including HPAEC–PAD; fluorescence derivatization of monosaccharides followed by HPLC with UV and fluorescence detection; or permethylation followed by gas chromatography–mass spectrometry (GC–MS) analysis of the derivatized sugars (16,17). The qualitative and quantitative analyses for these monosaccharides then become lot-release and comparative assays to demonstrate consistency of production of the glycoprotein DS. It also serves to confirm the nature of the components in the DS, because any changes in specific glycoprotein components would change the nature of the monosaccharide profiling. Today, monosaccharide analysis is a routinely used method to confirm lot-release consistency for individual glycoproteins or mixtures.
To obtain more-complete information on the biological properties of the glycans, it is necessary to describe how the monosaccharides are assembled into the oligosaccharides on the surface of the protein. This description ultimately specifies the various compositions, sequences, chain lengths, linkages, and branching. This complicated analysis, true glycoprofiling (also known as glycan analysis), typically combines several kinds of information for complete characterization. The process begins with release of the N- or O-glycans by either chemical or enzymatic means. All glycans can be released together using base-catalyzed hydrolysis of intact glycoproteins or by hydrazinolysis. For characterizing biopharmaceuticals, N-linked glycans are usually the focus of analysis, and they are commonly released using specific enzymes, particularly PNGase F or G.
There are numerous methods for identifying these released glycans and, then, generating a glycoprofile. These now-routine assay methods are like other chromatographic assays in that the sample in question can often be compared to an authentic standard of pure, characterized glycans at known concentrations. As with all assays, a more elaborate validation process, including multiple kinds of information, supports the standard in use and the identification of the components derived from the glycoproteins. Several separation techniques have by now proven suitable for assaying biopharmaceutical glycoproteins, as explained below.
HPAEC–PAD was the first routine assay method developed several years ago. More recently, techniques involving HPLC and UHPLC or high performance capillary electrophoresis (HPCE) have become common and accepted. There is significant literature describing HPCE of glycans that can be located through the Beckman Coulter (Indianapolis, Indiana) web site (18). Other analytical instrument vendors also offer HPCE instrumentation and applications for glycoprofiling (for example, Agilent Technologies in Santa Clara, California).
However, the prevailing analytical methods invoked by most biotechnology firms involve some form of tagging the released glycans with UV- or fluorescence-active reagents, followed by appropriate UHPLC separations (reversed-phase chromatography, IEC, or HILIC) (19,20). In general, there is a great deal of literature on HPLC methods for providing a glycoprofile, usually with some form of organic tagging before separation and detection (16,17). Perhaps the most common reagent in vogue today is 2-aminobenzamide, or 2-AB. 2-AB and other commonly used reagents are compatible with fluorescence detection for best sensitivity, which is why UHPLC with fluorescence detection is rapidly becoming the standard method for glycoprofiling (Figure 9). Again, UHPLC conditions provide a reduced total elution time compared with conventional HPLC, improved resolution, improved peak symmetry and shapes, higher peak capacity, and the other attributes indicated in Table I.
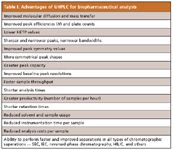
Table I: Advantages of UHPLC for biopharmaceutical analysis
There are several ways to identify the individual glycans in a chromatogram, as illustrated in Figure 9. One approach is to inject a known mixture of tagged glycan standards that are expected or known to be found in the specific sample, and then compare elution times and peak shapes. Peak identification can be confirmed by coupling the separation with both UV–fluorescence and ESI-MS detection. The MS system would provide the molecular weight of each 2-AB glycan, from which the parent glycan is readily derived, and this is then compared with the molecular weights of the known, standard glycans. Unequivocal identification of the peaks is not always possible, because many of the biologically significant structural variations have isobaric linkage and positional isomers. However, usually the high-resolution MS fragmentation patterns, especially cross-ring glycan fragmentations, are different for isobaric structural variations and they can be differentiated. Fragmentation patterns using collisionally induced dissociation (CID) or electron transfer dissociation–electron capture dissociation (ETD–ECD) of the intact 2-AB glycans do not always distinguish these isobaric isomers. The MS data can be described as consistent with a proposed glycan structure, but that must be combined with other analytical determinations to provide absolute confirmation of their structures.
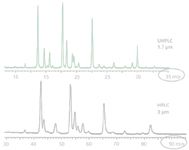
Figure 9: Comparison of a conventional 3-µm HPLC column with a 1.7-µm UHPLC column for the analysis of 2-AB labeled glycans from human IgG. Column: Waters BEH glycan (HILIC). (Reprinted with permission from reference 21.)
Many techniques are commonly used for complete determination of glycan structure as a part of validating the routine assay. This topic really ranges beyond the scope of this review, but we can briefly mention some of the common choices. One of the most powerful techniques is enzymatic (exoglycosidase) digestion of the tagged glycan, releasing one end-group monosaccharide at a time, and determining the shifts in elution times and molecular weights (with online ESI-MS) for the original glycan. By using a combination of enzymes with different specificity, both the sequence and the linkages can be deduced. Naturally, MS is a convenient and very popular tool for the characterization. It is used in combination with suitable databases and fragmentation patterns of standard, known glycans that are already well derived. Both matrix-assisted laser desorption–ionization time-of-flight mass spectrometry (MALDI TOF-MS) with in-source decay (ISD) off-line and HPLC–ESI-MS-MS have by now been well developed to enable sequencing and absolute identification of all known glycans found in natural or recombinant glycoproteins or antibodies. Ultimately, however, the description of the glycan profile is based on a knowledge of the enzymes present in the cell that synthesized the protein, enzymatic digestion, and often isolation of the glycan, followed by MS and nuclear magnetic resonance (NMR) spectroscopy.
UHPLC techniques have brought improved resolution and reliability to the assay of released glycans. As shown in Figure 9, the methods are better than comparable HPLC techniques. It should be noted that this useful assay is based on HILIC rather than reversed-phase chromatography. To achieve this performance, it was not sufficient to just use smaller particles. Rather, a new packing material was synthesized to be compatible with the small particles and higher pressure operation, while having improved selectivity for the important glycans. The percent peak areas or their ratios, in Figure 9, can then be used to characterize a specific glycoprofile for the released glycans that were first derived. This, then, becomes characteristic of that individual or mixture of glycoproteins and is suitable for lot-to-lot (batch-to-batch) comparisons and demonstration of chemical equivalencies of biosimilars, in part.
Figure 10 illustrates a different mixture of 2-AB glycans, these coming from ribonuclease B protein (21). The open circles and dark squares represent different monosaccharides linked together to yield the glycans indicated. There are any number of other monosaccharides possible in glycans derived from other glycoproteins. Some glycans are biantennary, some are triantennary, and some are higher order, branched chains. The inset figure in Figure 10 illustrates three distinct glycans for the three isomers possible for this triantennary glycan.
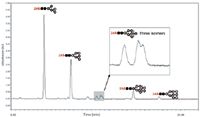
Figure 10: UHPLC analysis of 2-AB glycans derived from ribonuclease B glycans. Peak identification was done using UHPLC with electrospray ionization MS detection under the same gradient conditions. (Reprinted with permisison from reference 21.)
There are innumerable arrays of possible glycoprofiles possible for other glycoproteins, mixtures of glycoproteins, mixture of antibodies, fusion proteins, and others. And, each such glycoprofile, as shown in Figures 9 and 10, then becomes unique for that specific glycoprotein or any mixture of other glycoprotein variants. It is not only an issue of qualitative identification of each glycan present on the original DS, but also the relative percent peak areas of each such glycan, that then characterizes the original DS. And, that is what really becomes extremely useful in demonstrating batch-to-batch consistency of production or isolation, as well as showing that the expression system and production purification processes remain constant, lot-to-lot. These same techniques are proving extremely useful in comparing biosimilars with proprietary DS or DP. These are crucial points to make in any submittal to a regulatory agency.
Acknowledgments
We indicate our sincere appreciation to numerous colleagues within Waters Corporation who, over many years, have provided us with copies of journal publications, magazine articles, application notes, poster papers, and related materials dealing with UHPLC applications in biopharmaceuticals. We are especially indebted for several figures being used in this article, as provided by Tom Wheat and Ken Fountain at Waters, as well as for interesting discussions as we planned the content for these two columns.
Thomas E. Wheat is a principal scientist in the Systems Laboratory at Waters Corporation (Milford, Massachusetts). He earned a Ph.D. in cell biology from the University of Illinois and was a post-doctoral research associate at Northwestern University. He has used and studied protein and peptide chromatography throughout his academic and industrial career.

Thomas E. Wheat
Anurag S. Rathore is a biotech CMC consultant and an associate professor with the Department of Chemical Engineering at the Indian Institute of Delhi, India.

Anurag S. Rathore
Ira S. Krull is Professor Emeritus of Chemistry and Chemical Biology at Northeastern University, Boston, Massachusetts, and a member of LCGC's editorial advisory board.

Ira S. Krull
References
(1) I.S. Krull and A. Rathore. LCGC N. Amer., 29(9), 838–852 (2011).
(2) G. Walsh, Biopharmaceuticals: Biochemistry and Biotechnology, 2nd ed. (Wiley & Sons, Ltd., Chichester, UK, 2003).
(3) J. Geigert, The Challenge of CMC Regulatory Compliance for Biopharmaceuticals (Plenum Publishers, New York, New York, 2004).
(4) G. Walsh, Proteins- Biochemistry and Biotechnology (Wiley & Sons, Ltd., Chichester, UK, 2002).
(5) Pharmaceutical Biotechnology, Fundamentals and Applications, D.J.A. Crommelin, R.D. Sindelar, and B. Meibohm, Eds. (Informa Healthcare, New York, New York, 2008).
(6) Application Solutions for Biopharmaceuticals, A Focus on Protein Therapeutics (Waters Corporation, Milford, Massachusetts, 2009, 2010) www.waters.com.
(7) Separation Science Redefined, www.chromatographyonline.com (2005).
(8) T. Wheat, Principles and Practice of UHPLC, UltraPerformance Now More Accessible Than Ever, Training Course, Waters Corporation, (2010).
(9) Waters Automated Methods Development Software, available in collaboration with S-Matrix Corporation, Eureka, California.
(10) Fusion Method Development from S-Matrix, Waters Brochure 720003137en.pdf (2009).
(11) I. Krull, M. Swartz, J. Turpin, P.H. Lukulay, and R. Verseput, LCGC N. Amer., 26(12), 1190–1197 (2008).
(12) Waters Literature WA64266 and 720004076en (SEC), Waters Literature 720004018en (SEC-MS).
(13) Waters Literature 720003836en (IEC).
(14) Waters Literature 720003852en (Auto-Blend Plus).
(15) Wyatt Corporation, Santa Barbara, California, technical literature on MALS detectors for HPLC and SEC. www.wyatt.com.
(16) Techniques in Glycobiology, R.R. Townsend and A.T. Hotchkiss, Eds. (Marcel Dekker, Inc., New York, aka Taylor & Frances, Inc., New York, 1997).
(17) A Laboratory Guide to Glycoconjugate Analysis, P. Jackson and J.T. Gallagher, Eds. (Birkhauser Verlag, Basel, CH, 1997).
(18) Beckman Coulter, Inc., Brea California, www.beckmancoulter.com,
(19) J. Ahn, J. Bones, Y.Q. Yu, P.M. Rudd, and M. Gilar, J. Chromatogr. B 678, 403–408 (2010), and references therein.
(20) B. Gillece-Castro, K. van Tran, J.E. Turner, T.E. Wheat, and D.M. Diehl, "N-linked glycans of glycoproteins: a new column for improved resolution," Application Note, Waters Corporation (2009), and references therein.
(21) Innovative Chromatography Technology for Improved Biopharmaceutical Separations, Waters Corporation Seminar, Northeastern University, Boston, Massachusetts, October, 2009.
Common Challenges in Nitrosamine Analysis: An LCGC International Peer Exchange
April 15th 2025A recent roundtable discussion featuring Aloka Srinivasan of Raaha, Mayank Bhanti of the United States Pharmacopeia (USP), and Amber Burch of Purisys discussed the challenges surrounding nitrosamine analysis in pharmaceuticals.
Extracting Estrogenic Hormones Using Rotating Disk and Modified Clays
April 14th 2025University of Caldas and University of Chile researchers extracted estrogenic hormones from wastewater samples using rotating disk sorption extraction. After extraction, the concentrated analytes were measured using liquid chromatography coupled with photodiode array detection (HPLC-PDA).
Regulatory Deadlines and Supply Chain Challenges Take Center Stage in Nitrosamine Discussion
April 10th 2025During an LCGC International peer exchange, Aloka Srinivasan, Mayank Bhanti, and Amber Burch discussed the regulatory deadlines and supply chain challenges that come with nitrosamine analysis.


