Comparing the Chemical Profiles of Plant-Based and Traditional Meats Using GC–MS-Based Metabolomics
As the consumer interest and market for plant-based meat alternatives grows, understanding the nutritional differences between alternative and traditional meats is essential. This article describes an untargeted gas chromatography–mass spectrometry (GC–MS)-based metabolomics approach that compares the chemical profiles of a popular plant-based meat alternative and grass-fed ground beef using a GC system coupled to a GC–MS device. The samples were derivatized to simplify the chromatographic process and render the polar metabolites more volatile for GC–MS analysis. Statistical and multivariate analysis of the acquired and processed GC–MS data revealed that 90% of the annotated compounds differed between the plant-based alternative meat and the grass-fed ground beef samples. The ground beef and plant-based products each contained several compounds that were found in much smaller quantities, or not at all, in the other product. These results indicate differences in organic composition even though the nutritional labels on the back of the products were nearly identical. Heat maps, principal component analysis (PCA) score plots, variable importance plots (VIPs), and the clustering of compounds into metabolite classes provided further insights into the differences between the two types of meat products. The biological significance of the comparative data was studied using online databases and pathway analysis tools.
Meeting the dietary requirements of a growing global population, while addressing the health concerns and sustainability issues associated with the consumption of meat, has increased consumer and scientific interest in plant-based alternatives. As the popularity of these alternatives grows, it is important to understand whether they are nutritionally adequate substitutes for traditional meats, and if they provide lesser, equal, greater, or even complementary nutritional value.
A nutritional facts panel (NFP) is required on packaged foods in many countries; it is intended to communicate a food’s nutritional value by listing factors such as calorie count and the amounts of sugar, fat, vitamins, and minerals. The NFPs of commercially available plant-based meat alternatives and ground beef products are nearly identical (1). However, studies have shown that foods are complex and contain a wide variety of nutrients not listed on NFPs, including phenols, antioxidants, peptides, amino acids, fatty acids, and biogenic amines, all of which play a role in human health (2).
Discovery metabolomics—also known as untargeted metabolomics—using hyphenated mass spectrometry (MS) techniques is an approach to measuring the large numbers of nutrients and other compounds present in food matrices. Combined with an appropriate sample preparation method, gas chromatography–MS (GC–MS) in particular provides a robust solution for in-depth profiling of complex samples. Various nutrients—including amino acids, phenols, vitamins, unsaturated fatty acids, and dipeptides with potentially important physiological, anti-inflammatory, and immunomodulatory roles—can be analyzed using GC–MS. After GC–MS analysis, the data are processed to determine the differences between sample sets. Compounds of interest are identified using tools such as spectral libraries and chemical databases.
The complete workflow, including sample preparation, GC–MS, and data analysis methods, was developed and described by Van Vliet and others in their report highlighted in the literature (3).
Materials and Methods
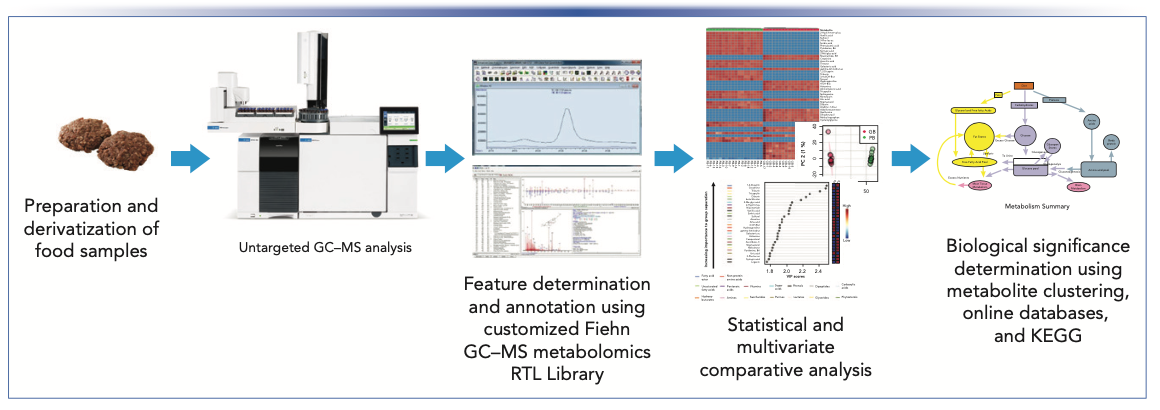
An overview of the experimental workflow is provided in Figure 1.
FIGURE 1: Overview of GC–MS-based metabolomics workflow used to compare the chemical profiles of plant-based and traditional meats.
Sample Preparation and Derivatization
For this study, 18 biological replicates of commercially available packaged plant-based (PB) meat alternatives and 18 biological replicates of grass-fed ground beef (GB), weighing 113 g (4 oz) each, were analyzed. As presented by Van Vliet and others, the patties were cooked in a non-stick skillet at 71 °C, and 1 g microcore samples were taken, immediately frozen in liquid nitrogen, and stored at −80 °C until analysis. The microcores were powdered under liquid nitrogen, and homogenized in 50% aqueous acetonitrile that contained 0.3% formic acid. Then, sample homogenates (100 μL) were transferred into 1.5 mL autosampler vials. The proteins in the homogenates were then crash precipitated with 750 μL of dry methanol and centrifuged for 5 min. The crash solvent was spiked with d27-deuterated myristic acid (CD3(CD2)12CO2H) as an internal standard for retention time locking.
For derivatization, the supernatant (700 μL) of each homogenate was transferred to fresh glass vials and dried with toluene as an azeotropic drying agent. Methoxyamine hydrochloride (25 μL) was then added to each sample, followed by sample incubation at 50 °C for 30 min for the methoximation of certain reactive carbonyl groups. In particular, methoxylation of sugars reduces the number of isomers present, simplifying subsequent data analysis. The compounds were made volatile for GC–MS analysis by replacing the easily exchangeable protons with trimethylsilyl (TMS) groups using N-methyl-N-(trimethylsilyl) trifluoroacetamide (MSTFA; 75 μL per sample) at 50 °C for 30 min.
GC–MS Instrumentation and Analysis
GC–MS analysis was carried out using a 7890 GC instrument coupled with a 5977 GC–MS detector. Injections were made using an Agilent 7693A Automatic Liquid Sampler (ALS) with an Agilent 7683B GC Injector. The 7890 GC instrument was equipped with an Agilent multimode inlet (MMI). Two wall-coated open-tubular (WCOT) Agilent J&W DB-5ms Ultra Inert GC columns (15 m × 25 mm, with 0.25-μm luminal film, part number 122-5512 UI) were connected in series by a purged ultimate union (PUU). The luminal film is a nonpolar, thermally stable phenyl-arylene polymer similar in performance to traditional 5%-phenyl-methylpolysiloxane films. The MMI in combination with a mid-column PUU enabled hot backflushing of the upstream half of the column at the end of each run to reduce fouling of the GC–MS instrumentation with heavy contaminants and carryover between injections.
The workflow used a modified version of the Fiehn method (4), a dedicated GC–MS analysis method for use with the Fiehn GC–MS metabolomics retention time locking (RTL) Library. Instead of a precolumn, the method used a heat ramp in the MMI to retain non-volatile compounds in the inlet. Retention indexing with the same nominal column dimensions makes the modification possible. Prior to each daily run (two total), the starting inlet pressure was empirically adjusted, so the retention time of the TMS-D27-C14:0 standard was 16.727 min. Following distillation in the MMI, the GC oven was ramped from 60 to 325 °C at 10 °C/min. Using these parameters, the derivatized compounds elute from the column at known times within specific tolerance of plus or minus 1 min.
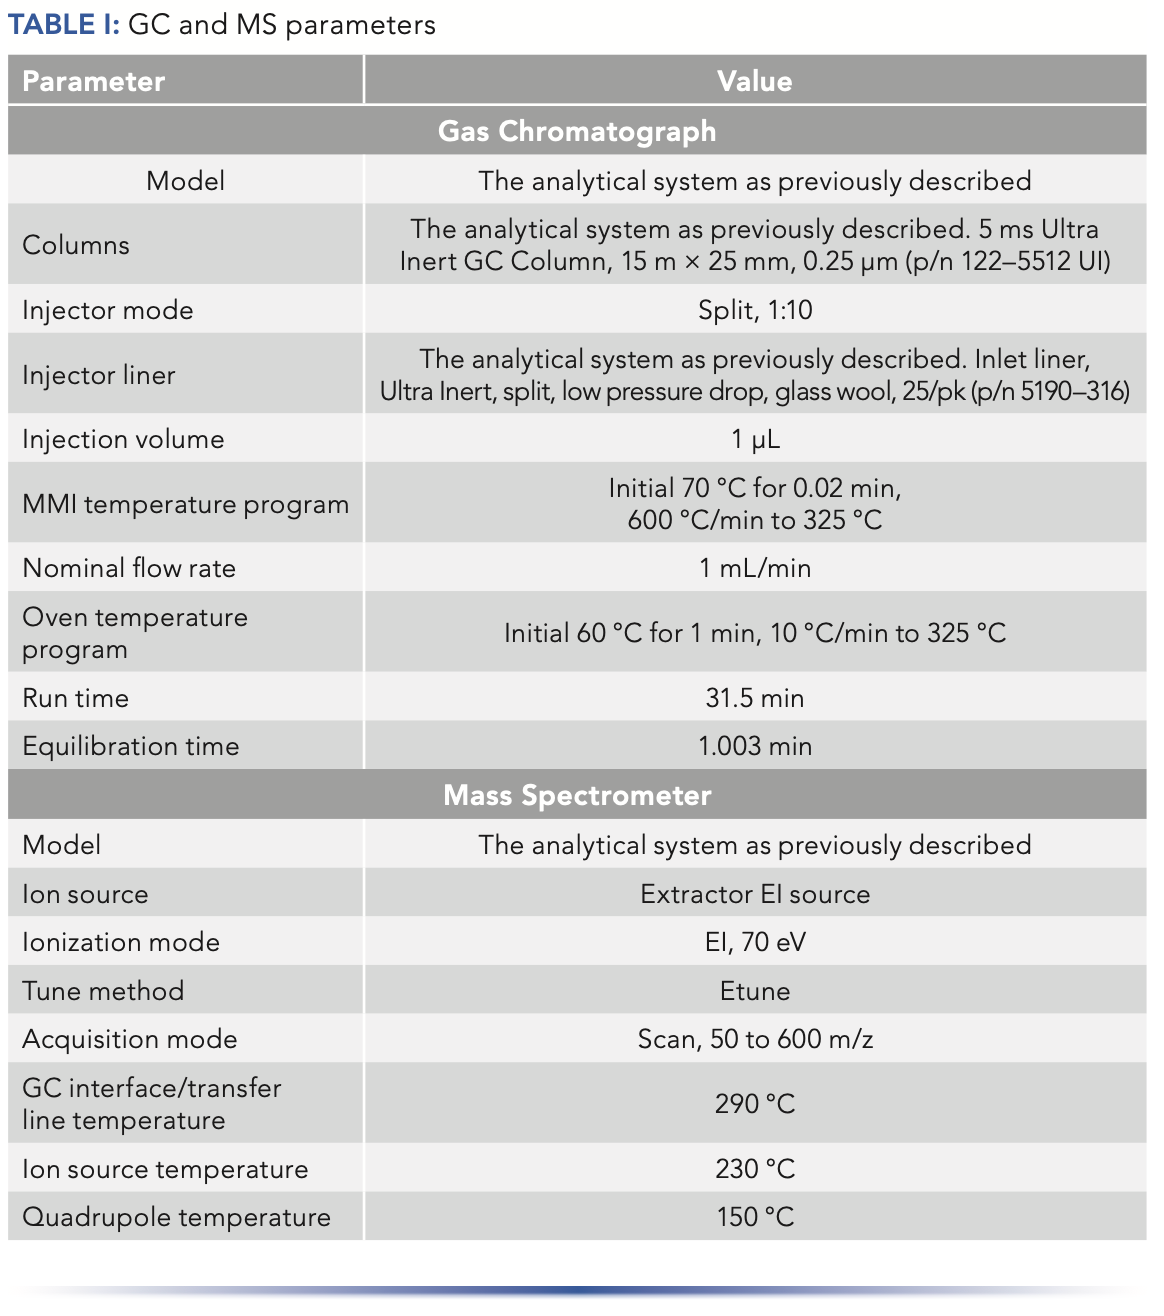
The 5977 MS detector was equipped with an Agilent Extractor electron ionization (EI) source for enhanced response for active compounds and late elution. The instrument was operated in EI mode with a scan range of 50 to 600 m/z. Data were acquired using Agilent MassHunter software. The GC and MS parameters are provided in Table I.
Data Analysis and Visualization
Raw GC–MS data acquired with MassHunter software were imported into the NIST Automatic Mass Spectral Deconvolution and Identification Software (AMDIS version 2.73) for processing including deconvolution, detection of spectral features, and feature annotation. Deconvoluted spectra were annotated using both GC retention time (RT), and EI mass spectral fragmentation pattern, based on a custom retention-time-locked spectral library of metabolites built on the Fiehn GC/MS Metabolomics RTL Library (part number G1676-90000). The Fiehn GC/MS metabolomics RTL Library is the most comprehensive commercially available GC–MS library of metabolite spectra, currently containing over 1400 entries for approximately 800 common metabolites, including spectra corresponding to partial derivatization of metabolites under the conditions described here. Each entry includes the metabolite name, CAS number, and PubChem number of the native molecule for easy compound recognition and subsequent literature, software, and pathway searching. The library and method can easily be expanded with more compounds to meet specific application needs. Additional spectra were added to the library by running pure reagent standards, from the Golm Metabolome Database, and from the Agilent Wiley with NIST MS Library software.
Data were processed using the Automated Mass Spectral Deconvolution and Identification System (AMDIS) and were manually interrogated to address miscalls and ambiguities in isomeric and other similar species. If a signal for a compound was found in >80% of samples of one type (beef or plant burger), but not present in any of the samples of the other type, it was assumed absent or below the lower level of detected in that type, and a value close to one was imputed prior to log transformation to allow for statistical analysis. After log transformation, the results were tested for normality using Kolmogorov-Smirnov testing (p <0.05). The differences in the abundances of metabolites between the two sample groups were compared using the Wilcoxon rank sum test with Benjamini-Hochberg adjusted p values at 5% (false discovery rate adjusted p <0.05).
Differences in the profiles of the two sample groups and identification of compounds contributing to those differences were visualized using a ranked heat map of the top 50 compounds based on Pearson distance measure and Ward clustering algorithm, and unsupervised principal component analysis (PCA) plots were generated using MetaboAnalyst (version 4.0). Partial least square-discriminant analysis (PLS-DA) was applied to determine the variable importance in projection (VIP) of each compound, and a VIP plot was generated to rank individual compounds for their ability to discriminate between PB and GB.
Compounds of interest were clustered into metabolite classes according to structural similarity using the ChemRICH Chemical Similarity Enrichment Analysis for Metabolomics online software. Bioactivities and health implications of specific compounds were investigated by interrogating the FooDB and PubChem online databases using the Chemical Abstracts Service (CAS) number of the compound of interest. Metabolic pathways were explored using the Kyoto Encyclopedia of Genes and Genomes (KEGG).
Results
GC–MS Performance for Derivatized Compounds
Samples were derivatized to simplify chromatography and make polar metabolites more volatile for GC–MS analysis. Using methoxyamine HCl in pyridine stabilizes reactive carbonyls (C=O) such as alpha-keto (=2-oxo) acids, which are prone to decarboxylation, enolization, and other side reactions that would result in more complex chromatograms. For example, many of the sugars are structural isomers. Methoxyamination of these sugars can reduce isomer formation. Replacement of the exchangeable protons with the trimeth- ylsilyl (TMS) -Si(CH3)3 (mass = 73) makes polar compounds more volatile.
Despite the complex sample matrix, by applying derivatization the GC–MS method provided adequate separation and detection to facilitate subsequent data processing and analysis.
Comparative Metabolomics Analysis
Analysis of GC–MS data using false-discovery-rate-adjusted statistical and multivariate methods revealed that 171 out of 190 annotated compounds (90%) were different (p <0.05) between the PB and the GB samples. Many compounds were found exclusively (31) or in greater quantities (67) in PB, while many other compounds were found either exclusively (22) or in greater quantities (51) in the GB compared with the plant-based alternative meat.
A ranked heat map of the 50 compounds that contributed most to the difference between PB and GB enabled easy visualization of the results, providing substantial evidence that the composition of the sample groups was quite different despite their similar NFPs (Figure 2). The score plot (Figure 3) from unsupervised PCA showed a distinct separation in components, with 97.3% of the variance explained by the first principal component (PC1), likewise indicating significant differences between PB and GB. The VIP plot (Figure 4) generated from the PLS-DA models enabled visualization of the ranking of individual compounds that discriminated between the PB and GB.
FIGURE 2: Heat map of the top 50 compounds ranked by p values (lowest to highest) that were significantly different (p < 0.05) between the GB and the PB. Red (intensity ranges from 0 to 1.5) indicates the higher abundance (upregulation) of a compound, while blue (intensity ranges from −0 to −1.5) indicates the lower abundance (downregulation) of a compound. The coding below the heat map represents the individual samples analyzed. Figure courtesy of van Vliet and others (3).
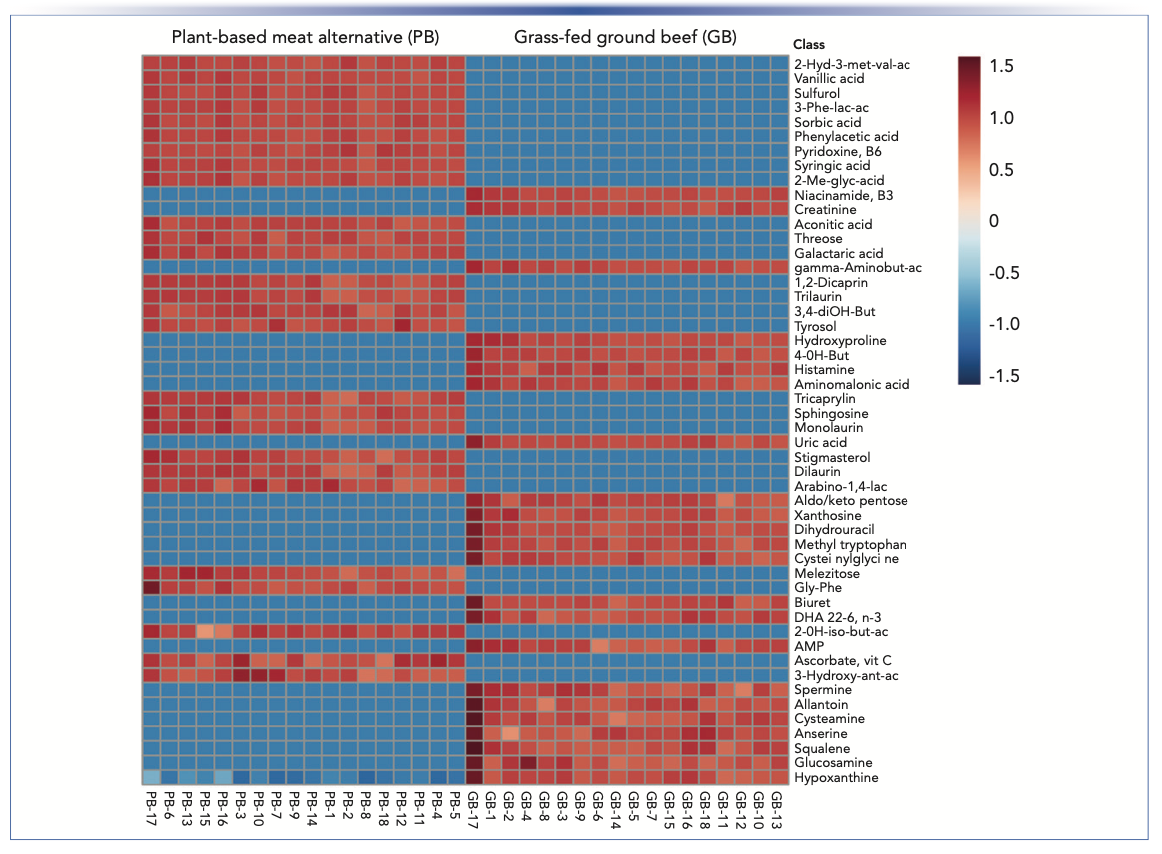
FIGURE 3: Score plot created using unsupervised PCA. Figure courtesy of van Vliet and others (3).
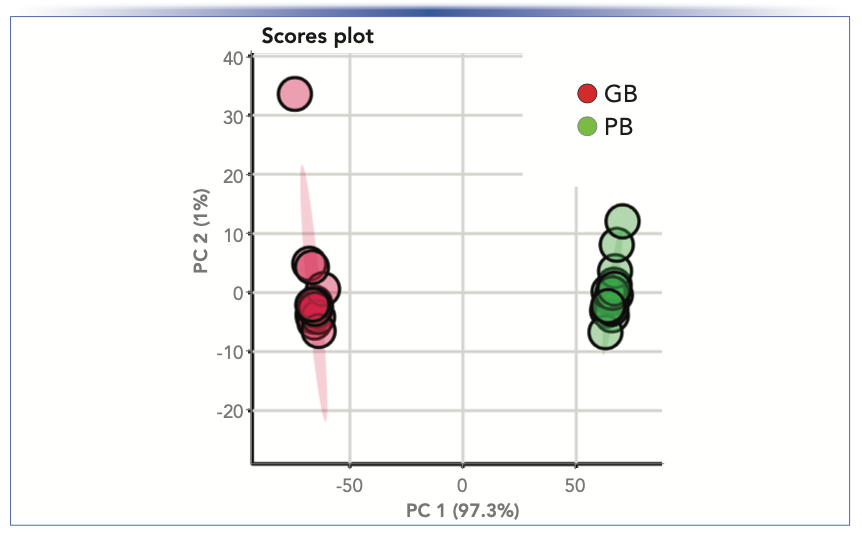
FIGURE 4: VIP plot generated from the PLS-DA models shows compounds ranked according to their prognostic importance (VIP scores) in separating the chemical profiles of GB and PB. The boxes on the right of the plot show the relative concentrations (blue: low to red: high) of each compound in the GB and PB samples. The colored bars at the left of the ranked compounds list the metabolite class of the ranked compounds that were identified using ChemRICH. Figure courtesy of van Vliet and others (3).
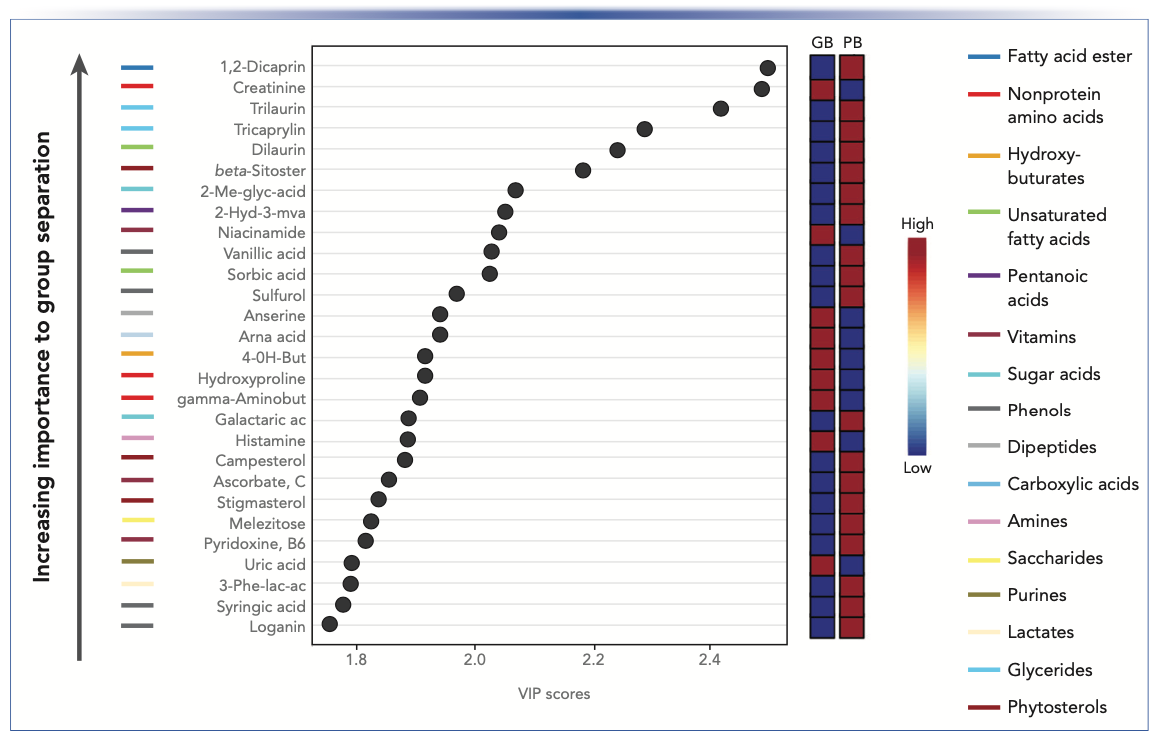
Individual compounds of interest were clustered into metabolite classes according to structural similarity using ChemRICH. Twenty-four classes with ≥3 structurally similar metabolites were found. Of the 24 metabolite classes, 23 differed significantly (false discovery rates adjusted p <0.05) between the GB and the PB.
The metabolite classes that most discriminated between GB and the PB were amino acids, nonprotein amino acids, saccharides, saturated fatty acids, dicarboxylic acids, phenols, dipeptides, sugar alcohols, vitamins, glycerides, unsaturated fatty acids, and amino alcohols (Figure 4). Metabolites in metabolite classes (such as phenols, tocopherols, and phytosterols) were found exclusively or in greater abundance in the plant-based meat alternative.
Interrogation of the FooDB and PubChem online databases, using Chemical Abstract Service (CAS) numbers and the Kyoto Encyclopedia of Genes and Genomes (KEGG), yielded information about the biological significance of the metabolite classes that differentiated GB, according to published reports, are compounds with vitamin E activity known for antioxidant properties (5). The polyunsaturated fatty acids, arachidonic acid (ARA, C20:4, ω-6) and docosahexaenoic acid (DHA, C22:6, ω-3), were found exclusively (ARA) or in greater quantities (DHA) in the GB samples. These fatty acids are major constituents of the brain phospholipid membrane, and have important roles in cognition, immunomodulation, platelet function, and cell signalling, and their deficiencies are associated with cognitive decline and increased risk of cardiovascular disease (6).
Taken together, the results suggest that despite nearly identical NFPs, GB and PB are not the same, and therefore not nutritionally interchangeable. Though more research is necessary to know for sure, the two different types of meats appear to provide complementary nutritional value.
Conclusion
Given the consumer interest and market growth in plant-based meat alternatives, understanding the differences between alternative and traditional meats beyond what is typically provided in NFPs is essential. With sample derivatization, GC–MS provides an analytical solution that enables measurement of various and numerous compounds with potentially important physiological roles, including amino acids, phenols, vitamins, unsaturated fatty acids, and dipeptides.
In this study, GC–MS provided data well suited to in-depth profiling of the chemical differences between derivatized GB and PB meat samples. False discovery rate–adjusted statistical and multivariate analysis of GC–MS data revealed that 90% of annotated compounds differed between the PB and the GB samples. Many compounds were found exclusively or in greater quantities in the PB, whereas many others were found either exclusively or in greater quantities in the GB. Heat maps, PCA score plots, and VIP plots that are commonly used to visualize metabolomics data, as well as clustering of compounds into metabolite classes, provided further insight into the differences between the types of meats. The biological significance of the comparative data was subsequently studied using online databases and pathway analysis tools. The GC–MS-based metabolomics workflow provided substantial evidence that despite nearly identical NFPs, GB and PB are not the same, and thus not nutritionally interchangeable. Overall, the workflow presented a robust and relatively inexpensive approach to profiling many types of food samples.
Acknowledgments
The authors would like to acknowledge Olga R. Ilkayeva, PhD, who developed the homogenization protocol, and laboratory technician Adam C. Mincey.
References
(1) International Food Council, A Consumer Survey on Plant Alternatives to Animal Meat. https://foodinsight.org/wp-content/uploads/2020/01/IFIC-Plant-Alternative-to-Animal-Meat-Survey.pdf (Accessed April 14, 2022).
(2) A.L. Barabási, G. Menichetti, and J. Loscalzo, Nat. Food 1, 33–37 (2020). https://doi.org/10.1038/s43016-019-0005-1
(3) S. van Vliet, J.R. Bain, M.J. Muehlbauer, F.D. Provenza, S.L. Kronberg, C.F. Pieper, and K.M. Huffman, Sci. Rep. 11, 13828 (2021). https://doi.org/10.1038/s41598-021-93100-3
(4) O. Fiehn, J. Kopka, R.N. Trethewey, and L. Willmitzer, Anal. Chem. 72, 3573–3580 (2000). https://doi.org/10.1021/ac991142i
(5) G. Wu, Amino Acids 52, 329–360 (2020). https://doi.org/10.1007/s00726-020-02823-6
(6) C.H.S. Ruxton, S.C. Reed, M.J.A. Simpson and K.J. Millington, J. Hum. Nutr. Diet. 17, 449–459 (2004). https://doi.org/10.1111/ j.1365-277X.2004.00552.x
(7) W. Hanghang, M.J. Muehlbauer, S.K. O’Neal, C.B. Newgard, E.R. Hauser, J.R. Bain, and S.H. Shah, Metabolites 7(3), E45 (2017). https://doi.org/10.3390/metabo7030045
ABOUT THE AUTHORS
Stephan van Vliet and Frederick D. Provenza are with Utah State University, in Logan, Utah. James Bain (above), Demitrius Hill, Michael Muehlbauer, Carl Pieper, and Kim Huffman are with the Duke University Medical Center, in Durham, North Carolina. Stephan Baumann and Tarun Anumol are with Agilent Technologies, Inc. Direct correspondence to: james.bain@duke.edu

New Study Reviews Chromatography Methods for Flavonoid Analysis
April 21st 2025Flavonoids are widely used metabolites that carry out various functions in different industries, such as food and cosmetics. Detecting, separating, and quantifying them in fruit species can be a complicated process.
Analytical Challenges in Measuring Migration from Food Contact Materials
November 2nd 2015Food contact materials contain low molecular weight additives and processing aids which can migrate into foods leading to trace levels of contamination. Food safety is ensured through regulations, comprising compositional controls and migration limits, which present a significant analytical challenge to the food industry to ensure compliance and demonstrate due diligence. Of the various analytical approaches, LC-MS/MS has proved to be an essential tool in monitoring migration of target compounds into foods, and more sophisticated approaches such as LC-high resolution MS (Orbitrap) are being increasingly used for untargeted analysis to monitor non-intentionally added substances. This podcast will provide an overview to this area, illustrated with various applications showing current approaches being employed.
Miniaturized GC–MS Method for BVOC Analysis of Spanish Trees
April 16th 2025University of Valladolid scientists used a miniaturized method for analyzing biogenic volatile organic compounds (BVOCs) emitted by tree species, using headspace solid-phase microextraction coupled with gas chromatography and quadrupole time-of-flight mass spectrometry (HS-SPME-GC–QTOF-MS) has been developed.
Fundamentals of Benchtop GC–MS Data Analysis and Terminology
April 5th 2025In this installment, we will review the fundamental terminology and data analysis principles in benchtop GC–MS. We will compare the three modes of analysis—full scan, extracted ion chromatograms, and selected ion monitoring—and see how each is used for quantitative and quantitative analysis.


