An Adventurous Journey Around the Thermodynamics of Liquid Chromatography
The characterization of the thermodynamics of separations, especially the calculation of the standard molar enthalpy and entropy through the van ’t Hoff plot, is a popular approach among chiral chromatographers, although it is already known that this representation was adopted into chromatography without real critical consideration. In our work, chiral chromatography is modeled with the column-coupling method to obtain the contribution of each adsorption site. Besides the original problems of the van ’t Hoff plot, it was found that the respective change in entropy (ΔS) and change in enthalpy (ΔH) values of each adsorption site differs significantly from the values obtained when both adsorption sites are present. The circumstances of the chromatographic adsorption were also examined to see whether the calculated values are important, or unique values are obtained for each system. Pressure especially affects the determined values, thus the chromatographic system used—high performance liquid chromatography (HPLC) or ultrahigh-pressure liquid chromatography (UHPLC)—has to be distinguished. We also have to ask: Is there any suitable equation that is less problematic to calculate thermodynamic quantities?
When it comes to thermodynamics in chromatography, and especially in chiral chromatography, the van ’t Hoff plot is almost always used. It is difficult to conduct an accurate literature search on this point, but I would estimate that 10% of chiral chromatographic studies contain at least one van ’t plot analysis. The common derived form of this equation relates the logarithm of the retention factor (k) to the standard molar enthalpy (∆H°) and entropy (∆S°) through the reciprocal of the absolute temperature (T) while the gas constant (R) and the phase ratio (φ) are also present:

The van ’t Hoff plot representation is mostly used to characterize and compare various stationary phases using a particular mobile phase—to obtain the isoenantioselective temperature; to explain unusual experimental observations and retention mechanisms; to interpret the strength of a formed adsorption bond; or just to calculate enthalpy and entropy values because we are used to it. It is obligatory that the difference in the free energy be negative for the separation to take place. This is attainable by either a decrease in the enthalpic term or an increase in the entropic term. Chiral separations are usually enthalpy driven at lower temperatures and entropy driven at higher temperatures (1).
In their review, Asnin and Stepanova (2) collected all the pitfalls that can arise during a van ’t Hoff analysis (measurement, computation, and interpretation) when chiral chromatographic conditions are used. However, when someone measures and calculate the values carefully, the obtained enthalpic and entropic values correlate with the true energies. Whatever the case, van ’t Hoff plot analysis was integrated into chromatography without critical considerations such as these:
- Chromatographic separations are neither isobaric nor isochoric
- ∆H° and ∆S° do change with temperature
- The retention factor is not an equilibrium constant (only a pseudo-equilibrium is present).
- The phase ratio is never known in liquid chromatography.
The van ’t Hoff plot is widely used by chromatographers because of its simplicity. Chankvetadze mentioned that, although isothermal titration calorimetry (ITC) and differential scanning calorimetry (DSC) are two alternatives to determine thermodynamic quantities, these methods are not adaptable to the heterogeneous systems used in chromatography (3). To eliminate the uncertainty caused by the lack of information about the true phase ratio, the differences between the molar enthalpies and entropies of two enantiomers are used by plotting the natural logarithm of their selectivity versus the reciprocal of the absolute temperature. However, data obtained this way lacks information about achiral recognitions (1,2):

Our investigations began with the separation of mefloquine enantiomers on a zwitterionic stationary phases (ZWIX) column (4). As the temperature was increased, the retention time and peak shape of only the more retained peak changed significantly.
The asymmetrical peak shape indicates more than one independent adsorption site. On a chiral column, enantioselective and non-selective adsorption sites are present (5–7). As the peak was deconvolved using stochastic theory and the characteristic function method for two adsorption sites, the energies of the interactions could be determined separately. However, the energies obtained this way were far from the one calculated from the retention factor. They cannot arise as the linear combination of the independent values.
However, this was only a theoretical aspect, and the adsorption sites cannot be investigated separately. How could this challenge be overcome?
The chiral conditions were modeled via reversed-phase columns. First, two columns having different adsorption mechanisms were investigated independently. We assumed that the columns contain only one type of adsorption site. Thus, when the columns were connected serially to each other, a system with two different, but known, adsorption sites was obtained. Here we should note that reversed-phase columns have more than one type of adsorption site; this assumption does not affect the results of the thermodynamic data (8–9).
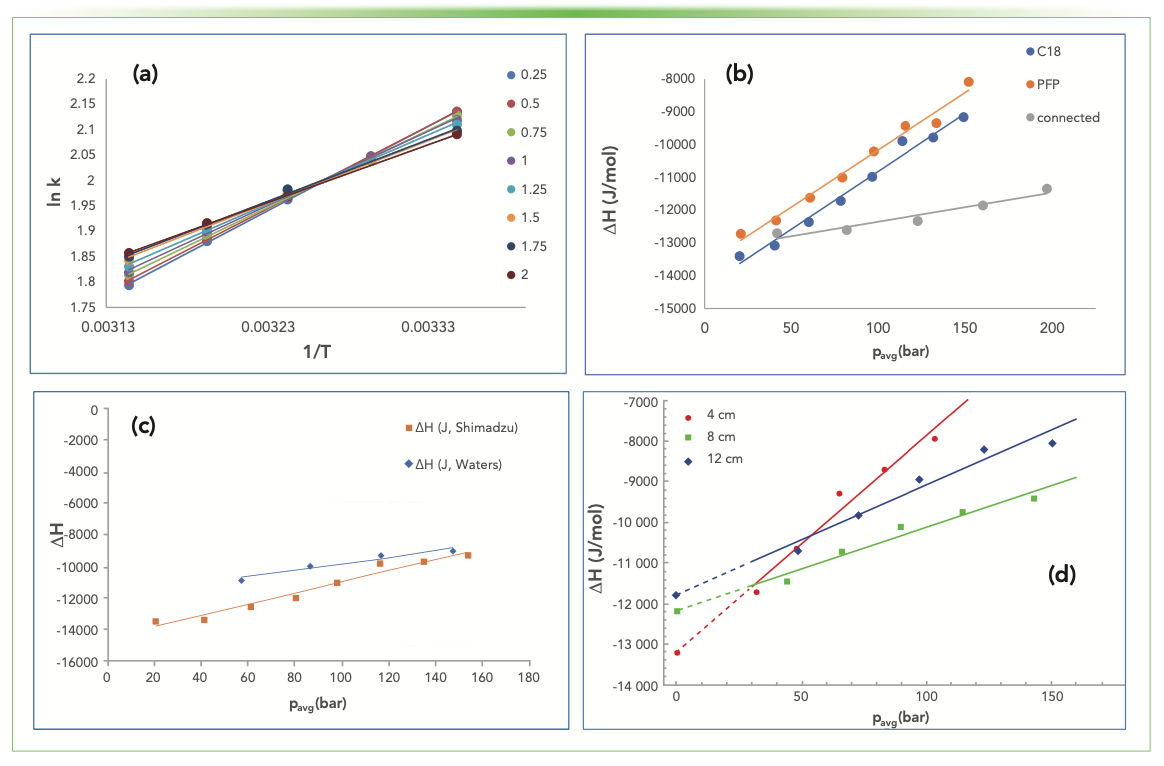
It was shown that basic chromatographic conditions such as the flow rate have a significant effect on the van ’t Hoff plots when the retention of caffeine was investigated on a Millipore Zorbax Eclipse Plus C18 (3.5 μm; 4.6 × 100 mm) and a Zorbax SB-CN (3.5 μm; 4.6 × 150 mm) column by methanol:water 25:75 (v/v%) (4). The flow rate was generated via pressure along the column; therefore, every setting that can affect the pressure and the thermodynamic quantities has to be investigated. The retention of butylbenzene was examined on a Phenomenex Luna C18 and PFP column (both 3.0 μm; 4.6 × 100 mm) using methanol:water 75:25 (v/v%) as the eluent. The flow rate has a significant impact on the slope and the intercept of the van ’t Hoff plot (Figure 1a), and therefore on the ∆H° and ∆S° values as well. As the standard molar enthalpies and entropies are calculated, we can see a huge difference—a 30% increase as the flow rate was increased almost tenfold.
FIGURE 1: (a) van ’t Hoff plots obtained when butylbenzene was injected on a C18 column using the HPLC at various flow rates; and ∆H° data comparison against the average pressure when (b) C18, PFP and connected columns were used; (c) when HPLC and UHPLC were used; and (d) when the length of the POPLC C18 column was 4 cm, 8 cm, or 12 cm.

Because the flow rate is generated via pressure in a chromatographic instrument, the idea came to represent the calculated energies as a function of the average pressure (Figure 1b). The data points for the independent columns, and when they are connected, also show a linear trend. It is possible that the extrapolation to zero pressure would give a corrected enthalpy value. As Figure 1b shows, the molar enthalpies calculated when the columns were connected to each other are far from the linear combination of the corresponding ones. The same observations apply to the molar entropies as well.
The pressure along the column varies using UHPLC equipment instead of a conventional HPLC. Figure 1c shows the differences in the calculated enthalpy values when the Luna C18 column was used either in a Shimadzu Prominence HPLC or in a Waters Acquity system. For the same pressure drop, UHPLC needs lower flow rates because of the narrow capillaries used.
The effect of the column length of Knauer POPLC ProntoSIL C18 SH2 columns on the thermodynamic quantities was also investigated, and, as Figure 1d indicates, ∆H° varies almost linearly as the flow rate and the pressure is increased. The extrapolation to zero average pressure is again a possible solution to eliminate the effect of the pressure.
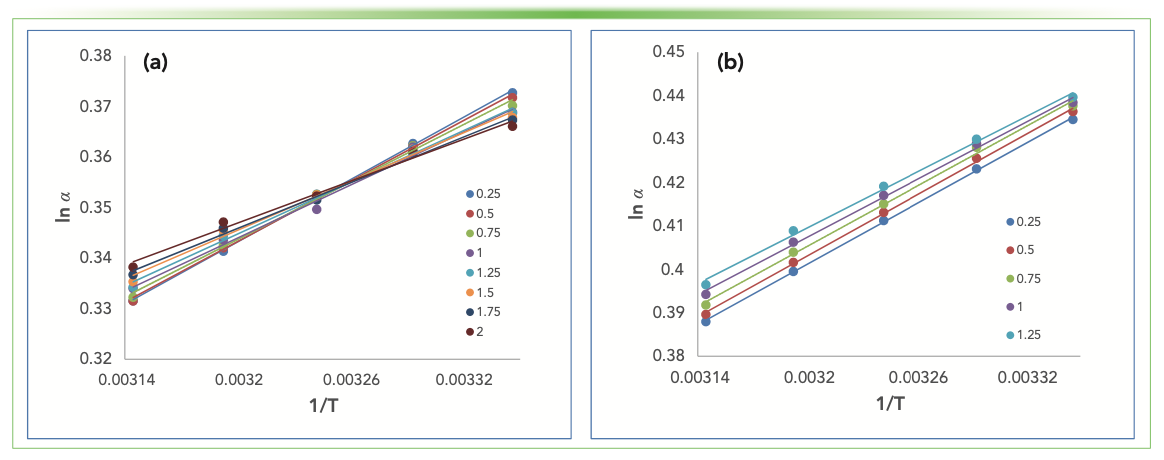
The main argument to use the logarithm of the separation factor (selectivity) instead of the retention factor is that the error introduced by the unknown phase ratio is eliminated. Figure 2 shows ln α against 1/T when only a PFP column was used (Figure 2a), and when C18 and PFP columns were connected (Figure 2b). It is interesting that both the slopes and the intercepts; thus, ∆∆H and ∆∆S values differ significantly when the PFP column is used, and there is a 20% increase in the derived values as the flow rate was increased from 0.25 to 2.0 mL/min, but only the intercept of the plots differ when the C18 and PFP columns were connected. This may show that the different effects of the adsorption sites can compensate each other when the selectivity plot is used.
FIGURE 2: Selectivity van ’t Hoff plots obtained by different flow rates when butylbenzene and pentylbenzene were analyzed (a) on a PFP column; and (b) when C18 and PFP columns were connected serially.

Summary
The conclusions are clear: the values determined by van ’t Hoff analysis only have practical significance if we analyze the results obtained with well-planned and systematically varied experiments, which were measured and evaluated under the same conditions in each case. In any case, the comparison of the obtained data should be avoided, even if it is about identical columns and identical devices, since there can be a significant difference in either of them, due to production or assembly.
References
(1) I. Matarashvili, G. Kobidze, A. Chelidze, G. Dolidze, N. Beridze, G. Jibuti, T. Farkas, and B. Chankvetamaria, J. Chromatogr. A 1599, 172–179 (2019). https://doi.org/10.1016/j.chroma.2019.04.024
(2) L.D. Asnin and M.V. Stepanova, J. Sep. Sci. 41, 1319–1337 (2018). https://doi.org/10.1002/jssc.201701264
(3) P. Peluso and B. Chankvetadze, Chem. Rev. 122, 13235–13400 (2022). https://doi.org/10.1021/acs.chemrev.1c00846
(4) A. Sepsey, É. Horváth, M. Catani, and A. Felinger, J. Chromatogr. A 1611, 460594 (2020). https://doi.org/10.1016/j.chroma.2019.460594
(5) A. Cavazzini, L. Pasti, A. Massi, N. Marchetti, and F. Dondi, Anal. Chim. Acta 706, 205–222 (2011). https://doi.org/10.1016/j.aca.2011.08.038
(6) L.D. Asnin, J. Chromatogr. A 1269, 3–25 (2012). https://doi.org/10.1016/j.chroma.2012.08.096
(7) M. Lämmerhofer, J. Chromatogr. A 1217, 814–856 (2010). https://doi.org/10.1016/j.chroma.2009.10.022
(8) F. Gritti and G. Guiochon, J. Chromatogr. A 1103, 43–56 (2006). https://doi.org/10.1016/j.chroma.2005.10.010
(9) F. Gritti and G. Guiochon, J. Chromatogr. A 1103, 57–68 (2006). https://doi.org/10.1016/j.chroma.2005.10.051
ABOUT THE AUTHOR
Annamária Sepsey is with the Separation Sciences Research Group at the University of Pécs, in Pécs, Hungary. Direct correspondence to: sepsey@gamma.ttk.pte.hu


Polysorbate Quantification and Degradation Analysis via LC and Charged Aerosol Detection
April 9th 2025Scientists from ThermoFisher Scientific published a review article in the Journal of Chromatography A that provided an overview of HPLC analysis using charged aerosol detection can help with polysorbate quantification.
Removing Double-Stranded RNA Impurities Using Chromatography
April 8th 2025Researchers from Agency for Science, Technology and Research in Singapore recently published a review article exploring how chromatography can be used to remove double-stranded RNA impurities during mRNA therapeutics production.


