Comparing the Separation Speed of Contemporary LC, SFC, and GC
LCGC Europe
Some 50 years after Giddings’s iconic comparison of the separation speed of gas chromatography (GC) and liquid chromatography (LC), the authors revisit this comparison using kinetic plots of the current state‑of‑the-art systems in LC, supercritical fluid chromatography (SFC), and GC. It is found that, despite the major progress LC has made in the past decade (sub-2-µm particles, pressures up to 1500 bar, core–shell particles), a fully optimized ultrahigh-pressure liquid chromatography (UHPLC) separation is still at least one order of magnitude slower than capillary GC. The speed limits of packed bed SFC are situated in between.
Photo Credit: den781/Shutterstock.com

Sander Jespers, Ken Broeckhoven, and Gert Desmet, Vrije Universiteit Brussel, Department of Chemical Engineering, Brussels, Belgium
Some 50 years after Giddings’s iconic comparison of the separation speed of gas chromatography (GC) and liquid chromatography (LC), the authors revisit this comparison using kinetic plots of the current stateâofâthe-art systems in LC, supercritical fluid chromatography (SFC), and GC. It is found that, despite the major progress LC has made in the past decade (sub-2-µm particles, pressures up to 1500 bar, core–shell particles), a fully optimized ultrahigh-pressure liquid chromatography (UHPLC) separation is still at least one order of magnitude slower than capillary GC. The speed limits of packed bed SFC are situated in between.
The ideal column and instrument format for gas chromatography (GC) was established many decades ago with the advent of film-coated fused-silica capillaries (1–4); however, the columns and instruments that are available for liquid chromatography (LC) and supercritical fluid chromatography (SFC) have been under a continuous stream of improvements over the past decades (5–7). This evolution continues up to the present day (8–13).
Although the choice between LC, GC, and SFC is nearly exclusively determined by the chemical nature of the sample, it remains an interesting exercise to make a generic speed comparison of the current state-of-the-art systems of these three different chromatographic modes. Establishing which mode produces the most theoretical plates for each given time, or, equivalently, requires the shortest time to achieve a given number of plates will, for example, directly assess how well the recent improvements in LC (ultrahigh-pressure liquid chromatography [UHPLC] pressures up to 1500 bar, core–shell particles) (13) and SFC (9,14–17) have allowed LC to catch up with the undisputed high speed of GC.
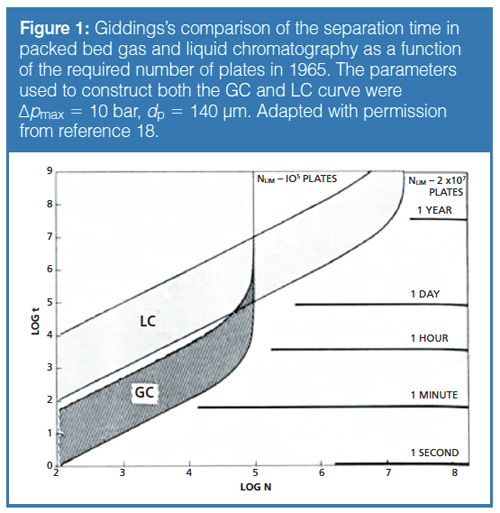
Another reason why a contemporary and generic kinetic performance comparison between GC, SFC, and LC seems appropriate is that, to the best of our knowledge, the only graphical head-to-head comparison between LC and GC was made by Giddings and hence dates back to 1965 (18). His iconic graph (Figure 1) furthermore only compares packed bed LC with packed bed GC, whereas the open-tubular format has long been the standard in GC.
Other, non-graphical theoretical comparisons of the separation power of LC and GC have been made by Knox (comparing packed bed GC with packed bed LC) (19) and Guiochon (comparing open-tubular GC with open-tubular LC) (20). More practically oriented comparisons have been made in the 1990s by Lee (21) and Cramers (22), who both included SFC in their comparison. To the best of our knowledge, no similar comparisons have been made in recent years, and certainly not using a generic graphical representation.
Kinetic Plot Essentials and Assumptions Made
In this article, we make a graphical comparison of the optimized separation speed of LC, GC, and SFC using the kinetic plot method (23–28). The only main assumption underlying the use of this method in the current study is that the reduced plate height is independent of column length and particle size. Although in practice some small deviations always tend to occur (29), this assumption is customarily made in chromatography and actually underlies the definition of the reduced plate height concept. It is also assumed that column length-effects, such as differences in viscous heating or extraâcolumn band broadening, can be neglected. The accuracy of these assumptions (a few percent) has been investigated in great detail in references 24, 25, and 30.
To represent the dependency of the plate height H with respect to the applied flow rate, a simple van Deemter model was used. For LC, this can be written as:

[1a]
For GC, the expression for the observed plate height should include Giddings’s compressibility factor JG to account for the additional band broadening caused by the mobile phase decompression along the column. Restricting ourselves to the most important case of GC coupled to mass spectrometry (MS), where the mobile phase undergoes a quasi-infinite expansion, this factor can be taken equal to JG = 9/8 (31)

[1b]
with u and p evaluated at any-but the same-location along the column.
For the packed bed columns, typical values for A, B, and C were taken from the literature and are given in the figure captions. For the open-tubular columns, B and C were calculated using the theoretical Golay expressions (2).
As shown in references 12 and 23, the kinetic plot method allows for a direct visual comparison of the separating power of different chromatographic systems. The method is directly based on the fundamental expressions for efficiency (N = L/H), analysis time (t0 = L/u0), and pressure drop (Δp = u0ηL/Kv0).
The technique was first developed as a direct visual method for isocratic LC (23). Later, it was adapted to gradient LC and recently also to isothermal and programmed temperature GC (24,27,32,33). The approach distinguishes both fixed and variable length comparisons (27).
Fixed length kinetic plot curves are obtained when using a given type of particles (with a given size), packed in a column with a given length, and representing the (time, efficiency) relationship one gets by varying the pressure (that is, the flow rate) on that column. The dashed lines shown in Figure 2(a) are all examples of this, each relating to a different column length (obviously, the 0.5 m and 1 m curves refer to coupled column systems) (9,17,34,35). It should be noted that these fixed length kinetic plot curves touch an enveloping kinetic performance limit (KPL) curve when the pressure reaches the maximum allowable pressure (Δp = Δpmax). This enveloping curve (bold full line in Figure 2[a]) connects all possible combinations of length and velocity for which the considered chromatographic material (2.5 µm particles in the present case) performs at its kinetic optimum, that is, it performs as close as possible to the right bottom corner of the graph, where the highest N is produced in the shortest time. In order to compare the kinetic performance of two different materials or operating conditions, it is sufficient to compare only the enveloping KPL-curves, for any condition lying above this curve relates to a sub-optimal use of the column.
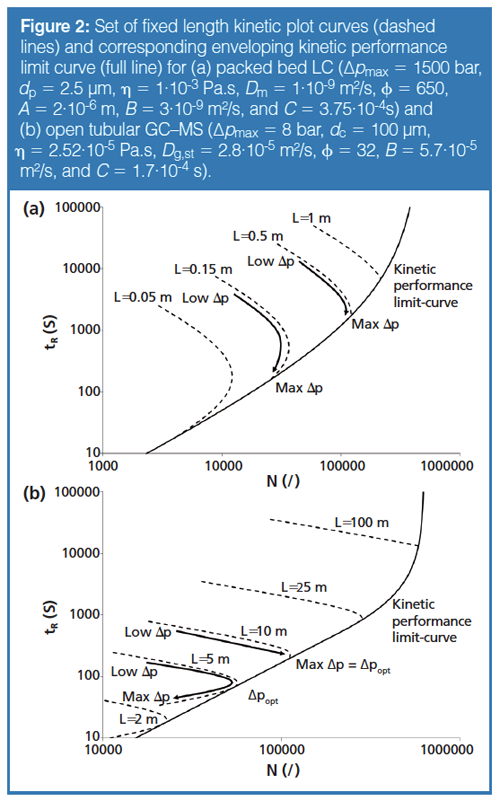
Figure 2(b) shows the result of a similar exercise, but now for open-tubular GC (100 µm internal diameter [i.d.]). A small yet important difference is that now the fixed lengthâcurves no longer touch the enveloping performance limit curve at the maximum pressure, but at some (potentially lower) pressure, which depends on the considered void time and can generally be referred to as the optimal pressure (Δp = Δpopt) (32). For this present case of GC–MS, where the ratio between out- and inlet-velocities tends to infinity, Δpopt is given by:

[2]
With η the mobile phase viscosity (Pa.s), t0 the kinetic performance limit void time (s), Kv0 the column permeability (m2), and B and C the van Deemter constants. An equivalent solution, given in terms of flow rate, was previously deduced by L.M. Bloomberg (36). When Δpopt>Δpmax, the fixed length curve is stopped at the latter pressure (this is the case for the longer column lengths in Figure 2[b]).
Going one step further, the different particle or capillary diameters can be compared. This can be seen in Figure 3, where all fixed length curves have now been omitted because these relate to sub-optimal conditions, retaining only the KPL-curves. It should be noted that low efficiencies require small particle or capillary diameters, whereas high efficiencies require large diameters. The KPL-curves for the different sizes all touch the same extreme line, known in the literature as the Knox-Saleem limit line (26,28,37). For LC and GC–MS, this limit line can be represented by the following analytical expression (19,28).

[3]
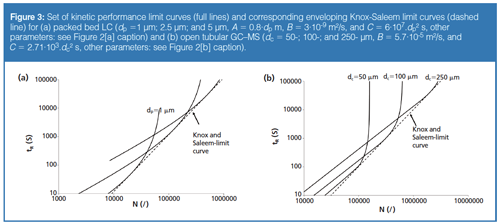
For LC, α = 1, while α = 4/3 for GC–MS (19). Equation 3 shows that if optimizing both the size, the length, and the flow rate, the minimal analysis time will inevitably go up with the square of N. In a log-log plot of time versus N, equation 3 represents a straight line (cf. the dashed lines in Figures 3–7). Each point on this line corresponds to a different diameter. From equation 3, an expression for this diameter can be derived using N = L•H and multiplying both sides of the equation by d² and Dmol.

[4]
In all presented plots, the length of the corresponding columns varies from short (left-hand side of the curves) to very long (quasi-vertical asymptote on the right-hand side). While there is in principle no upper limit for column length (by coupling columns any desired length can be made), there is certainly a practical lower limit for the length. In the present study these were taken to be 2 cm for both packed bed and open-tubular LC columns, 2 m for open-tubular GC columns, and 50 cm for packed bed GC columns. All full line curves in Figures 2–7 start at these column lengths. The tR-times specified in Figures 2–7 have all been calculated using tR = t0.(1 + k) with k = 9, while efficiencies are reported for a k = 3-component.
Intrinsic Speed Comparison: LC versus GC in Packed Beds
Figure 4 compares the kinetic performance of LC and GC for packed bed columns. This is also what Giddings pursued in his 1965 plot (Figure 1). Comparing both, we observe substantial differences. Figure 4 shows two parallel bands, with the LC band consistently lying below the GC band. Giddings’s plot in Figure 1 suggests the performances of GC and LC cross at some given efficiency (N = 100,000), with GC performing better in the lower plate number range and LC performing better at high N. The observed difference can be explained by the fact that Giddings only considered one size for each separation mode (the bands in his plot are there to represent different packing qualities), whereas the curves making up our bands for LC and GC all relate to different particle sizes (we only consider the highest, currently available, packing quality). The crossing of the bands in Figure 1 is therefore a consequence of the fact that he only considers one particle size for each mode. If one focuses on the dp = 250 µm curve for GC and the dp = 5 µm curve for LC in Figure 4, we see the same type of crossing between LC and GC performance as in Giddings’s plot.
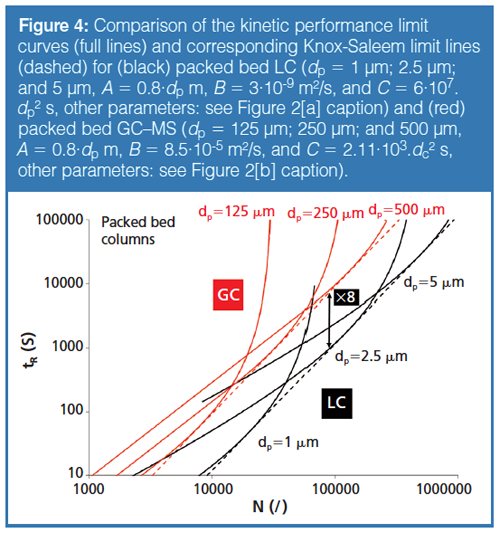
By taking a more comprehensive look at Figure 4, we can see that the LC-curves consistently lie below those for GC. This suggests that packed bed LC produces faster analysis than packed bed GC. However, before jumping to any conclusions, one should bear in mind that the vertical position of the curves is directly proportional to the applied pressure, via equation 3. The GC-curves have all been established assuming a Δpmax = 8 bar pressure gradient, and the LC band roughly lies about a factor of 8 lower (that is, faster) than the GC band. The inverse pressure dependency in equation 3 shows that packed bed GC will be able to outperform the current best possible packed bed LC performance as soon as gas pressures in the range of Δp = 64 bar and higher are being used for the GC case. Although no commercial GC instrumentation currently exists that operates at such elevated pressures, packed bed GC at pressures up to 200 bar (38) has already been demonstrated. Please note that, according to equation 3, the position of the curves also depends on the mobile phase viscosity η, which is about 40 times higher for LC compared to GC, but this has been taken into account.
Intrinsic Speed Comparison: LC versus GC in OpenâTubular Capillaries
Figure 5 again compares GC with LC, but now both in their open-tubular variant. With the selected pressures, LC again outperforms GC. The assumed Δpmax = 800 bar for the openâtubular LC roughly corresponds to the highest commercially available pressure in the capillary LC segment, and leads to separations that are about fourfold faster than in standard capillary GC practice (assuming Δpmax = 8 bar). An important remark here is that the LC data shown in Figure 5 corresponds to capillaries with a fully optimized internal diameter and is therefore merely of a theoretical nature because it relates to capillary diameters around and below 1 µm, that is, well below the 5 µm i.d. currently considered as being the practical limit for open-tubular capillaries (39). This limitation arises from the tedious fabrication and operation of micrometre-sized wall-coated capillaries, as well as from the poor detectability associated to such narrow internal diameters.
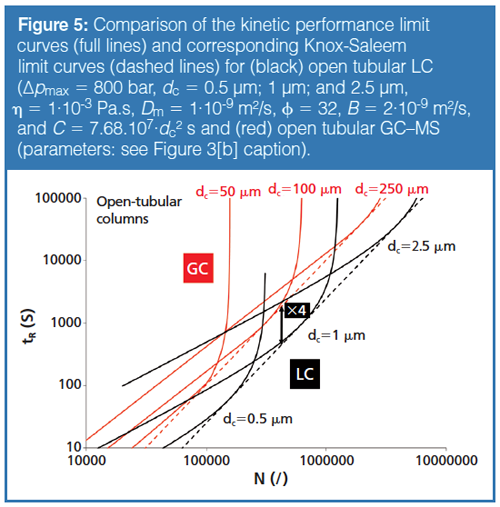
Similar to what has already been mentioned about Figure 4, the relative vertical position of the LC and GC curves in Figure 4 is not set in stone; it can easily be reversed by considering a higher pressure for GC. Given the roughly fourfold difference in speed between open-tubular GC and LC, equation 3 implies that it would be sufficient to raise the pressure in the capillary GC system Δpmax = 8 bar to roughly Δpmax = 32 bar to bring the open-tubular GC performance up to the speed level of open-tubular LC. However, to remain within the same range of efficiencies, this would, according to equation 4, require halving the capillary diameters from 50-, 100- ,and 250-µm to 25-, 50-, and 125âµm. It goes without saying that this will inevitably compromise the mass loadability and the detection sensitivity of these columns, and is therefore not always desirable or possible.
Comparing the State-of-the-Art: Packed Bed LC and SFC with Capillary GC
Figure 6 compares the state-of-the-art LC conditions (packed bed UHPLC with size-optimized core–shell particles) with the state-of-the-art GC conditions (open-tubular GC–MS with sizeâoptimized capillaries) using helium (he) as carrier gas (although H2 allows for a roughly 40% faster analysis, the majority of GC–MS equipment is still operated using He as carrier gas because of its inertness and safety). Comparing the Knox-Saleem limit lines, we roughly see a 12-fold difference in speed between openâtubular GC and packed bed LC. Just over 10 years ago-before the introduction of UHPLC and the core–shell technologies in the years 2005–2007-LC was roughly some 5 to 8 times slower than it is today (12). This means that, despite the fact that LC was able to wipe off quite a bit of its delay, there is still a long way to go before the speed in packed bed LC will really have caught up with that of capillary GC. Furthermore, it can also be readily observed that the 250 µm capillary format-still the standard work horse in GC-outperforms all possible LC conditions over the entire considered range of efficiencies. Finally, looking at the current state-of-the-art in SFC, it should be considered that the theory underlying the kinetic performance limit curves is more complex in SFC than it is in LC or GC. Because of the significant change in mobile phase properties as a function of pressure, the linear velocity, diffusion coefficients, and retention factors all vary along the column (40,41). To measure or calculate the kinetic performance limits in SFC, elaborately designed and time-consuming measurements (17) or complex numerical simulations are required (42). The only easy way out is to assess the properties of the column performance and mobile phase at the average operating pressure and assume they are constant along the column. This so-called isopycnic method (assuming a fixed mobile phase density) provides a relatively good approximation of the true behaviour (17,42). In addition, a choice has to be made regarding temperature and mobile phase composition (fraction of organic modifier) because these also strongly affect the viscosity of the mobile phase in SFC. For the examples presented in this work, values corresponding to practical conditions in SFC were used (see Figure 7 caption) (15,43).
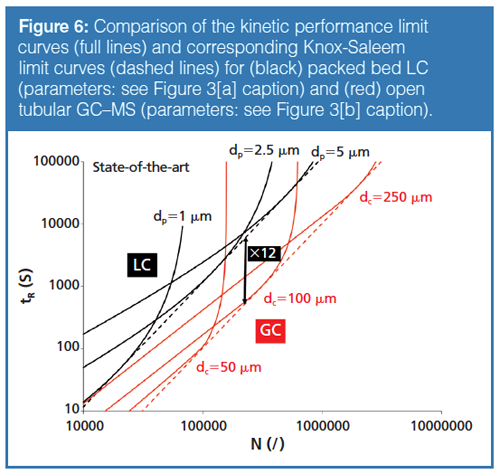
Figure 7 shows that the expected maximum kinetic performance of contemporary packed bed SFC is nicely intercalated between that of LC and GC. Since both the LC- and SFC-case relate to the packed bed situation, the threefold improvement of SFC over LC can be entirely explained from equation 3, where the η/Δpmax-ratio is the only differentiating factor. In SFC, the viscosity of the mobile phase is about 10 times lower compared to LC (1•10-4 Pa.s versus 1•10-3 Pa.s). This is partly countered by the fact that the Δpmax currently used in SFC is lower than in LC (450 bar versus 1500 bar). Both effects combined lead to a η/Δpmax-factor that is 3 times smaller for SFC (2.2•10-12 s) than for LC (6.6•10-12 s). Please note that the considered Δpmax = 450 bar value already corresponds to 600 bar at the inlet, given the need for 150 bar back pressure.
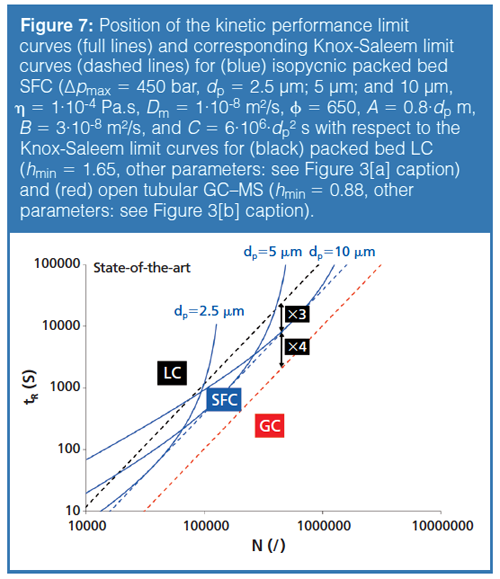
Turning now to the roughly fourfold slower separation speed of SFC compared to GC-one of the other observations that can be made from Figure 7-this can be explained using equation 3, but now there are two counteracting effects in play. SFC has the advantage of a lower η/âpmax-ratio (3.2•10-11 s for GC versus 2.2•10-12 s for SFC), but the open-tubular geometry used in GC has a much smaller hmin²Ï-factor (= separation impedance) than the packed bed geometry considered for SFC (hmin²Ï = 25 versus 1770). These numbers are most strongly influenced by the much lower flow resistance of the open-tubular system (Ï = 32 for GC versus 650 for SFC) and to a lesser extent also by its lower hmin-value (hmin = 0.88 for the open-tubular system versus 1.65 for the packed bed column).
Capillary SFC is not considered in the above comparison because most applications of SFC are now with packed bed columns (9,14,15,16,17,40,41). Moreover, to compare the maximum speed of capillary SFC with that of GC, it simply suffices to compare the η/Δpmax-ratios. These are more than 10 times smaller for SFC (2.2•10-12 s) than for GC (3.2•10-11 s) when taking the same pressure driving forces as used above. However, to achieve the dazzling 10-fold improvement in speed over capillary GC, the capillary SFC system would, according to equation 4, require capillary internal diameters in the order of 0.2 µm (for N = 10,000) to 2 µm (for N = 1,000,000).
Finally, comparing the state-of-the-art in LC with GC (cf. the ×12 arrow in Figure 6), LC also has the advantage of a smaller η/Δpmax-ratio (3.2•10-11 s for GC versus 6.6•10-12 s for LC), but this is again completely overtaken by the much smaller hmin²Ï-factor of the open-tubular geometry used in GC versus the packed bed geometry considered for LC (hmin²Ï = 25 compared to 1770).
Conclusions
The kinetic plot analysis presented in Figures 6 and 7 shows that when considering the currently available highest pressures and best packed bed performances, a fully optimized GC system (thin-film coated capillary optimized diameter, length, and flow rate) will still generate a given number of theoretical plates about 10 to 12 times faster than a fully optimized stateâof-the-art LC system. This gain is a result of the difference in column format (open-tubular geometry versus packed bed), for the actual thermodynamic resistance factor (that is, the η/Δpmax-ratio appearing in equation 3) is in favour of LC (typical values are η/Δpmax = 6.6•10-12 s for LC versus η/Δpmax = 3.2•10-11 s for GC), which in turn is essentially a result of the much larger pressures that are being used in LC. Packed SFC has speed limits lying in between those of packed bed LC and capillary GC.
Acknowledgement
S.J. gratefully acknowledges a research grant from the Research Foundation Flanders (FWO Vlaanderen).
References
- M.J.E. Golay, Anal. Chem.29, 928–932 (1957).
- M.J.E. Golay and D.H. Desty, Eds., Gas Chromatography (Buttersworth Scientific, New York, USA, 1958).
- L.S. Ettre, J. High Resolut. Chromatogr.10, 221–230 (1987).
- M.L. Lee, F.J. Yang, and K.D. Bartle, Open Tubular Column Gas Chromatography: Theory and Practice, 1st Ed. (Wiley, New York, USA, 1984).
- A.C. Sanchez, G. Friedlander, S. Fekete, J. Anspach, D. Guillarme, M. Chitty, and T. Farkas, J. Chromatogr. A1311, 90–97 (2013).
- A.D. Jerkovich, J.S. Mellors, J.W. Thompson, and J.W. Jorgenson, Anal. Chem.77, 6292–6299 (2005).
- A. Cavazzini, F. Gritti, K. Kascmarksi, N. Marchetti, and G. Guiochon, Anal. Chem. 79, 5972–5979 (2015).
- B. Bobaly, D. Guillarme, and S. Fekete, J. Sep. Sci.37, 189–197 (2014).
- R. De Pauw, K. Shoykhet, G. Desmet, and K. Broeckhoven, J. Chromatogr. A1374, 247–253 (2014).
- S. Fekete, M. Rodriguez-Aller, A. Cusumano, R. Hayes, H.F. Zhang, T. Edge, J.L. Veuthey, and D. Guillarme, J. Chromatogr. A1431, 94–102 (2015).
- T.C. Wei, A. Mack, W. Chen, J. Liu, M. Dittmann, X.L. Wang, and W.E. Barber, J. Chromatogr. A1440, 55–65 (2016).
- K. Broeckhoven and G. Desmet, TrAC Trends in Analytical Chemistry63, 65–75 (2014).
- J. De Vos, M. De Pra, G. Desmet, R. Swart, T. Edge, F. Steiner, and S. Eeltink, J. Chromatogr. A1409, 138–145 (2015).
- A. Grand-Guillaume Perrenoud, C. Hamman, M. Goel, J.-L. Veuthey, D. Guillarme, and S. Fekete, J. Chromatogr. A1314, 288–297 (2013).
- E. Lesellier and C. West, J. Chromatogr. A 1382, 2–46 (2015).
- L. Nováková, A. Grand-Guillaume Perrenoud, I. Francois, C. West, E. Lesellier, and D. Guillarme, Anal. Chim. Acta824, 18–35 (2014).
- S. Delahaye, K. Broeckhoven, G. Desmet, and F. Lynen, J. Chromatogr. A258, 152–160 (2012).
- J.C. Giddings, Anal. Chem.37, 60–63 (1965).
- J.H. Knox and M. Saleem, J. Chromatogr. Sci. 7, 614–622 (1969).
- G. Guiochon, Anal. Chem.50, 1812–1821 (1978).
- P.A. Peaden and M.L. Lee, J. Chromatogr.259, 1–16 (1983).
- H.G. Janssen and C.A. Cramers, J. Chromatogr.505, 19–35 (1990).
- G. Desmet, D. Clicq, and P. Gzil, Anal. Chem.77, 4058–4070 (2005).
- K. Broeckhoven, D. Cabooter, F. Lynen, P. Sandra, and G. Desmet, J. Chromatogr. A1217, 2787–2795 (2010).
- S. Heinisch, G. Desmet, D. Clicq, and J.-L. Rocca, J. Chromatogr. A1203, 124–136 (2008).
- U.D. Neue, LCGC Europe 22, 570 (2009).
- K. Broeckhoven, D. Cabooter, and G. Desmet, LCGC Europe24, 396 (2011).
- P.W. Carr, X. Wang, and D.R. Stoll, Anal. Chem. 81, 5342–5353 (2009).
- F. Gritti and G. Guiochon, J. Chromatogr. A1333, 60–69 (2014).
- D. Cabooter, F. Lestremau, A. de Villiers, K. Broechhoven, F. Lynen, P. Sandra, and G. Desmet, J. Chromatogr. A1216, 3895–3903 (2009).
- C.A. Cramers, H.G. Janssen, M.M van Deursen, and P.A. Leclercq, J. Chromatogr. A856, 315–329 (1999).
- S. Jespers, K. Roeleveld, F. Lynen, K. Broeckhoven, and G. Desmet, J. Chromatogr. A1386, 81–88 (2015).
- S. Jespers, K. Roeleveld, F. Lynen, K. Broeckhoven, and G. Desmet, J. Chromatogr. A1450, 94–100 (2016).
- C.S. Louw, F. Lynen, M. Hanna-Brown, and P. Sandra, J. Chromatogr. A1217, 514–521 (2010).
- A. Vaast, J. De Vos, K. Broeckhoven, M. Verstraeten, S. Eeltink, and G. Desmet, J. Chromatogr. A1256, 72–79 (2012).
- L.M. Blumberg and C.F. Poole, Eds., Gas Chromatography, 1st Ed. (Elsevier, Amsterdam, Netherlands, 2012).
- S.R. Groskreutz and S.G. Weber, Anal. Chem.88, 11742–11749 (2016).
- N. Wu, Q. Tang, J.A. Lippert, and M.L. Lee, J. Microcolumn Sep. 13, 41–47 (2001).
- T. Hara, S. Futagami, S. Eeltink, W. De Malsche, G.V. Baron, and G. Desmet, Anal. Chem.88, 10158–10166 (2016).
- A. Tarafder, J.F. Hill, P.C. Iraneta, and K.J. Fountain, J. Chromatogr. A1406, 316–323 (2015).
- D.P. Poe, D. Veit, M. Ranger, K. Kaczmarski, A. Tarafder, and G. Guiochon, J. Chromatogr. A 1250, 105–114 (2012).
- R. De Pauw, G. Desmet, and K. Broeckhoven, J. Chromatogr. A 1305, 300–309 (2013).
- S. Delahaye, K. Broeckhoven, G. Desmet, and F. Lynen, Talanta 116, 1105–1112 (2013).
Sander Jespers obtained his master’s degree in bioâengineering at the Vrije Universiteit Brussel (VUB), Belgium, in 2013. He has since worked as a Ph.D. researcher for the Research Foundation Flanders at the Chemical Engineering Department of the VUB.
Ken Broeckhoven is associate professor in the Department of Chemical Engineering at the Vrije Universiteit Brussel, Belgium.
Gert Desmet is a Full Professor in biochemical and chemical engineering at the Vrije Universiteit Brussel, Brussels, Belgium. His research focuses on the miniaturization of separation methods and on the investigation of flow and mass transfer effects in chromatographic systems.

New Study Reviews Chromatography Methods for Flavonoid Analysis
April 21st 2025Flavonoids are widely used metabolites that carry out various functions in different industries, such as food and cosmetics. Detecting, separating, and quantifying them in fruit species can be a complicated process.
University of Rouen-Normandy Scientists Explore Eco-Friendly Sampling Approach for GC-HRMS
April 17th 2025Root exudates—substances secreted by living plant roots—are challenging to sample, as they are typically extracted using artificial devices and can vary widely in both quantity and composition across plant species.
Sorbonne Researchers Develop Miniaturized GC Detector for VOC Analysis
April 16th 2025A team of scientists from the Paris university developed and optimized MAVERIC, a miniaturized and autonomous gas chromatography (GC) system coupled to a nano-gravimetric detector (NGD) based on a NEMS (nano-electromechanical-system) resonator.

