Combining Different Stationary-Phase Chemistries to Improve the Selectivity of Impurity Profiling Methods
To improve the selectivity of challenging separations, a possible solution is the modulation of the stationary phase through serial coupling of different columns having different chemistries. Such an approach is interesting when each column used for a tandem setup results in distinct critical peak pairs. For impurity profiling methods, gradient elution mode is preferred. However, in gradient mode, the order of the coupled columns may result in different selectivities. In addition, the length of the individual columns may also impact the separation quality. The aim of this work was to study the possibilities of serial column coupling for impurity profiling methods. Various C8, C18, cyano, and phenyl phases were tested and compared. An algorithm was used to investigate peak migration through tandem columns, considering both the length and order of the individual column segments. As an example, amlodipine impurity profiling was considered to illustrate the benefit of serial column coupling. We also draw attention to the fact that common column tests are not always helpful because they do not declare anything about the compounds of our interest. Oftentimes, it is more informative and less time-consuming to run one or a few linear gradient experiments by injecting the sample of interest.
The idea of coupling columns to separate complex mixtures appeared early in the study of chromatography (1–5). In general, the purpose of column coupling can be either to improve the kinetic performance of a separation by increasing the column length, or to adjust selectivity by combining different stationary-phase chemistries. In unidimensional chromatography, there are two ways to combine two or more columns, namely parallel and serial arrangements (6).
The serially coupled columns (SCC) approach is often referred to as stationary phase optimized selectivity liquid chromatography (SOSLC), or discontinuous stationary phase gradient (4,7,8). The serial column coupling approach has been commercialized under the name of phase optimized liquid chromatography (POPLC), which was provided by Bischoff Chromatography. Studies have reported improved selectivity for coupled columns compared to the use of a single column (9–12). Coupled systems have an intrinsic advantage—there is an additional separation factor (the column length) that has no consequence in the experimental effort. In practice, each serial combination of columns of different chemical natures and lengths operates as a new column with its own selectivity. This significantly increases the wealth of various columns available in a laboratory, from which the most appropriate ones can be selected for a given application in a tandem setup (6).
A few approaches have been proposed to optimize SCC systems (13,14). An important difference compared to mobile phase optimization is that stationary phase is a discrete factor and cannot be varied arbitrarily. Those works demonstrated that serial coupling of columns introduce new degrees of freedom, such as the type, number, relative length, and the order of the individual columns (4,15). However, the full benefit of SCCs is only taken through the interpretive optimization of both the columns’ nature and length, along with the elution conditions (1,2,4,16,17). The SCC approach is mostly applied in isocratic elution mode; however, linear gradient optimizations using different algorithms have already been reported (4,11,14,18–20).
The pharmaceutical industry is one of the main users of liquid chromatography (LC). Gradient elution must be used in most cases when examining the impurity profile or degradation pathways of active pharmaceutical ingredients (API). International Council for Harmonization (ICH) Q3A (R2) provides guidance on the content and qualification of impurities in new drug substances (21). Baseline separation of adjacent peaks is often required; thus, routine methods are expected to achieve a critical resolution value (Rs) of at least 1.5, which is sometimes challenging (22). Therefore, combining two or more columns possessing different selectivities might improve the chance to attain baseline separation for a complex sample.
As mentioned above, a coupled system of columns having different chemistries works as a new column. Therefore, one possibility for method development is to optimize a separation on one given coupled setup. However, in this situation, the contribution of the individual columns to the overall apparent retention will remain unknown. Instead, a better approach is to measure the retention parameters of the different individual column chemistries, and then the overall retention of a solute and expected selectivity can be predicted for any column combination (different lengths or orders).
The aim of this work was to study and compare the selectivities of state-of-the-art reversed-phase (RP) columns of various chemistries (C8, C18, cyano, and phenyl) and to find the most appropriate column combinations for challenging separations. A common column test (that is, Tanaka) was performed first to characterize the individual columns. Then, the most diverse phases were selected. Based on linear input gradient experiments, retention model parameters were derived for amlodipine impurity profiling, and then model calculations were done to find the most promising coupled systems. Finally, the proposed column combinations were experimentally tested, and the impact of the order of coupled columns was also studied.
Experimental and Methodology
Chemicals, Samples, and Columns
For column characterization, the general test proposed by Tanaka and coworkers was performed. Based on this test, seven selected substances were used to characterize hydrophobicity, hydrophobic selectivity, steric selectivity, silanol activity, and ion-exchange capacities (at low and high pH) of the stationary phases (23). The test compounds were uracil, pentylbenzene, butylbenzene, o-terphenyl, triphenylene, caffeine, phenol, and benzylamine (0.1 mg/mL).
As a real-life separation example, the tested substance was a spiked sample of amlodipine. The sample contained 1 mg/mL amlodipine and all of its impurities at a level of 1–2% (10–20 μg/mL).
Various column chemistries were tested, namely Acquity HSS fully porous (FP) 2.5 μm C18, C18 SB, T3, fluorophenyl, cyano, and Kinetex superficially porous (SP) 2.6 μm C8, C18, phenyl-hexyl, biphenyl, and F5 phases. Column diameter was 2.1 mm for all columns, and the length was either 3 or 5 cm.
Chromatographic System
The instrument used in this study was a UHPLC system with a binary delivery pump. The gradient delay volume (VD) was measured as 0.1 mL and the extra column volume (Vec) was ~11 μL. The system contained 500 nL photo-diode-array (PDA) flow cell. The volume of the column connector unit was 0.8 μL.
Chromatographic Conditions and Column Tests
For the Tanaka test, the mobile phase compositions were adopted from the protocol (23), the column temperature was 25 °C, the flow rate was set to 0.4 mL/min, and the injected volume was 0.1 μL.
For the application example (amlodipine impurity profiling), the mobile phase A contained 0.1% v/v perchloric acid solution, and mobile phase B was acetonitrile. With such acidic mobile phases, the residual silanol groups of silica-based columns were expected to be in ion-suppressed form. Therefore, no electrostatic interaction is expected with basic solutes. The flow rate was 0.4 mL/min, and the detection wavelength was 237 nm. The injection volume was 0.5 μL.
Measuring Model Parameters for Amlodipine and Related Impurities
Based on the results of the Tanaka tests, four columns were selected for the application example (FP 2.5 μm C18, cyano and SP 2.6 μm C18, biphenyl). Various linear gradients (with different gradient steepness) were performed by injecting the spiked amlodipine sample. Then, a procedure based on fitting was applied to obtain the model parameters (24–26).
Studying Solute Migration Through Coupled Columns
During the work, a linear solvent gradient was assumed. The amount of organic solvent in the mobile phase (φ) at time t at any point along the column (z) can be described by the following relation:

where φ0 is the initial organic solvent content of the eluent; β is the mobile phase gradient slope; and ts is the time spent adsorbed on the surface of the stationary phase.
The migration velocity (u) of a band in the chromatographic column as a function of the variable ts can be expressed by the following expression:

where k(ts) is the retention factor of a solute as a function of ts stationary phase time, and u0 the linear velocity of the mobile phase.
A simple finite difference algorithm was used to solve equation [2] and to determine the distance traveled by a solute through a coupled system. Very briefly, for a serial system, one can divide the time elapsed during the development of a mobile phase gradient into very short Δts time intervals. Then, the mobile phase volume fraction at nth time interval can be written as:

where Δφ describes the change of mobile phase volume fraction in a Δts time interval. Assuming the linear solvent strength (LSS) model, the retention factor (k) of solute j on the column i at the nth time interval—in general—can be expressed as:

where k0 and S are the model parameters. Then, the migration velocity of solute j on the column i at the nth time interval (un(ij)) can be calculated by equation [2].
One can consider a gradient as a sequence of small isocratic steps. This allows the determination of the intermediate migrated distance through a column at each time interval during the analysis. If a solute band passes the end of a column, then the algorithm takes the model parameters of the next column, and so on. Then, the actual distance traveled, Dn(ij), by solute j on the column i at the nth time interval can be calculated as:

For the first time interval, the distance is simply calculated as:

Because the solute molecules travel only in the mobile phase, the total time spent in the mobile phase corresponding to the nth time interval can be calculated as:

Accordingly, the total time elapsed during the travel of a band to position Dn(ij) is:

Based on these calculations, migration plots (distance traveled by the solute vs time elapsed) were constructed to study the elution behavior of various solutes on different coupled systems.
Results and Discussion
General Considerations
In isocratic elution mode, the order of coupled columns does not play a role in the overall selectivity. However, when running gradients on serially coupled systems, one might have the impression that the less retaining column should be placed first and followed by the more retaining column to benefit the most from the selectivity of both columns. Otherwise (that is, the more retentive column is followed by the less retentive one), the less retentive second column will experience a stronger mobile phase. As a result, the residence time of the solutes will be much shorter on the second column. In extreme cases, it may happen that the compounds will not be retained on the second column at all.
Despite the intuition and general concept that for gradient separations, the order of the columns should follow the order of their retentivity. Here, we illustrated that such column order does not necessarily result in the highest selectivity and resolution for a complex mixture.
General Column Tests to Compare Different Chemistries
Column tests based on a specific set of known compounds are often performed in the pharmaceutical industry. The test compounds are ideally selected to quantify one specific interaction occurring between the solute and the stationary phase. Those tests can be a good starting point of a column screening procedure. Please note that several column databases are also publicly available (27,28).
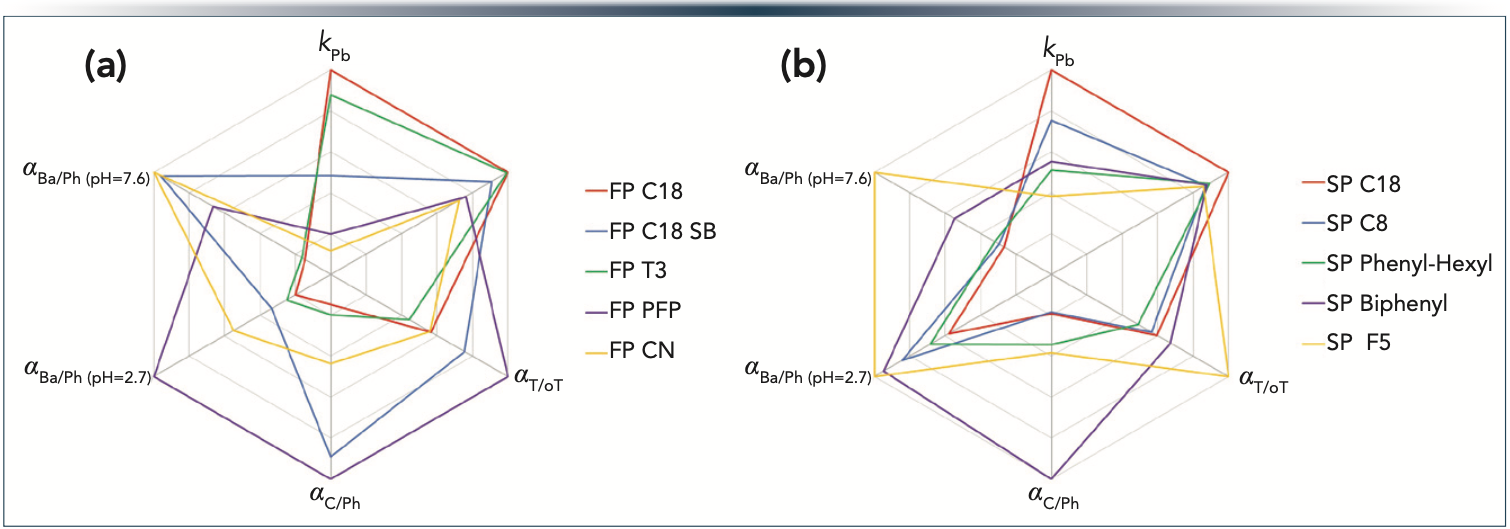
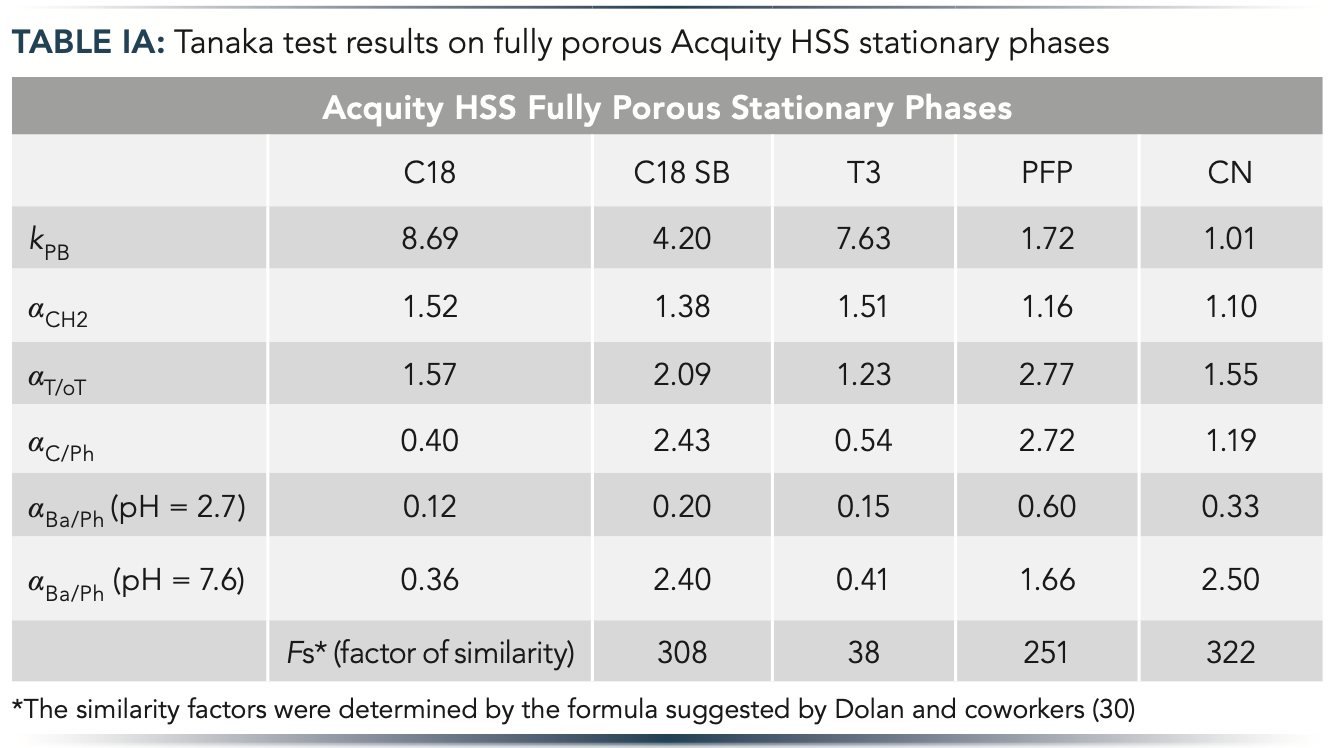
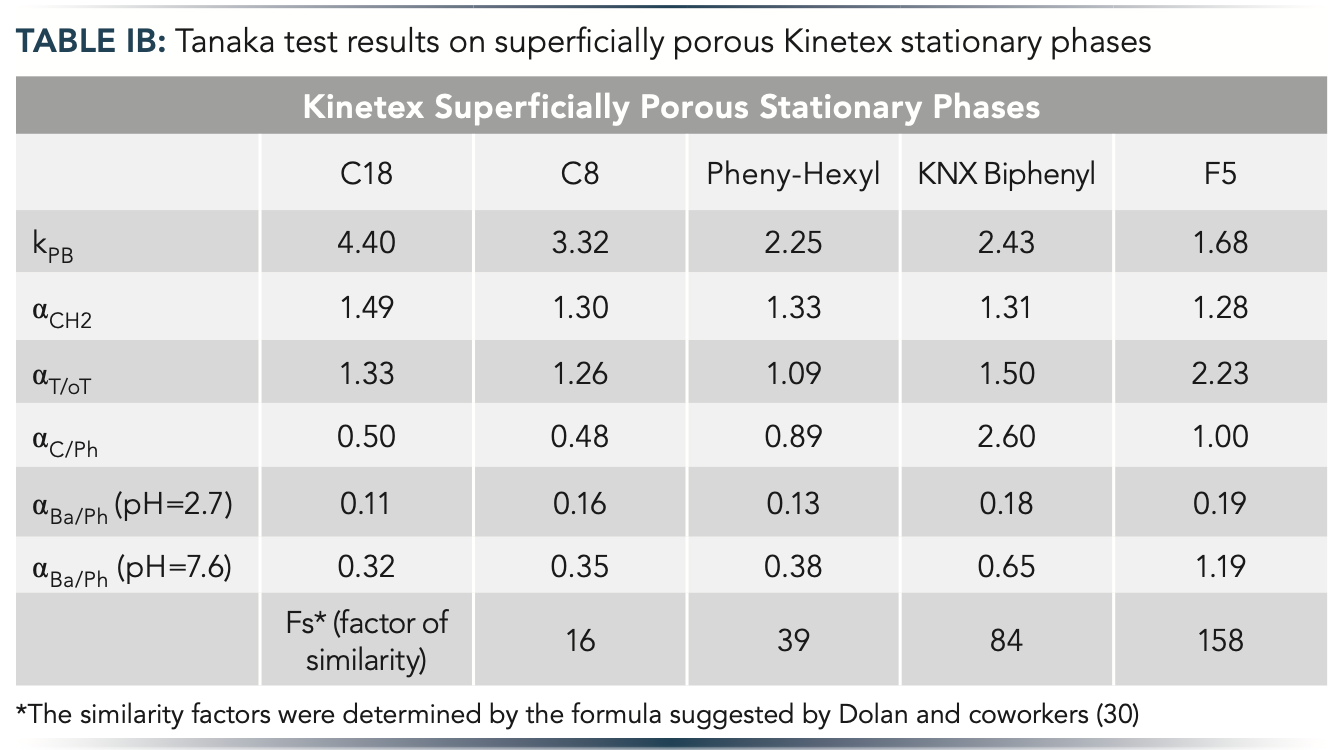
In this work, we applied the Tanaka test, which is established as the most popular standard for evaluating the selectivity of different HPLC columns (29). The parameters measured for the 10 columns were illustrated as hexagons with six axes corresponding to different physico-chemical properties. Figure 1 shows the obtained selectivity plots, and Table I summarizes the results of the Tanaka test. The more diverse the shape of the two hexagons, the more different the selectivity. FP and SP column families were examined, corresponding to significant differences between their morphology. For the serial column setup, our goal was to select two diverse FP and two diverse SP phases. Among the FP columns, the C18 and cyano phases showed the highest difference (based on similarity factor, Fs). The cyano phase showed very different hydrophobicity (kPB), hydrogen bonding capacity (αC/Ph), and total ion-exchange capacity (αBa/Ph (pH = 7.6)) compared to the C18 phase. Among the SP phases, the C18 and biphenyl ones were selected as the most distinct columns considering the Fs values and the specific conditions applied for the application (amlodipine impurity profiling).
Figure 1: Tanaka test results for (a) fully porous and (b) superficially porous stationary phases with different selectivities represented as hexagons. Symbols: kPB – hydrophobicity, αCH2 – hydrophobic selectivity, αT/oT – shape selectivity, αC/Ph – hydrogen bonding capacity, αBa/Ph (pH = 2.7) – acidic ion-exchange capacity and αBa/Ph (pH = 7.6) – total ion-exchange capacity.
In silico Preliminary Work to Study Serially Coupled Columns (Amlodipine Impurity Profiling)
Scouting gradients were performed to find suitable initial and final gradient composition to elute all amlodipine related compounds in a reasonable elution window from all columns. Retention model parameters were determined for each compound on all of the four selected columns (FP C18, FP cyano, SP C18, and SP biphenyl). The apparent retention and migration plots were then calculated for various column combinations and gradient programs.
Among all solutes, compound “Imp-G” showed the most significant retention changes at different coupled setups. And indeed, Imp-G was always one member of the critical peak pairs, regardless of the column combination. Figure 2 shows some representative examples of Imp-G peak migration for different column configurations. Two column orders were assumed (A to B and B to A). Figure 2a shows that the FP C18 phase is much more retentive than a FP cyano one. Despite this huge difference, when combining identical column lengths, it seemed that column order did not change the overall retention (the blue and red curves just intersect at the sum of individual column lengths—10 cm). On the other hand, the SP C18 and biphenyl phases were more similar in terms of retentivity, but when combining 3 and 5 cm segments, the overall retention was slightly different depending on the order of coupled columns (Figures 2b and 2c). A 1–2% difference was observed in the overall retention time based on the column order. (In Figure 2b, the blue and red curves do not intersect, whereas in Figure 2c, the two curves intersect before reaching the end of the second column [7.6 cm compared to 8 cm]).
Figure 2: Migration plots of Imp-G. Panel (a): FP 2.5 μm 50 x 2.1 mm C18 and FP 2.5 μm 50 x 2.1 mm cyano columns, gradient 30–70% B in 12 min at F = 0.4 mL/min. Panel (b): SP 2.6 μm 50 x 2.1 mm biphenyl and SP 2.6 μm 30 x 2.1 mm C18 columns, gradient 30–70% B in 6 min at F = 0.4 mL/min. Panel (c): SP 2.6 μm 50 x 2.1 mm C18 and SP 2.6 μm 30 x 2.1 mm biphenyl columns, gradient 30–72% B in 7 min at F = 0.4 mL/min.

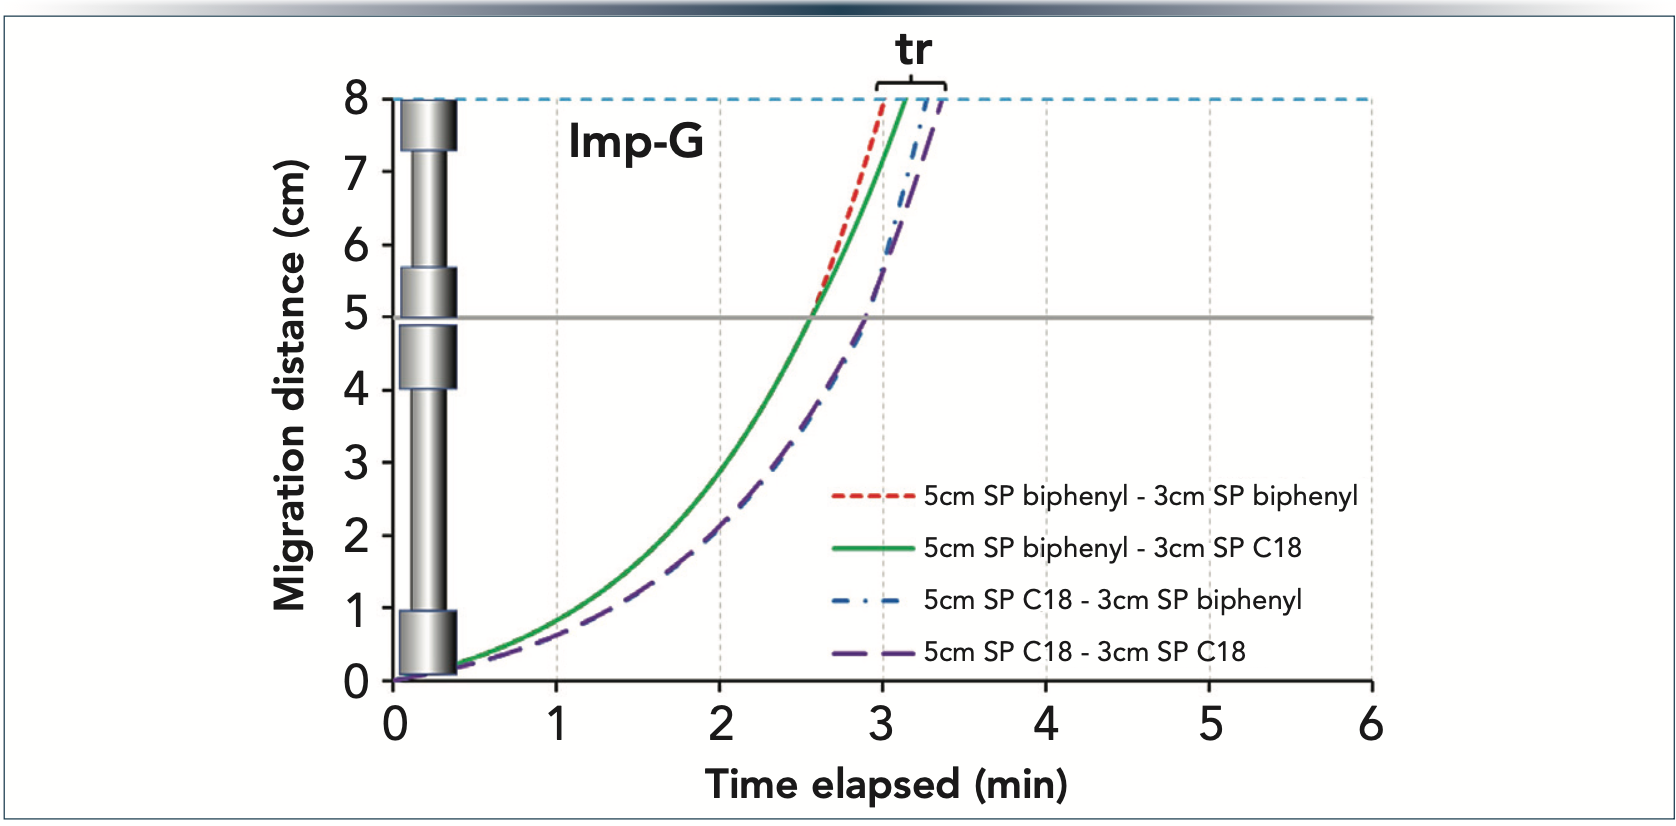
Figure 3 illustrates the real benefit of column coupling. When combining 5 cm and 3-cm long columns (made of SP C18, SP biphenyl, or both), the retention of Imp-G can be fine-tuned as desired. The 8-cm SP biphenyl setup resulted in the lowest retention (tR = 3.14 min), followed by the combination of SP biphenyl 5 cm and SP C18 3 cm (tR = 3.21 min). Because the SP C18 phase is more retentive than the SP biphenyl, the highest retention was obtained with a 8-cm SP C18 setup (tR = 3.42 min), whereas a combination of SP C18 5 cm and SP biphenyl 3 cm yielded slightly decreased retention (tR= 3.37 min).
Figure 3: Migration plots of Imp-G when coupling 5-cm and 3-cm long columns packed with SP C18 and SP biphenyl phases. Gradient 30–70%B in 6 min at F = 0.4 mL/min.
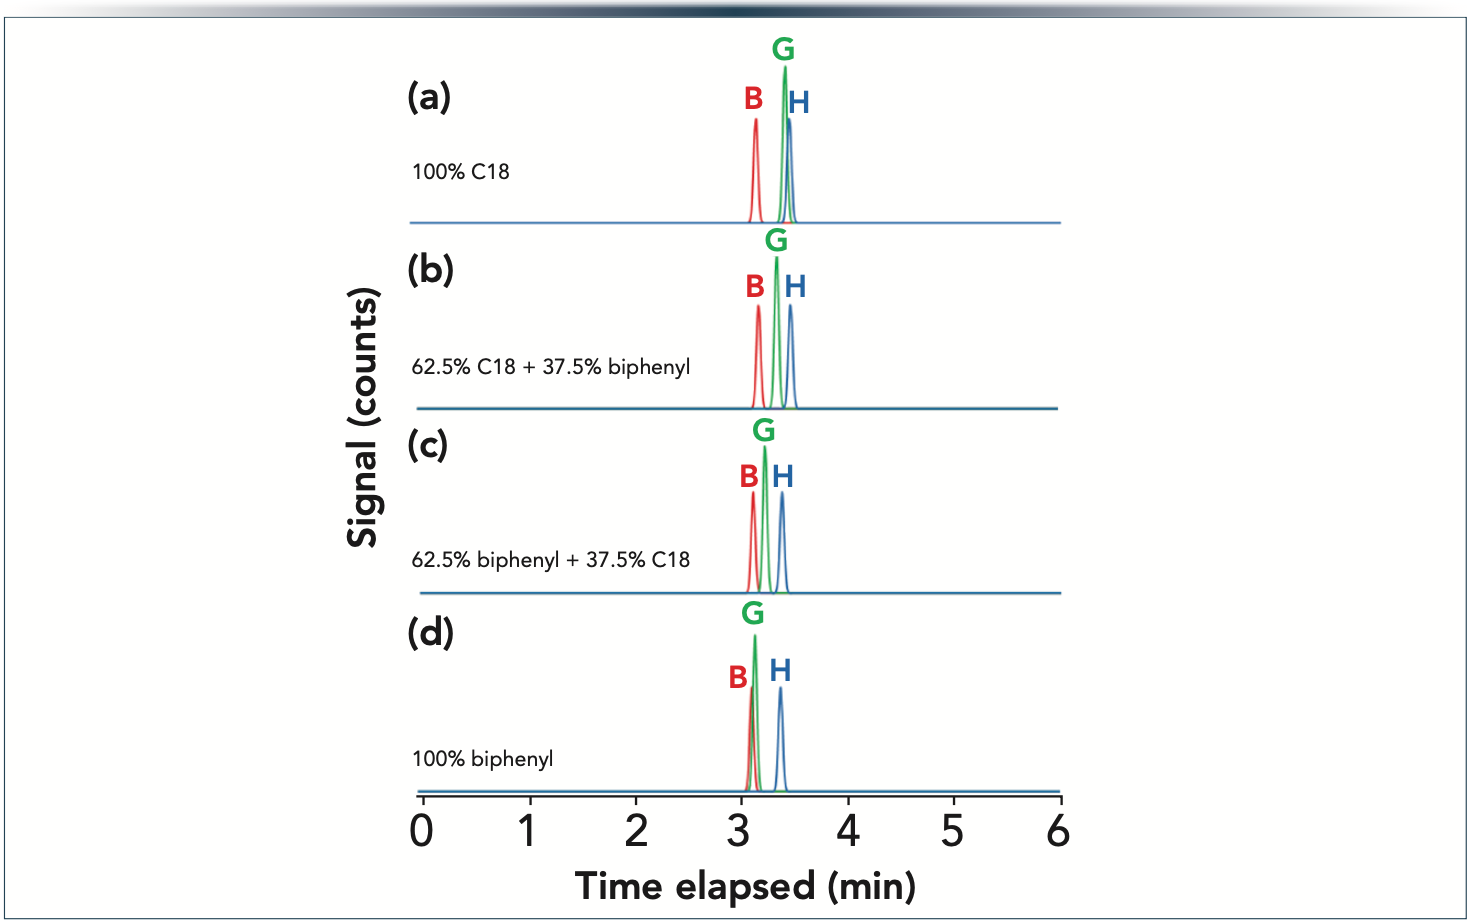
In the amlodipine mixture that used SP columns on SP C18 phase, the critical peak pair was ImpG-Imp-H, whereas the ImpB-ImpG peak pair were resolved well. On the contrary, for the SP biphenyl phase, ImpB-ImpG was the least resolved peak pair while ImpG-ImpH were baseline separated. One might have the impression that a good solution is probably to combine SP C18 and biphenyl phases to attain suitable resolution between both ImpB-ImpG and ImpG-ImpH pairs. Model calculations were performed to study the possibilities of combining SP C18 and SP biphenyl phases for such peak pairs. As shown in Figure 4, as the length fraction of the SP biphenyl phase increases (compared to SP C18) the critical pair is shifted from ImpG-ImpH towards ImpB-ImpG. Our model calculations suggested that both a 5 cm SP C18 and 3 cm SP biphenyl and a 5 cm SP biphenyl and 3 cm SP C18 combinations resulted in baseline resolution (Rs > 1.5).
Figure 4: Predicted chromatograms for Imp-B, Imp-G, and Imp-H (as being the critical peak pairs) when coupling 5 cm and 3 cm long columns packed with SP C18 and SP biphenyl phases. Gradient 30–70%B in 6 min at F = 0.4 mL/min. Columns: (a) 8 cm SP C18 (5 cm + 3cm),(b) 5 cm SPC 18 + 3 cm SP biphenyl, (c) 5 cm SP biphenyl + 3 cm SP C18, and (d) 8 cm SP biphenyl (5 cm + 3 cm). The system’s gradient delay time is considered.
Experimental Verification of Model Calculation: Applications of Serially Coupled Columns
To validate our prediction, the same conditions were set as stated in the caption of Figure 4. The experimentally observed chromatograms are shown in Figure 5 for all four column combinations. As suggested by our model, the resolutions between ImpB, ImpG, and ImpH were the most sensitive for the changes of the stationary phase chemistry. The experimental results were in excellent agreement with the predictions—as the length fraction of the biphenyl phase increased (from Figure 5a–d), the critical pair shifted from ImpG-ImpH toward ImpB-ImpG. The average error of retention time prediction was lower than 1.5%.
Figure 5: Predicted chromatograms for Imp-B, Imp-G, and Imp-H (as being the critical peak pairs) when coupling 5 cm and 3 cm long columns packed with SP C18 and SP biphenyl phases. Gradient 30 – 70%B in 6 min at F = 0.4 mL/min. Columns: (a) 8 cm SP C18 (5 cm + 3 cm),(b) 5 cm SP C18 + 3 cm SP biphenyl, (c) 5 cm SP biphenyl + 3 cm SP C18, and (d) 8 cm SP biphenyl (5 cm + 3 cm). The system’s gradient delay time is considered.
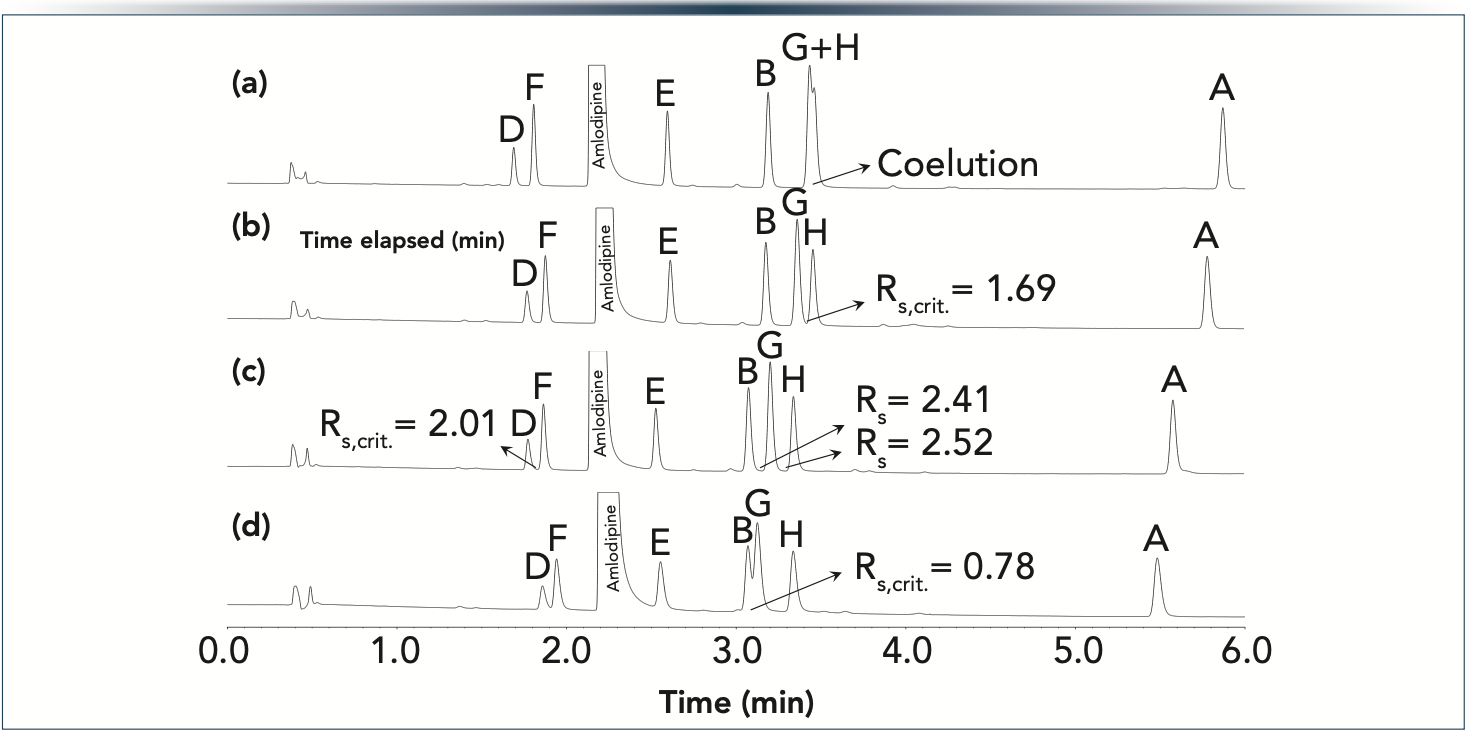
It also worth noting that the retention of ImpB, ImpG, ImpH, and ImpA was higher on the SP C18 phases compared to SP biphenyl. However, peaks ImpD and ImpF were more retained on the SP biphenyl phase. Therefore, for complex real-life samples, it is not always obvious to see which stationary phase is the more retentive one. Consequently, the common practice of placing the columns in the order of their increasing retentivity was not applicable in this case: both a SP C18 and SP biphenyl and a SP biphenyl and SP C18 combinations resulted in baseline separations.
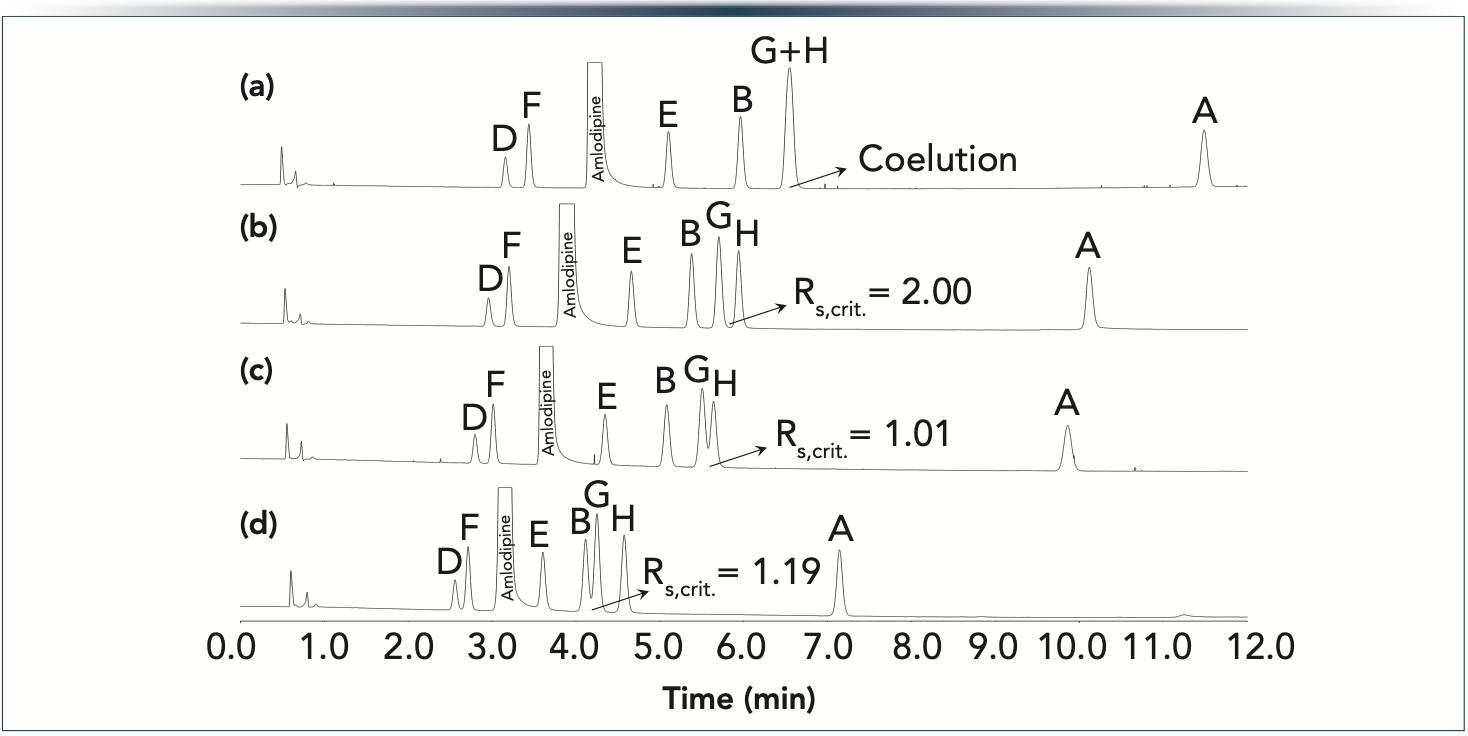
Similar behavior was observed when FP C18 and FP cyano phases were combined. Figure 6 shows the obtained chromatograms. Again, ImpB, ImpG, and ImpH showed the most significant peak movements and changes in selectivity. On the FP C18 phase, ImpG and ImpH completely coeluted, whereas on the FP cyano phase, ImpG and ImpH was well separated but this phase resulted in poor resolution between ImpB and ImpG. Thus, combining the two phases in a tandem setup seemed to be a logical choice and indeed resulted in the highest overall selectivity. Interestingly the critical resolution depended on the order of the C18-cyano setup. Placing the C18 phase at first position and followed by the cyano phase resulted in better overall separation compared to the reverse order. Again, it would have been difficult to forecast that placing the more retentive column as first segment and then the less retentive segment will result in the best overall separation quality. To predict this behavior, the model parameters of the individual columns need to be known. Then, it is possible to predict the overall separation to any column combination.
Figure 6: Experimentally observed chromatograms (spiked amlodipine sample) on tandem FP columns: (a) 10 cm FP C18 (5 cm + 5 cm), (b) 5 cm FP C18 + 5 cm FP cyano, (c) 5 cm FP cyano + 5 cm FP C18, and (d) 10 cm FP cyano (5 cm + 5 cm). Gradient 30–70%B in 12 min at F = 0.4 mL/min.
Conclusions
The purpose of this work was to show how column order can impact selectivity and resolution in gradient elution mode, and how to optimize column order and length of individual segments.
In reality, most solutes include not only one but various functional groups and thus interact with a stationary phase by multiple (mixed) mechanisms. Accordingly, common column tests dissociating unique/single interaction mechanisms are not essentially meaningful to select the most appropriate column for a complex mixture including various compounds with several functional groups.
In this work, we used column tests to explore the most diverse stationary phases. We proposed selecting only a few (2–4) distinct columns before performing some scouting gradients on the selected columns by injecting the sample (mixture) of our interest. With such initial gradients, retention model parameters can be derived that finally enables one to predict retention and selectivity for any tandem column setup considering the length and the order of the individual column segments.
This work illustrates the potential benefit of coupled column systems to fine tune selectivity and separation for complex mixtures such as impurity profiling. Serial column coupling can be an interesting alternative method when the required selectivity cannot be achieved via modulating the mobile phase or column temperature on a selected column.
Credit Authorship Contribution Statement
Róbert Kormány is credited with contributing to the development of the methodology, investigation, conceptualization, and review and editing of this manuscript. Krisztián Horváth is credited for review and editing the manuscript. Szabolcs Fekete is credited with the conceptualization and methodology, and also for writing the original draft.
Acknowledgment
The authors would like to thank Attila Gali (Waters) and Péter Imrik (Gen- Lab) for the columns. Special thanks to Lili Knyazoviczki for the Tanaka test measurements and the hexagon figures. Krisztián Horváth acknowledges the financial support of the Hungarian National Research, Development and Innovation Fund (NKFIH FK128350).
References
(1) Glajch, J. L.; Gluckman, J. C.; Charikofsky, J. G.; Minor, J. M.; Kirkland, J. J. Simultaneous Selectivity Optimization of Mobile and Stationary Phases in Reversed-Phased Liquid Chromatography for Isocratic Separations of Phenylthiohydantoin Amino Acid Derivatives. J. Chromatogr. A 1985, 318, 23–39. DOI: 10.1016/S0021-9673(01)90661-2
(2) Lukulay, P. H.; McGuffin, V. L. Solvent Modulation in Liquid Chromatography: Extension to Serially Coupled Columns. J. Chromatogr. A 1995, 691, 171–185. DOI: 10.1016/0021-9673(94)01184-G
(3) Garay, F. Application of a Flow-Tunable, Serially Coupled Gas Chromatographic Capillary Column System for the Analysis of Complex Mixtures. Chromatographia 2000, 51, 108–120. DOI: 10.1007/BF02492792
(4) Nyiredy, S.; Szűcs, Z.; Szepesy, L. Stationary Phase Optimized Selectivity Liquid Chromatography: Basic Possibilities of Serially Connected Columns Using the “PRISMA” Principle. J. Chromatogr. A 2007, 1157, 122–130. DOI: 10.1016/j.chroma.2007.04.041
(5) Alvarez-Segura, T.; Torres-Lapasió, J. R.; Ortiz-Bolsico, C.; García-Alvarez-Coque, M. C. Stationary Phase Modulation in Liquid Chromatography through the Serial Coupling of Columns: A Review. Anal. Chim. Acta 2016, 923, 1–23. DOI: 10.1016/j.aca.2016.03.040
(6) Alvarez-Segura, T.; Ortiz-Bolsico, C.; Torres-Lapasió, J. R.; García-Alvarez-Coque, M. C. Serial Versus Parallel Columns Using Isocratic Elution: A Comparison of Multi-Column Approaches in Mono-dimensional Liquid Chromatography. J. Chromatogr. A 2015, 1390, 95–102. DOI: 10.1016/j.chroma.2015.02.058
(7) Nyiredy, S.; Szűcs, Z.; Szepesy, L. Stationary-Phase Optimized Selectivity LC (SOS-LC): Separation Examples and Practical Aspects. Chromatographia 2006, 63, S3– S9. DOI: 10.1365/s10337-006-0833-7
(8) Codesido, S.; Rudaz, S.; Veuthey, J. L.; Guillarme, D.; Desmet, G.; Fekete, S. Impact of Particle Size Gradients on the Apparent Efficiency of Chromato- graphic Columns. J. Chromatogr. A 2019, 1603, 208–215. DOI: 10.1016/j.chroma.2019.06.048
(9) Bischoff Chromatography. Phase Optimized Liquid Chromatography – POPLC. https://bischoff365.com/POPLC_1 (accessed 2023-02-13).
(10) De Beer, M.; Lynen, F.; Chen, K.; Ferguson, P.; Hanna-Brown, M.; Sandra, P. Stationary-Phase Optimized Selectivity Liquid Chromatography: Development of a Linear Gradient Prediction Algorithm. Anal. Chem. 2010, 82, 1733–1743. DOI: 10.1021/ac902287v
(11) Chen, K.; Lynen, F.; De Beer, M.; Hitzel, L.; Ferguson, P.; Hanna-Brown, M.; Sandra, P. Selectivity Optimization in Green Chromatography by Gradient Stationary Phase Optimized Selectivity Liquid Chromatography. J. Chromatogr. A 2010, 1217, 7222–7230. DOI: 10.1016/j.chroma.2010.09.029
(12) Chen, K.; Lynen, F.; Szűcs, R.; Hanna-Brown, M.; Sandra, P. Gradient Stationary Phase Optimized Selectivity Liquid Chromatography with Conventional Columns. Analyst 2013, 138, 2914–2923. DOI: 10.1039/C3AN36797E
(13) De Beer, M. Development of Gradient Stationary Phase Optimized Selectivity Approaches for Improved Method Development in High Performance Liquid Chromatography. Ph.D. Dissertation, University of Ghent, Belgium, 2015.
(14) Ortiz-Bolsico, C.; Torres-Lapasió, J. R.; Ruiz-Ángel, M. J.; García-Álvarez- Coque, M.C. Comparison of Two Serially Coupled Column Systems and Optimization Software in Isocratic Liquid Chromatography for Resolving Complex Mixtures. J. Chromatogr. A 2013, 1281, 94–105. DOI: 10.1016/j.chroma.2013.01.064
(15) Lu, J.; Ji, M.; Ludewig, R.; Scriba, G. K. E.; Chen, D. Y. Application of Phase Optimized Liquid Chromatography to Oligopeptide Separations. J. Pharm. Biomed. Anal. 2010, 51, 764–767. DOI: 10.1016/j.jpba.2009.09.036
(16) Issaq, H. J.; Gutierrez, J. Mixed Packings in High Performance Liquid Chromatography. II. Mixed Packings vs. Mixed Ligands. J. Liq. Chromatogr. 1988, 11, 2851–2861. DOI: 10.1080/01483918808076765
(17) Bischoff, K.; Nyiredy, S.; Szűcs, Z. Elements for Separating Substances by Distributing between a Stationary and a Mobile Phase, and Method for the Production of a Separating Device. German patent WO/2006/125564, 2006.
(18) De Beer, M.; Lynen, F.; Chen, K.; Ferguson, P.; Hanna-Brown, M.; Sandra, P. Stationary-Phase Optimized Selectivity Liquid Chromatography: Development of a Linear Gradient Prediction Algorithm. Anal. Chem. 2010, 82, 1733–1743. DOI: 10.1021/ac902287v
(19) Ortiz-Bolsico, C.; Torres-Lapasió, J. R.; García-Alvarez-Coque, M. C. Optimisation of Gradient Elution with Serially-Coupled Columns. Part I: Single Linear Gradients. J. Chromatogr. A 2014, 1350, 51–60. DOI: 10.1016/j.chroma.2014.05.017
(20) Ortiz-Bolsico, C.; Torres-Lapasió, J. R.; García-Alvarez-Coque, M. C. Optimisation of Gradient Elution with Serially-Coupled Columns Part II: Multi-linear Gradients. J. Chromatogr. A 2014, 1373, 51–60. DOI: 10.1016/j.chroma.2014.10.100
(21) International Council for Harmonization. ICH Q3A (R2), Impurities in New Drug Substances; 2006. https://database.ich.org/sites/default/files/Q3A%28R2%29%20Guideline.pdf (accessed 2023-02-13).
(22) Barth, H. G. Chromatography Fundamentals, Part VIII: The Meaning and Significance of Chromatographic Resolution. LCGC North Am. 2019, 37 (11), 824–828. https://www.chromatographyonline.com/view/chromatography-fundamentals-part-viii-meaning-and-significance-chromatographic-resolution (accessed 2023-02-13).
(23) Kimata, K.; Iwaguchi, K.; Onishi, S.; Jinno, K.; Eksteen, R.; Hosoya, K.; Araki, M.; Tanaka, N. Chromatographic Characterization of Silica C18 Packing Materials. Correlation Between a Preparation Method and Retention Behavior of Stationary Phase. J. Chromatogr. Sci. 1989, 27 (12), 721–728. DOI: 10.1093/chrom-sci/27.12.721
(24) Ford, J. C.; Ko, J. Comparison of Methods for Extracting Linear Solvent Strength Gradient Parameters from Gradient Chromatographic Data. J. Chromatogr. A 1996, 727, 1–11. DOI: 10.1016/0021-9673(95)01083-1
(25) Cusumano, A.; Guillarme, D.; Beck, A.; Fekete, S. Practical Method Development for the Separation of Monoclonal Antibodies and Antibody-Drug-Conjugate Species in Hydrophobic Interaction Chromatography, Part 2: Optimization of the Phase System. J. Pharm. Biomed. Anal. 2016, 121, 161–173. DOI: 10.1016/j.jpba.2016.01.037
(26) Fekete, S.; Yang, H.; Wyndham, K.; Lauber, M. Salt Gradient and Ion-Pair Mediated Anion Exchange of Intact Messenger Ribonucleic Acids. J. Chromatogr. Open 2022, 2, 100031. DOI: 10.1016/j.jcoa.2022.100031
(27) Chromatographic Columns | USP. https://www.usp.org/resources/chromatographic-columns (accessed 2023-02-13).
(28) HPLC Columns. www.hplccolumns.org (accessed 2023-02-13).
(29) Žuvela, P.; Skoczylas, M.; Liu, J. J.; Baçzek, T.; Kaliszan, R.; Wong, M. W.; Buszewski, B. Column Characterization and Selection Systems in Reversed-Phase High-Performance Liquid Chromatography. Chem. Rev. 2019, 119 (6), 3674–3729. DOI: 10.1021/acs.chemrev.8b00246
(30) Dolan, J. W.; Maule, A.; Bingley, D.; Wrisley, L. Chan, C. C.; Angod, M.; Lunte, C.; Krisko, R.; Winston, J. M.; Homeier, B. A.; McCalley, D. V.; Snyder, L. R. Choosing an Equivalent Replacement Column for a Reversed-Phase Liquid Chromatographic Assay Procedure. J. Chromatogr. A 2004, 1057, 59–74. DOI: 10.1016/j.chroma.2004.09.064
About the Authors
Róbert Kormány is with the Drug Sub- stance Analytical Development Division of Egis Pharmaceuticals Plc., in Budapest, Hungary. Krisztián Horváth is with the Department of Analytical Chemistry at University of Pannonia, in Veszprém, Hungary. Szabolcs Fekete is with Waters Corporation, in Geneva, Switzerland. Direct correspondence to: kormany.robert@egis.hu

Common Challenges in Nitrosamine Analysis: An LCGC International Peer Exchange
April 15th 2025A recent roundtable discussion featuring Aloka Srinivasan of Raaha, Mayank Bhanti of the United States Pharmacopeia (USP), and Amber Burch of Purisys discussed the challenges surrounding nitrosamine analysis in pharmaceuticals.
Extracting Estrogenic Hormones Using Rotating Disk and Modified Clays
April 14th 2025University of Caldas and University of Chile researchers extracted estrogenic hormones from wastewater samples using rotating disk sorption extraction. After extraction, the concentrated analytes were measured using liquid chromatography coupled with photodiode array detection (HPLC-PDA).


