Chromatography Data Systems: Perspectives, Principles, and Trends
LCGC North America
This technical overview of chromatography data systems (CDS) looks at how CDS are designed, how they can be used most effectively, and what developments we can expect in the future.
This installment is the last of a series of four articles on high-performance liquid chromatography (HPLC) modules, covering pumps, autosamplers, ultraviolet (UV) detectors, and chromatography data systems (CDS). It provides a technical overview of CDS design, historical perspectives, the current marketing landscape, instrument control, data processing practices, and future trends.
Robert P. Mazzarese, Steven M. Bird, Peter J. Zipfell, and Michael W. Dong
Chromatographic analysis, including high-performance liquid chromatography (HPLC), gas chromatography (GC), ion chromatography (IC), supercritical fluid chromatography (SFC), and capillary electrophoresis (CE), constitutes a major portion of testing performed in analytical laboratories. All of these instruments have one thing in common: They all require the use of a chromatography data system (CDS), which plays a pivotal role in instrument control, data processing, report generation, and data archiving.
In laboratories performing regulated testing for quality control, pharmaceutical development, or manufacturing, the CDS is likely a validated client-server network designed to provide data security and integrity. Our observations indicate that laboratory scientists in regulated laboratories tend to spend as much time performing data processing as in front of a chromatographic system. Thus, to have a better understanding of improved analytical practices, it is critical to have an in-depth knowledge of the role of a CDS in both instrument control and data processing.
A modern CDS is a complex software system that is used in many rapidly changing analytical science fields to control instruments, gather and process data, and generate reports. A literature search revealed surprisingly few overviews of CDS and related topics in textbooks (1–2), book chapters (3–6), and journal articles (7–8). Nevertheless, detailed information is available from manufacturers on specific CDS, and can be found in websites, brochures, and manuals (9–12).
In this installment, we strive to provide a general overview of CDS and its pivotal role in the analytical workflow, focusing on client-server networks. We review historical developments of CDS, and describe the operating principles on instrument control and data processing (data acquisition, peak integration and identification, calibration, and report generation), as well as the current marketing landscape, and modern trends.
Glossary of Key Terms and Acronyms Key Terms
- 21 CFR Part 11: The Code of Federal Regulations that defines the criteria under which electronic records and signatures are considered trustworthy, reliable, and equivalent to paper records.
- A/D Converter: An analog-to-digital converter that takes the analog voltage from a detector and converts it into a digital signal.
- Algorithm: A process or set of rules to be followed in calculations or other problem-solving operations, typically performed by a computer.
- Analytics: Systematic analysis of data using metrics and statistics.
- Audit Trail: A historical record or set of records that enable data and their associated events to be accurately reconstructed.
- Business Continuity: The process of creating systems of prevention and recovery to deal with potential threats to a company. In addition to prevention, the goal is to permit ongoing operation before and during the execution of disaster recovery.
- Calibration: A process for the quantitation of analytes in a sample by comparing peak areas of identified analytes with those from reference solutions with known concentrations.
- CDS: A chromatography data system, which is used to acquire, integrate, quantitate, and report data produced by a chromatography instrument.
- Citrix: A program that allows a client personal computer (PC) to access a server-based “virtualized” instance of the client software remotely and securely, thus avoiding a local installation of the software.
- Client-Server Network: A client-server network is designed for end-users, called clients, to access resources such as files and programs from a central computer called a server. A server’s purpose is to serve as a central repository of computing programs and data archival. The server can be located on-site, off-site, or in the cloud.
- Cloud Computing: The practice of using a network of remote servers hosted on the internet to store, manage, and process data, rather than using a local server or a personal computer.
- Cloud Storage: In cloud storage, data are maintained, managed, backed up remotely, and made available to users over a network, typically via the internet.
- Disaster Recovery: A set of policies, tools, and procedures to enable the recovery or continuation of vital technology infrastructure and systems following a natural or human-induced disaster.
- Instrument control: A key function of a CDS is instrument control where all the parameters of each module (such as an HPLC: pump, autosampler, column compartment, and detectors) are controlled from a single instrumental method in the CDS.
- Integration: A process that uses a mathematical algorithm to transform raw data from a detector into processed data consisting of peak retention times and peak areas. Integration algorithms are classified as “traditional,” using slope thresholds or second derivatization of the raw data.
- Metadata: A set of data that describes and gives information about other data, including raw data, sample data, or analyst data. For a CDS, metadata are all of the associated data describing the raw data and their calculated results, such as instrument conditions, errors generated, integration and calibration parameters, user information, review, and approval.
- Metrics: Measurements to help evaluate performance or progress.
- Raw Data: Chromatographically derived digital data obtained from the chromatographic detector acquired by the CDS before any data processing or transformation. For regulatory testing, the raw data cannot be deleted or altered.
- Relational Database: A collection of data items that have predefined relationships, which are organized as a set of tables with columns and rows.
- Report: A visual arrangement of information about a sample and the associated results that is typically generated at the end of data processing by the CDS, either automatically or by manual processing of data from a sample sequence. In most cases, reports contain information such as the amount or concentration of each identified peak, sample information, a chromatogram, and a spectrum. A summary report contains reported data from a set of samples and may contain statistical evaluation data such as peak area precision. A report can also contain details about whether the system suitability, assay, and sample acceptance criteria are met or not. Information reported is dependent on assay type and organizational requirements.
- The Quality Unit, QA, QC: A quality unit reporting to the head of a production or development facility is mandated in good manufacturing practice (GMP) regulations. Quality Assurance (QA) is responsible for the overall Quality System and equipment qualification. Quality Control (QC) is the laboratory branch responsible for the actual analytical testing.
Acronyms
- IaaS: Infrastructure as a service
- PaaS: Platform as a service
- SaaS: Software as a service. (IaaS, Paas, and Saas are types of cloud computing setups that replace varying degrees of on-premise computing.)
- CE: Capillary electrophoresis
- CoA: Certificate of analysis
- DAD: Diode array detector
- ELN: Electronic laboratory notebook
- GLP: Good laboratory practice (21 CFR Part 58)
- GMP: Good manufacturing practice (21 CFR Part 211
- HRMS: High-resolution mass spectrometry
- IC: Ion chromatography
- LIMS: Laboratory information management system
- LMS: Laboratory Management System
- LoTF: Laboratory of the future
- MS: Mass spectrometry
- SDMS: Scientific data management solutions
- SFC: Supercritical fluid chromatography
- SQMS: Single-quadrupole MS
- SST: System suitability testing.
- TQMS: Triple-quadrupole mass spectrometry.
Requirements and Desirable Characteristics of an Enterprise CDS
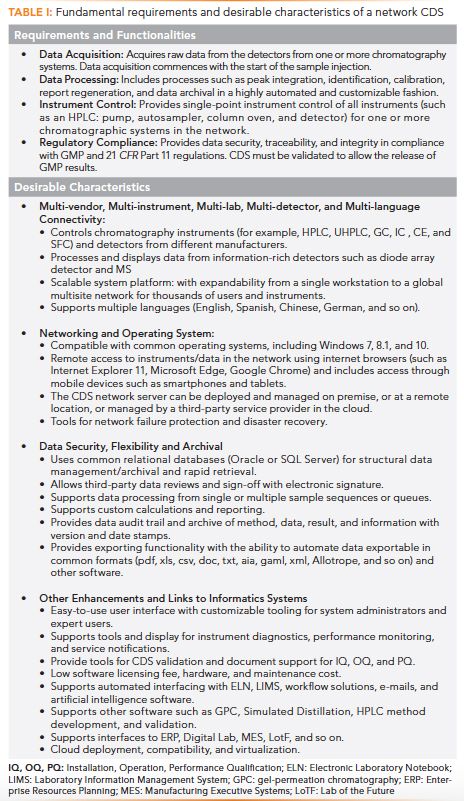
Table I summarizes the requirements and desirable characteristics of a modern CDS network for regulated laboratories. These requirements and the operating principles are further discussed in later sections. Our goal is to increase the understanding of the fundamentals of CDS by the laboratory scientist, thus leading to more efficient laboratory practices.
A Historical Perspective
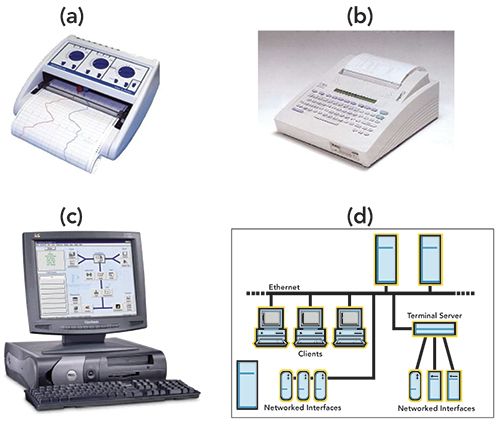
Let us start with a brief historical review of the evolution of CDS. Figure 1 shows four devices for chromatography data handling since the 1970s.
Figure 1: Four images illustrating the key evolution of CDS from (a) strip chart recorder, (b) electronic integrator, and (c) PC workstation to (d) client-server network.
Strip Chart Recorders
A strip chart recorder plotted analog signals from chromatography detector(s) (in volts or millivolts) on a long roll of moving chart paper to generate chromatograms of detector response versus time. Chart recorders were the primary data handling devices for early chromatographs in the 1960s and 1970s. Quantitation was estimated using manual measurements of peak heights or peak areas using a “cut-and-weigh” of the peak area or via a triangulation calculation approach (peak height times peak-width-at-half-height). Today, these recorders are rarely used, except in preparative chromatography (3).
Electronic Integrators
The age of the “electronic revolution” heralded in the electronic integrator for chromatography (with Hewlett-Packard’s HP-3380A in the mid-1970s, and Shimadzu’s C-R1A in the early 1980s). These were capable recorders with thermal paper printers and built-in A/D converters, LCD, internal storage memory, and firmware for automated peak integration, calibration, quantitation, and report generation. Some offered calculations for system suitability testing (SST) parameters and provided BASIC programming for customization. These were relatively inexpensive devices that were light years ahead of the simple chart recorders at the time.
Their use was short-lived, as they were quickly supplanted with the advent of the personal computer (PC) in the 1980s, which offered greater flexibility and infinite possibilities in data handling and instrument control. Nevertheless, a few models still linger on today, such as the Shimadzu C-R8A Chromatopac Data Processor, because of its low cost and easy operation for small laboratories.
PC Workstations
In the 1980s, analytical instrument manufacturers began adopting microprocessor technologies in the design of all analytical instruments, which led quickly to the use of the PC workstation as the preferred controller and data handling device.
One of the most successful PC-based workstations for chromatography was launched by Nelson Analytical in Cupertino, California, in the early 1980s, followed by a highly successful CDS network called TurboChrom. The early adoption of the Windows operating system was an important part of the success of TurboChrom. Nelson Analytical was acquired by PerkinElmer in 1989, and TurboChrom continued to dominate the early client-server based CDS market for many years until strong competitors debuted in the mid-1990s (6,13).
Network and Client-Server CDS
The first commercial chromatography network CDS was likely the HP-3300 data acquisition system launched in the late 1970s by Hewlett-Packard, and installed in many large chemical and pharmaceutical laboratories. It was a mini-computer−based system capable of acquiring data from up to 60 chromatographs through A/D converters (4).
The Windows-based PC-workstations and client-server CDS networks became dominant in the 1990s for small and large laboratories, due to their versatility, convenience, and the ability to provide compliance to 21 CFR Part 11 regulations (4,13–14).
In the client-server model, adding a PC as a client to the network increases the processing power of the overall system (4,7). The client typically provides the graphical user interface, instrument control, temporary data storage, and some of the data processing in a distributive computing system. The server maintains the databases and manages data transactions with the clients. A critical responsibility of the server is to have central control of the applications as well as to safeguard data integrity and security. The client/server model has several major advantages such as a highly scalable system design (for small laboratories to global multisite installations), a reduction in issues related to system maintenance, easier sharing of data and methods for all users, and the ability to support remote access using web browsers on PCs or mobile devices (tablets and smartphones) (4, 7)
Current Marketing Landscape for CDS
The current market size for HPLC has been estimated to be at approximately 5 billion USD, with four major manufacturers, Waters, Agilent, Thermo Fisher Scientific, and Shimadzu, consistently responsible for >80% of the global HPLC market in recent years (15–16). The market size of CDS, according to a survey by Top-Down Analytics, is estimated at approximately $700 million USD (17), with $425 million USD for HPLC and $275 million USD for GC. The top three providers are Waters, Thermo Fisher Scientific, and Agilent.
Waters has held a prominent CDS position since its first introduction of Millennium software on an Intel-486 microprocessor PC with an Oracle database in 1992. With continual improvements to its current Empower CDS (current version 3), Waters has attained wide acceptance from regulators, while establishing a very strong position within the pharmaceutical industry.
Thermo Fisher Scientific has become one of the leading CDS providers with its Chromeleon software platform (launched in 1996), which brings extensive compliance coverage and global networking capabilities that now include control, data acquisition, and data processing for high-resolution MS instruments. Known for its multi-vendor instrument control, Thermo Scientific Chromeleon CDS provides control for chromatography and single-quadrupole MS, triple-quadrupole MS, and HRMS instruments, leading to its popularity in both routine and development labs.
Agilent’s HPLC instruments are popular in research laboratories where scientists embrace its ChemStation CDS with an easy-to-use instrument control interface. The most recent revamped version of Agilent’s OpenLab CDS (version 2.4) has advanced data processing and regulatory compliance capabilities that enhance its competitiveness in QC laboratories. Agilent still offers the OpenLab ChemStation edition for specialty applications such as 2D-LC.
Shimadzu HPLC and GC instruments have a strong presence in the food, environmental, pharmaceutical quality control, and industrial markets, and the company offers LabSolutions, a network CDS, for their GC, HPLC, and secondary ion MS systems.
The rest of the CDS market belongs to manufacturers that cater to smaller installations or controllers and data devices for their own brands of chromatography or purification instruments. Examples of these are Clarity (DataApex), Chromperfect (Justice Lab Systems), CompassCDS (Scion Instruments), PeakSimple (SRI Instruments), ChromNAV 2.0 (Jasco), and Chromera/TotalChrom (PerkinElmer).
CDS have continued to improve in capability, reliability, and ease of use over the past three decades through advances in software, computers, and network implementations. Current features and desirable characteristics of modern network CDS are listed in Table I. With rapidly evolving technologies and a diversity of product features catering to different market segments and instrumentation, it is challenging to give accurate general statements or descriptions of CDS. The reader is therefore referred to the manufacturers’ websites and brochures for more technical details on specific systems.
Next, we focus on the role of CDS in the analytical workflow and review the principles of instrument control, data acquisition, peak integration, and data processing, with illustrations from specific CDS for UV and MS instruments.
Chromatography Analysisin a Regulated Environment:
The Role of CDS
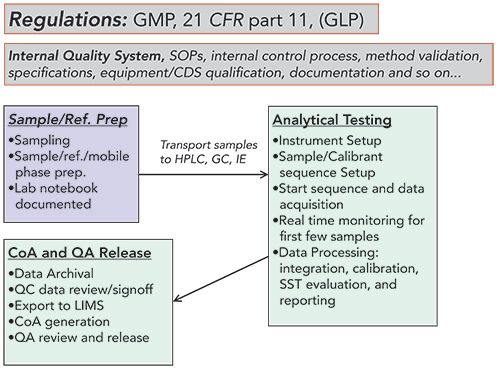
Today, performing regulated HPLC release testing of a pharmaceutical sample requires considerable resource allocation for regulatory compliance in the laboratory. Equipment validation, personnel training, and method validation take a significant amount of time and energy. Also, the laboratory must adhere to internal quality systems and processes, and standard operating procedures (SOPs), as listed in the analytical workflow example in Figure 2 (3). The role of the CDS during the analytical testing steps is summarized in a case study on a specific CDS implementation (Figure 3) (4).
Figure 2: The many steps of a chromatographic analysis workflow in a regulated laboratory. Today, it can be a complex process because it must comply with various regulations and internal quality systems and SOPs shown inside the upper rectangles. The actual analytical workflow starts from sampling, and sample/reference/mobile phase preparation before transporting the samples for analytical testing; which is comprised of instrument and sample sequence set up, data acquisition, result calculation, and report generation. Finally, the data is reviewed by the QC manager and signed-off, exported to LIMS, and merged with other analytical data to generate a Certificate of Analysis (CoA). QA then reviews for transcription accuracy and audit trail before releasing the batch for production or clinical use. CDS is heavily utilized in the automation of the analytical workflow and plays an increasingly important role in post-analysis processes.
Regulations and Quality Systems of the Organization
Figure 2 shows the various processes of a pharmaceutical analytical testing workflow in and outside of the operation under external regulations and internal quality system processes (shown above the workflow schematics in Figure 2).
First, the laboratory, laboratory equipment, and analytical procedures and processes must follow GMP regulations (21 CFR part 211) (18) and handling of data both inside and outside of the laboratory 21 CFR Part 11 (14). Note that other facilities such as contract research organizations (CROs) often operate under GLP regulations (21 CFR part 58) (19) for non-clinical studies such as toxicology evaluations or bioanalytical studies.
Second, the laboratory analyst must be thoroughly trained and follow the company’s internal quality system (3,20) and already defined SOP, and must document all pertinent data in a laboratory notebook (paper-based or electronic laboratory notebook (ELN)) (19,21). All critical laboratory equipment, including the CDS, must be qualified, and the analytical method used must be qualified and/or validated (2-3).
Sampling and Sample Preparation
The laboratory analysis workflow starts with a sampling step to obtain a representative sample from a batch of drug substance or drug product, followed by a sample preparation step that includes the preparation of the sample solution(s), reference solutions, mobile phases, and system suitability solutions that verify the system’s sensitivity, precision, or peak tailing performance, and its ability to achieve sufficient resolution of all key analytes (3). These sample vials are then transported to the HPLC system, and placed inside the autosampler tray. According to GMP regulations, all pertinent information of the samples, reagents, instruments, columns, and mobile phases must be recorded appropriately for traceability in a regulatory audit (3,18).
Analytical Testing
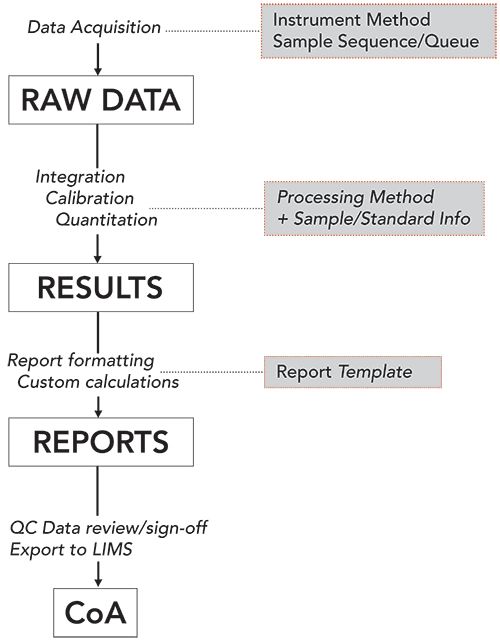
During the next analytical testing phase, the CDS plays a major role in the instrument control and data processing steps to generate results and reports, as summarized in the data flow schematic diagram in Figure 3 (4).
Figure 3: Schematic diagram showing the analytical data workflow in a specific CDS (Waters Empower CDS) and the type of methods used: 1. instrumental setup for the acquisition of the raw data using instrument method and a sample sequence; 2. data processing to generate results using a processing method; and 3. Generation of formatted reports using a reporting method. The report is then reviewed by QC management and signed-off directly in the CDS, where they can often be exported automatically to a LIMS for the generation of a CoA.
Instrument Setup
HPLC instrument control can be a complex process with many precisely engineered modules of the HPLC system that must work together to produce accurate results (3). For an HPLC method to perform correctly, all modules (pump, autosampler, column oven, and detector) must be set up properly with the correct column, mobile phases, samples, and standards. All of these instrument parameters are typically “choreographed” or coordinated by the CDS workstation or network, which allows a single-point control of all the modules, which are typically connected via Ethernet or USB cables, using an instrumental method (or an instrumental control section of a CDS method) (4). A CDS network allows flexibility for a user to control any instruments in the network using a client or terminal in the lab, or remotely from a PC in the office or home.
Setup of Sample Sequence
Most active pharmaceutical ingredient (API) quantitative analyses use a reference standard and the external standardization technique to quantitate the main components and all key analytes (3). A sample sequence is typically set up, indicating the names, vial positions, and injection volumes of the samples, references or SST solutions, and blanks. Most CDS systems allow the analyst to use different injection volumes in a single run, although most quality control methods require that the injection volume remain constant throughout. Moreover, before the results from any regulated sample analysis can be accepted, the HPLC system must pass acceptance criteria for SST to ascertain the readiness of the system to obtain accurate and precise results. Resolution, sensitivity, tailing factor, and retention time or area precision are common parameters to determine the suitability of the system for the chromatographic assay (3,21–22).
Data Acquisition and Real-Time Monitoring of Detector Signals
Before starting any sample analysis, it is important to prepare the HPLC system by purging and equilibrating the system and column with the mobile phases to ensure that the system pressure and detector baseline are stable (3). The analyst can perform these functions at the HPLC instrument using the instrument controller (a keypad) or an adjacent PC terminal in the laboratory. These functions can also be performed in the office remotely using a CDS, though no direct observations can be made for situations such as column leaks or mobile phase reservoir misplacements.
The sample sequence or queue is then started from the CDS, and data acquisition from the detector(s) is initiated immediately after the sample is injected from the autosampler. An analyst typically uses real-time monitoring at the CDS client to observe the chromatographic signals for the first few injections, and monitors the pertinent system parameters (pressure, baseline noise, peak retention time, and so forth) to ensure that the sample sequence is running as expected before moving onto other tasks.
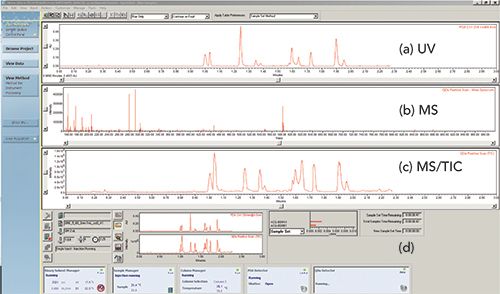
Figure 4 shows a screenshot of Waters Empower 3 CDS during real-time monitoring of a sample injected to an HPLC-UV–MS system. The top window displays the real-time signals from the UV and single-quadrupole MS total ion chromatogram with the active mass spectra displayed in the middle panel. The bottom window shows the status of the sequence and pertinent parameters of the operating modules.
Figure 4: Instrument control screen with real-time data monitoring of multiple detector signals: (a) UV chromatogram, (b) mass spectrum, and (c) MS total ion chromatogram (TIC) shown from a Waters Empower 3 CDS. The instrument status of various HPLC modules and the sample and sequence status are shown in (d) the lowest panel.
Data Processing (Integration, Calibration, and Report Generation)
Data processing typically commences on completion of the entire sample sequence or the following day using an approved processing method, which includes appropriate peak integration (area threshold for peak start), peak identification (expected analyte retention time window), and calibration parameters (weight and concentration of samples and reference standards). In a CDS, information and instructions are contained in the processing method. A new processing method is created during method development, and can be revised later to optimize all parameters. Most analysts use the manual processing function in CDS (for example, in batch processing), unless the sample analysis becomes so reproducible that reports can be generated automatically. During the development of the processing method, the data processing step can be an iterative process, as the integration and calibration and quantitation parameters are optimized, particularly necessary for complex chromatograms. It is, therefore, important that the CDS records the different versions of the processing method during this procedure before the final processing method is used for reporting. No raw data or metadata can be erased or overwritten, as required by 21 CFR Part 11 regulations. Complete data traceability is a mandatory requirement for today’s CDS.
Setting Integration Parameters
The built-in integration algorithm of a CDS is used to transform chromatography raw data into an integrated chromatogram (often called a result file) with peak retention time and peak area or height data (4). Figure 3 offers an example of the general process used in a typical CDS in the transformation from raw data to result.
The analyst first defines the integration start and end time, the narrowest expected peak width, the peak start threshold, and the detector noise level. This is typically using a “wizard” interface. The traditional integration algorithm tracks the detector baseline and looks for an increasing baseline “lift-off” to indicate the peak start of an emerging peak (Figure 5a) (1,4). It does so by comparing the slope of the data against a user-input threshold or slope sensitivity value.
Figure 5: (a) Illustrates how a traditional algorithm compares changes in signal slope to determine the start of a peak; (b) Illustrates how the algorithm determines the retention time of the peak being integrated. Figures adapted from reference (4).
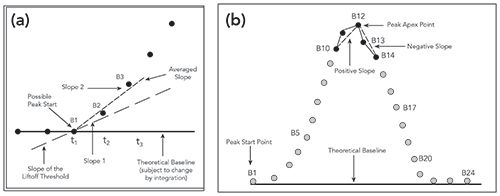
Similarly, a change from a positive to a negative slope may indicate the apex or top of a chromatographic peak (Figure 5b). Tick marks and projected baselines can be used to visualize how the CDS integrates the raw data. Because peaks broaden with retention time under isocratic conditions, raw data points are generally “bunched” to allow the appropriate settings of the lift-off thresholds (1,4).
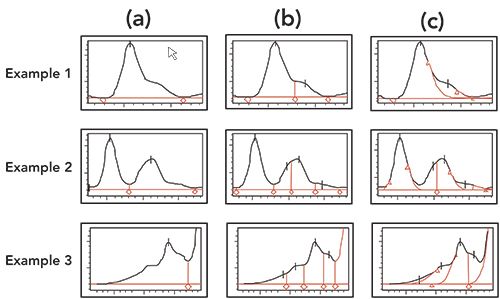
While this traditional integration algorithm can work reasonably well for simple chromatograms, it may require substantial fine-tuning and optimization for a complex chromatogram with many merging peaks or sloping baselines. Most CDS offer options such as “valley-to-valley,” “tangential skim,” or “Gaussian skim” for these situations. Most CDS offer a “manual integration” option, but regulatory agencies discourage this somewhat subjective process, which can become problematic when the integrated peak is near specification limits. An improved algorithm using a second derivative approach, such as ApexTrack in Empower CDS or Cobra in Chromeleon CDS, appears to work well for both simple and complex chromatograms without user intervention (See examples in Figure 6) (4).
Figure 6: Illustrates the ability of the Waters ApexTrack Integration algorithm, which can easily identify and quantitate shoulders versus the results obtained with a traditional integration algorithm (three examples for each integration type are shown). (a) Traditional, (b) ApexTrack with detect shoulders event, and (c) ApexTrack with detect shoulders and Gaussian skim events. Figures adapted from reference (4).
System Suitability Testing (SST)
The first section of the sample sequence in regulated testing is generally reserved for SST, which typically involves ten injections of SST solutions consisting of a blank, sensitivity verification, retention marker solution, reference standard A (2 injections), and reference standard B (5 injections) (3,21–22). The average response factors of the two reference standards must come within 2% to demonstrate the proper weighing of the reference materials. The peak area precision of the five repetitive injections should be set to <0.73% RSD to demonstrate system precision, as suggested by the United States Pharmacopeia (3,22), even though most laboratories still routinely use an acceptance criterion of 2.0% RSD. The tighter criteria are more appropriate because most HPLC systems can routinely achieve a precision level of 0.2–0.5% RSD, which is required for release testing of drug substances with potency specifications of 98.0–102.0%. An HPLC system with peak area precision of only 2.0% RSD will lead to many erroneous out-of-specification results just from the variability of the measurements.
Sample results cannot be used or reported for regulatory testing if there is a failure to meet any of the SST criteria defined (such as resolution, sensitivity, peak tailing, precision), (3). In this scenario, the analyst must document the results and investigate the root cause for SST failure, enforcing any remedial actions, and repeating the analysis.
Peak Identification, Calibration, and Quantitation
Peak identification is more commonly accomplished in HPLC-UV methods by matching the peaks in the sample with those in the reference standard within a stated retention time window (for example, <2% of the retention time of the reference peak). There are three types of commonly used quantitation approaches in HPLC: normalized peak area percent, external standardization, and internal standardization (3). Normalized area percent is often used for reporting impurities during early pharmaceutical development (3,23). External standardization using a single-point calibration of a reference standard is used for potency assays of drug substances and drug products (3,4). Internal standardization is used by spiking the sample with an internal standard to compensate for loss during sample preparation. For bioanalytical testing using LC–MS/MS, an isotopically labeled internal standard is typically used to correct for both MS ionization suppression and sample preparation recovery.
A response factor calculation (such as peak area or amount) is generally used for external standardization, assuming that the response factor is the same for a specific analyte in the reference standard and the sample. A bracketed calibration standard approach is used after a certain number of injections (for example, ten samples) in a long sequence in regulated testing (3,21).
Result Table and Inclusion of both UV and MS Spectral Data
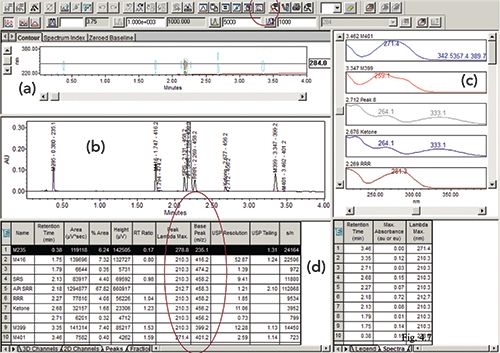
An important time-saving feature of a modern CDS is the integration of spectral data from both diode array detector (DAD) and MS instruments and the ability to automate the insertion of such useful information into a peak table (4). Figure 7 shows the screen display of a result file from a processed sample injection of a retention marker solution using DAD and MS detection. The displayed chromatograms include automated annotation of peak names, retention time, and the parent MS peak (M+1) of each analyte, and a 2D contour map from the DAD detector with UV spectra in the right-hand panel. The peak table includes data such as peak name, retention time, area, height, and area%, plus additional spectral data of λmax and parent MS peaks, and calculated parameters such as relative retention time (RT ratio), USP resolution and tailing factor, and signal-to-noise ratio (S/N) (3). A modern CDS allows customization of the result table with a display of the correct number of significant figures, as shown in Figure 7.
Figure 7: Showing (a) a UV contour map; and (b) the graphical user interface (GUI) of Waters Empower 3 CDS showing a result from the injection of a retention marker solution into an HPLC-UV–MS system displaying a chromatogram at 284 nm; (c) shows UV spectra; and (d) displays a peak table showing various extracted UV and MS parameters.
Generation of Formatted Reports
The final data processing step can be the generation of a report of a sample or the entire sample sequence for data review and archival. A reporting template is generally used, and the final report can be customized to generate the information required by the company or regulatory agency, which may include specialized calculations (for example, custom fields). A final report may include sample information (batch number, sample i.d., analysis date, result and sequence i.d., method i.d.), peak tables, chromatograms (full scale and expanded scale), spectral data (UV and MS), and pass or fail sample status against specifications.
Another type of CDS report is a summary report that extracts results from a group of samples and performs a calculation or statistical evaluation (such as repeatability of injections for peak area). Most CDS supports the use of standard report templates to facilitate report regeneration of routine assays.
Data Archiving, Data Review and Sign-off, Export to LIMS, and CoA Generation
All raw and metadata from a CDS for regulated testing must be archived, backed up and secured in compliance with 21 CFR Part 11 regulations with a high degree of data security, traceability, and integrity (2,7). Raw data cannot be deleted, over-written, or altered. Critical metadata such as methods and processed data (results) cannot be deleted but can be revised with the date and version stamps to allow traceability. The CDS reports are reviewed and signed-off by the designed reviewers or approvers (such as the QC manager).
An electronic signature process is more commonly used after the review process of the CDS data in regulated testing laboratories, typically during the review and sign off of the laboratory notebook. An approved report should not be deleted.
Many CDS have automated exporting functions that export the approved chromatographic data to a LMS or LIMS, which can then generate an official CoA of the sample after merging data from other sources (3). The CoA of the drug substance or drug product sample is then further reviewed by QA for the official release of the batch for further development, clinical trials, or the market. Data are retained according to regulations and the corporate quality SOPs.
Recent Trends in CDS Technologies
Modern CDS networks are sophisticated informatics systems incorporating 40 years of advances in software, networking, and database technologies. Most leading CDS have desirable features and characteristics that are listed in Table I. Some recent prominent trends are described here.
Database Technologies
Early CDS used a directory structure called flat-file systems such as those used in MS-DOS operating system with folders and sub-folders in a hierarchical organization (Figure 8a). Although this file system worked well for small deployments, it proved inadequate for larger installations. The potential issues surrounding accidental deletion, data being overwritten, data traceability, and disaster recovery were significant. This was especially true when raw data were reprocessed multiple times with modified versions of the processing method, creating multiple result files derived from the same raw data.
Figure 8: (a) Typical directory structure found in a "flat file" data system; and (b) the relationship of the different tables of data within a CDS based on a relational database.
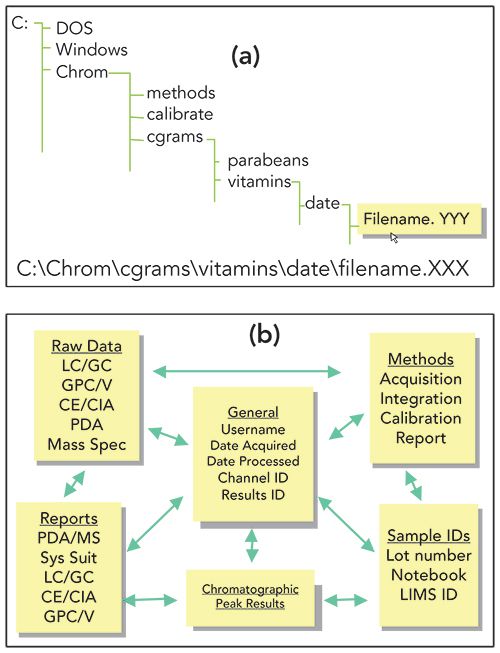
One solution is the use of a relational database, which was first pioneered by Waters Corporation with the introduction of Millennium CDS in 1992, a predecessor to Empower CDS (4). Currently, all leading CDS manufacturers such as Waters, Thermo Fisher, Agilent, Shimadzu, and Justice Laboratory Software (Chromperfect) support the use of database technologies (Oracle, SQL server, or both).
Using relational database technology (Figure 8b) brings three significant benefits:
- Databases can “date and time stamp” all information. This makes accidental overwriting of raw data and methods less likely.
- The relational database ties all “metadata” together, covering all aspects of data acquisition, data processing, result generation, review, and approval. It provides a necessary audit trail as methods are modified, data reprocessed, and system settings changed.
- They provide faster and simpler mechanisms for data retrieval and management.
Instrument Control and Diagnostics
Most instrument manufacturers have moved away from proprietary control protocols and have begun using communication protocols like Ethernet to provide full, bidirectional instrument control capabilities to the CDS analyst. This enables laboratories to have a true single-point, single-keyboard control of their chromatographic systems while also providing enough data bandwidth to accommodate information-rich detectors like DAD and single-quadrupole MS (see example in Figures 4 and 7). For most CDS vendors, high-resolution MS, such as time of flight (TOF) instruments, still require their own control and data-handling software or workstations.
CDS can also provide enhanced analytics for instrument diagnostics, maintenance, troubleshooting, and service information, including online manuals, videos, and links to web resources. As modern analytical instruments are designed with sophisticated onboard diagnostics, many CDS are capable of identifying problems and even problem remediation by real-time actions, such as stopping a running sequence and shutting down the instrument, if necessary.
Improved Integration of UV and MS Data
Another active area in CDS development is the improved integration of UV and MS data by many CDS manufacturers. UV detection, the standard for pharmaceutical analysis, can be effectively supplemented by MS detection during method development and sample analysis for definitive peak identification. Many modern CDS support the seamless control of their own brands of single-quadrupole MS with displays of spectral and ion current signal from the MS (total and selective ion) in addition to automatic annotations of parent ions in the UV chromatograms and result tables (case studies shown in Figures 4 and 7). This is particularly important as newer MS systems are becoming more compact and easier to use by chromatographers without requiring specialized MS training.
There is a growing trend for CDS to include support for triple-quadrupole MS and HRMS, and as such, these MS instruments often require their specialized data systems (such as the Waters MassLynx and Agilent MassHunter, which also have their own HPLC instrument control software). However, Chromeleon CDS has made significant advances in this area, providing the ability to acquire, process and report data from triple-quadrupole MS, HRMS, and chromatography instruments with a single software platform solution.
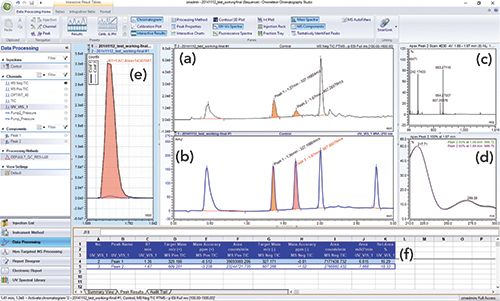
Figure 9 illustrates the growing trend of incorporating MS capabilities with Chromeleon CDS displaying both high-resolution accurate mass and UV spectral data.
Figure 9: Screenshot from Chromeleon 7 CDS showing targeted screening for known components of interest using both HRMS (Thermo Scientific Q Exactive Quadrupole-Orbitrap Mass Spectrometer) and DAD. This CDS can process data from both MS and UV detectors and simultaneously view, analyze, and report HRMS and 3D UV data. The screen shows (a) the MS, and (b) UV channels, (c) MS and (d) UV spectra, (e) an overlay of the confirming ions, plus (f) the relevant peak results. (Figure courtesy of Thermo Fisher Scientific.)
More Efficient Data Review
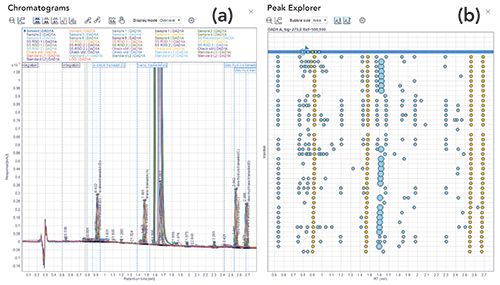
Given that separation systems have enjoyed major advances that have significantly reduced chromatographic run times, they allow for larger amounts of chromatographic data to be collected. As a result, laboratories now process and review very large chromatography data sets, which sometimes contain thousands of peaks. Data review tasks typically rely on manual interpretation of chromatograms, peak integration baselines, calibration curves, and calculated results to ensure they fall within specifications. Further, any incident or anomaly that negatively affects production requires immediate investigation of these data to allow fast problem resolution. When presented correctly, the human eye is powerful in its ability to identify anomalies in large data sets. As shown in Figure 10, Peak Explorer, an OpenLab CDS data analysis capability, is specifically designed to present chromatographic data in a format optimized for visualization by the human eye. By presenting chromatographic data and results in a single helicopter view, users can easily and rapidly detect artifacts, outliers, and patterns.
Figure 10: Screenshots from OpenLab CDS showing the display (a) of a large number of samples in the overlaid chromatograms view, and (b) Peak Explorer view. The latter allows easier visual detection of patterns, artifacts, outliers, and anomalies in a large sample set. (Figure courtesy of Agilent Technologies.)
Links to Software Tools and Informatics Systems
HPLC method development is a time-consuming task that demands considerable skills and efforts from an experienced scientist using the one-factor-at-a-time approach (3,24). Popular HPLC method development software (such as Fusion QbD from S-Matrix, ChromSword Developer from ChromSword, or ACD/AutoChrom) often works together with CDS to expedite or automate the method development process. For instance, Fusion QbD can utilize a design of experiments (DoE) approach to expedite a systematic method development process and work directly with many CDS (Empower, Chromeleon CDS, and OpenLab) by creating and downloading a sequence of methods of varied parameters. After the sequence result data are processed, the software can import the results back from the CDS and perform further statistical analysis to display the optimum separation conditions (24).
Similarly, software to expedite method validation is available such as Empower Method Validation Manager (25) from Waters. This is a workflow-based tool that manages the entire method validation process, from protocol planning to the final reporting. This software tool displays the status of ongoing validation studies, tracks corporate requirements, and acceptance criteria while flagging any out-of-specification results. All statistical calculations are performed within Empower 3, eliminating data transcription errors.
The ICH Method Validation Extension Pack, offered by Chromeleon CDS, can also be used to expedite the method validation process, providing the user with predefined templates and customizable workflows that have been developed in accordance with the guidelines and specifications outlined by The International Council for Harmonisation of Technical Requirements for Pharmaceuticals for Human Use (ICH).
For laboratories performing frequent method development and validation studies, these automated tools can have a significant impact on productivity by saving time and documentation efforts.
Cloud Computing
Cloud computing is one of the most active areas of development for today’s CDS manufacturers. Most readers of this article are probably using a CDS product that is running locally or in your company’s data center. This is referred to as “on-premises.” In this model, your information technology (IT) organization manages the server hardware, the laboratory hardware (acquisition devices and PCs), and the application, including all support and product upgrades. Cloud services are categorized as IaaS, PaaS, or SaaS, with increasing computing, operating system, networking, and archiving activities conducted in the cloud. As organizations try to reduce capital expenses for computers and infrastructure, there is also a big push toward business agility.
Companies like Thermo Fisher and Waters already offer CDS products that can be deployed using cloud services from Amazon (AWS) and Microsoft (Azure). Some of the other key benefits are dynamic scalability, easier access to remote sites, greater levels of security, and a level of disaster recovery that is difficult to attain with an on-premises deployment (26).
The Paperless Laboratory, Laboratory of the Future, Artificial Intelligence and Machine Learning
One often wonders if the Paperless Laboratory (27), Laboratory of the Future (LoTF) (28), Smart Laboratory, and Artificial Intelligence are truly attainable goals.
Today, we are much closer than ever to succeeding in these projects and achieving a true digital laboratory of the future. A recent, multi-year study performed by Gartner Research estimates that, by 2022, 40% of the top 100 pharmaceutical companies will establish digital technology platforms for R&D (28). Core to a LoTF strategy is treating laboratory-related information as an asset. This will be accomplished by linking laboratory data and activities across platforms and diverse business processes.
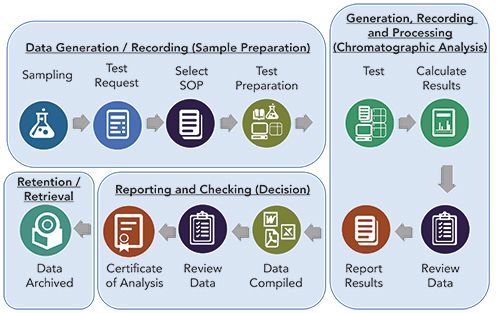
As more companies rely on technologies like Electronic Lab Notebooks (ELN), scientific data management solutions (SDMS), inventory systems, and of course, LMS/LIMS, the CDS remains a key focal point of the laboratory. When you consider the increased focus on data integrity, data review and approval, laboratory analytics, data lifecycle management, and reducing infrastructure complexity, we see some important changes coming. If you look at the last few years of CDS evolution for companies like Waters, Thermo Fisher, Agilent, or Shimadzu, you see some common themes. Multi-vendor instrument control has become a necessity for most organizations, as it is impractical for many laboratories to standardize on instrumentation from a single vendor. Of growing importance is the need for integrated laboratory solutions that go beyond the simple chromatographic workflow of the CDS alone. (See Figure 11,)
Figure 11: The total chromatographic workflow from sample and solution preparation, through the analyses and data review, creation of the CoA, and finally, the archiving of the data. The block on the right represents the typical analysis and CDS processes. The blocks before and after, represent the work performed by ELNs, paper notebooks, LIMS, inventory systems, and data management systems. It is through the seamless communication and transfer of information that we begin to realize the vision of the digital LoTF.
Integrating the CDS workflow into the broader laboratory process is not a new concept. LIMS vendors have been doing this for many years by transferring sample work lists to the CDS and retrieving the results after the analyses are complete. What has been missing is all of the valuable metadata that surround key laboratory activities like sample and solution preparation, balance and pH meter calibrations, adherence to approved SOPs, and compiling all of the non-CDS data that may be required to approve and release the final product. ELN vendors have also been busy trying to improve their integration with CDS as a way to better document the entire laboratory workflow, reduce the amount of peer review required, and improve the overall data integrity of the analyses being performed. In recent years, you may have heard terms like right first time and review by exception. Both terms point to the need for better laboratory process control and streamlining data review, all with the goal of preventing common errors, increasing laboratory efficiency, and improving overall data quality and data integrity. The major pitfalls to universal implementation remain a lack of common standards in ELN, CDS, and LMS/LIMS, plus a tendency for underestimating the difficulties to obtain consensus between different departments in a global organization.
The last few years have seen significant activity from Agilent, Thermo Fisher, and Waters to try to address these issues. These vendors have looked at their product portfolios, and either made product acquisitions or tailored their existing products to more effectively connect with their own CDS. These newly created solutions significantly enhance the basic capability of their standalone CDS. All of these integrated solutions revolve around delivering four key benefits to the laboratory and the business:
Extend the chromatography workflow to include sample management, sample and solution preparation, adherence to approved SOPs, improved data review and approval, reporting, and data archiving.
Provide complete traceability for the entire process, not just the chromatography. This greatly simplifies the auditing and troubleshooting in the laboratory.
Provide an improved user experience with functionality such as simple dashboards or landing pages that help guide the laboratory analyst.
Provide data review tools (such as data visualization, trending analysis) that facilitate the real-time identification of areas in the process that may be out of specification or out of trend, and require immediate attention (example in Figure 10).
These product enhancements are the direct result of an ever-changing laboratory. All industries are experiencing greater demands on productivity, more stringent regulations for the laboratory, more complex analyses, and an increasing focus on quality. The move towards the digital LoTF is now becoming a reality. Utilizing artificial intelligence (AI) and machine learning within a cloud infrastructure enhances data integrity, data review, and approval. This type of modern architecture also provides the framework for improved laboratory analytics and data lifecycle management, all while dramatically reducing infrastructure complexity.
Acknowledgments
The authors thank the following colleagues for their review of the manuscript: Shawn Anderson of Agilent Technologies; Darren Barrington-Light of Thermo Fisher Scientific; Adrijana T orbovska of Farmahem DOOEL; and He Meng of Sanofi; Mike Shifflet of J&J; Shirley Wong, Margaret Maziarz, Neil Lander, Isabelle Vu Trieu, and Tracy Hibbs of Waters Corporation. A special thank Shawn Anderson, who provided us with graphics used in Figures 10.
This installment is the last of a series of four articles on HPLC modules, covering HPLC pumps, autosamplers, UV detectors, and CDS (29–31), which present updated overviews to the reader. The decision to collaborate with experts from manufacturers was necessary and pivotal to have an insider’s view of these sophisticated modules. The process of working with scientists with a different perspective was challenging at times but proved to be rewarding. I would like to give special thanks to the first authors of the series: Konstantin Shoykhet of Agilent (pumps), Carsten Paul of Thermo Fisher Scientific (autosamplers), and Robert Mazzarese (CDS), formerly with Waters, for spending many hours on these comprehensive articles.
References
- N.D. Dyson, Chromatography Integration Methods (Royal Society of Chemistry, Cambridge, United Kingdom, 1998).
- R.D. McDowall, Validation of Chromatography Data Systems (Royal Society of Chemistry, Cambridge, United Kingdom, 2016).
- M.W. Dong, HPLC and UHPLC for Practicing Scientists (John Wiley and Sons, Hoboken, New Jersey, 2nd ed. 2019), Chapters 4, 7–11.
- R. Mazzarese, Handbook of Pharmaceutical Analysis by HPLC, S. Ahuja and M.W. Dong, Eds. (Elsevier, Amsterdam, The Netherlands 2005), Chapter 21.
- L. R. Snyder, J.J. Kirkland, and J. W. Dolan, Introduction to Modern Liquid Chromatography (John Wiley & Sons, Hoboken, New Jersey, 3rd ed., 2010), pp. 499–530.
- A. Simon, The HPLC Expert: Possibilities and Limitations of Modern High Performance Liquid Chromatography, S. Kromidas, Ed. (Wiley- VCH, Weinheim, Germany, 2016), Chapter 6.
- R. D. McDowall and C. Burgess, LCGC North Am. 33(8), 554–557, 2015.
- R. D. McDowall, LCGC North Am. 37(1), 44–51 (2019).
- Empower 3 Chromatography Software Validation Manager (Waters Corporation, Milford, Massachusetts, 720001257EN, June 2016).
- Chromeleon 7 CDS (Thermo Fisher Scientific, San Jose, California, BR71151-EN 09/16S).
- Agilent OpenLab CDS, Designed for the Modern Chromatography Lab (Agilent Technologies, Santa Clara, California, 5991-8951 EN, 2018).
- Analytical Data System LabSolutions (Shimadzu Corporation, Kyoto, Japan, 3295-12103-30ANS).
- M.W. Dong, L.C. Lauman, D.P. Mowry, M. Canales, and M. E. Arnold, Amer. Lab. 25(14), 37–45 (1993).
- 1Code of Federal Regulations (CFR), 21 CFR Part 11, Electronic Records and Electronic Signatures (U.S. Government Printing Office, Washington, DC, 2018).
- M.W. Dong, LCGC North Am. 37(4), 252-259, 2019.
- M.W. Dong, LCGC North Am. 36(4), 256 (2018).
- Glenn Cudiamat, Top-Down Analytics, private communication.
- Code of Federal Regulations (CFR), Part 211.194(a), Current Good Manufacturing Practice for Finished Pharmaceutical Products (U.S. Government Printing Office, Washington, DC, 2019).
- Code of Federal Regulations (CFR), Part 58, Good Laboratory Practice for Nonclinical Laboratory Studies (U.S. Government Printing Office, Washington, DC, 2019).
- International Conference on Harmonization, ICH Q10 (Pharmaceutical Quality Systems Geneva, Switzerland, 2007.)
- D. Kou, L. Wigman, P. Yehl and M.W. Dong, LCGC North Am. 33(12), 900–909 (2015).
- USP<621>, Chromatography, USP 40 NF 35 (United States Pharmacopeial Convention, Rockville, Maryland, 2017).
- M.W. Dong, LCGC North Am. 33(10), 764–775 (2015).
- R.P. Verseput and J.A. Turpin, Chromatography Today 64, (2015).
- Waters Empower 3 Method Validation Manager, (Waters Corporation, Milford, Massachusetts, 2017), 720001488 EN.
- R. Rafaels, Cloud Computing (CreateSpace Independent Publishing, 2nd ed. 2018).
- M. P. Convoy, Chem. Eng. News 95(23), 24–25 (2017).
- https://www.gartner.com/en/documents/3876808/innovation-lab
- K. Shoykhet, K. Broeckhoven, and M.W. Dong, LCGC North Am. 37(6), 374–384 (2019).
- C. Paul, F. Steiner and M.W. Dong, LCGC North Am. 37(8), 514–529 (2019).
- M.W. Dong and J. Wysocki, LCGC North Am. 37(10), 750–759 (2019).

Bob Mazzarese was with Waters Corporation for over 40 years. He held several field management positions and spent the last 27 years of his career in laboratory informatics, with a primary focus on CDS and Data Management. He managed informatics field sales and support teams for over 20 years and spent the last 7 years managing the Waters Global Informatics team. Prior to working at Waters, he was an organic chemist at the Naylor-Dana Cancer Research Institute. He has a BS in Chemistry from Manhattan College and a Masters in Organic Chemistry from NYU. Bob has recently retired from Waters.

Steve Bird has over 30 years of experience in the life science industry as an engineer, IT professional, and strategic market leader, and is currently the Director of Informatics Strategic Marketing at Waters Corporation. In his current role, he is accountable for the informatics software strategy working directly with customers, partners, and industry bodies in the life, materials, and food sciences industry. Throughout his career at Waters, he has held numerous positions in product management and strategic partner relations management, and has been instrumental in onboarding key technologies and partners. He received his B.S. in Information Technology from the University of Massachusetts Lowell.

Peter Zipfell is a Software Product Marketing Manager at Thermo Fisher Scientific, with a current focus on enterprise chromatography data systems. For the past 19 years, he has worked extensively with chromatography hardware and software, including mass spectrometry. Prior to joining Thermo Fisher Scientific as a Product Support Specialist, he worked in the pharma industry as a QC analyst, study director, and as an R&D scientist at GlaxoSmithKline. He has provided both software and hardware solutions to clients across multiple industries to enable them to improve their current workflows and increase productivity, while he gained his BSc in Biomedical Sciences from Sheffield Hallam University, in the UK.

Michael W. Dong is a principal of MWD Consulting, which provides training and consulting services in HPLC/UHPLC, method development/improvements, pharmaceutical analysis, and drug quality. He was formerly a Senior Scientist at Genentech, a Research Fellow at Purdue Pharma, and a Senior Staff Scientist at Applied Biosystems/Perkin-Elmer. He holds a Ph.D. in Analytical Chemistry from the Graduate Center of the City University of New York. He has over 120 publications and four books, including a best-selling book in HPLC. He is an editorial advisory board member of LCGC North America, Connecticut Separation Science Council, and the Chinese American Chromatography Association.

A Well-Written Analytical Procedure for Regulated HPLC Testing
October 15th 2024This paper describes the content of a well-written analytical procedure for regulated high-performance liquid chromatography (HPLC) testing. A stability-indicating HPLC assay for a drug product illustrates the required components for regulatory compliance, including additional parameters to expedite a laboratory analyst’s execution.

.png&w=3840&q=75)

.png&w=3840&q=75)


.png&w=3840&q=75)


.png&w=3840&q=75)


