Chromatographic Isolation of Sensitive Compounds: Challenges and Solutions


Liquid chromatography (LC) can be used to isolate compounds of interest from mixtures for further analysis, using techniques such as mass spectrometry and nuclear magnetic resonance (NMR). The conditions of such isolation methods can lead to degradation of the isolated compounds of interest, which is obviously a major problem if a goal of the isolation is to identify the compound of interest. In this installment of “LC Troubleshooting,” we discuss strategies that can be used to minimize the likelihood of compound degradation in the isolation process.
Preparative chromatography is often essential in industrial settings to isolate highly pure target compounds from complex samples for purposes including structure identification, activity testing, quantitative analysis, mass spectrometric (MS) analysis, reaction monitoring, and developing analytical standards. Depending on the concentration of the target compound in the sample and the amount of purified material needed, the isolation can be carried out at the analytical scale (µg to mg), while preparative scale purification is required for larger quantities (> gram). Several challenges are frequently encountered during this type of isolation, including sample complexity, poor peak shapes, scalability, productivity, solvent and buffer selection, isolating purity and recovery, and barriers to automation. In this article, we discuss purification of a target impurity performed at low temperature to promote the stability of the target compounds. Compared to separations carried out at higher temperatures, the chromatographic profile observed under low temperature conditions shows excessive peak broadening. However, chromatographic performance is sacrificed in the interest of reducing degradation of the target compound. In this particular case, the temperatures of the autosampler, column compartment, and the fraction collector were all set to 5 oC. The highly aqueous fractions were dried using a rotatory evaporator operated at low temperature and pressure, while an azeotrope was added to facilitate water removal.
Separation vs. Isolation Methods
In chromatography, we often adjust method conditions to achieve optimum separation performance, as measured by metrics such as resolution or analysis time. There are several variables we can consider adjusting, including selection of stationary phase, selection of mobile phase solvents, buffer types and pH, column temperature, column dimensions, particle size, and gradient elution parameters (for example, gradient slope). Contemporary workflows very often involve the use of software designed for the purpose of systematically adjusting one or more of these variables as a means of guiding the method development process. We often prioritize conditions that enable detection of the largest number of analytes in a mixture with good efficiency and adequate resolution between individual components. An example of this is shown in Figure 1a, where there is adequate resolution between all the components of the mixture in a reasonable analysis time (1). The ultimate goal of a method like this is to separate the components of a mixture for identification and quantification of individual components, which can be implemented in applications such as quality control, forensic analysis, pharmaceutical analysis, research and development, and process optimization. An analytical method could be further validated and used for decades, especially in the pharmaceutical industry, for purity analysis, content uniformity, and impurity monitoring.

 Analytical method suitable for quantitating and identifying all the individual peaks in the sample; (b) Method suitable for isolating peak 7.")
FIGURE 1: Simulated chromatogram for the separation of a warfarin mixture. (a) Analytical method suitable for quantitating and identifying all the individual peaks in the sample; (b) Method suitable for isolating peak 7.
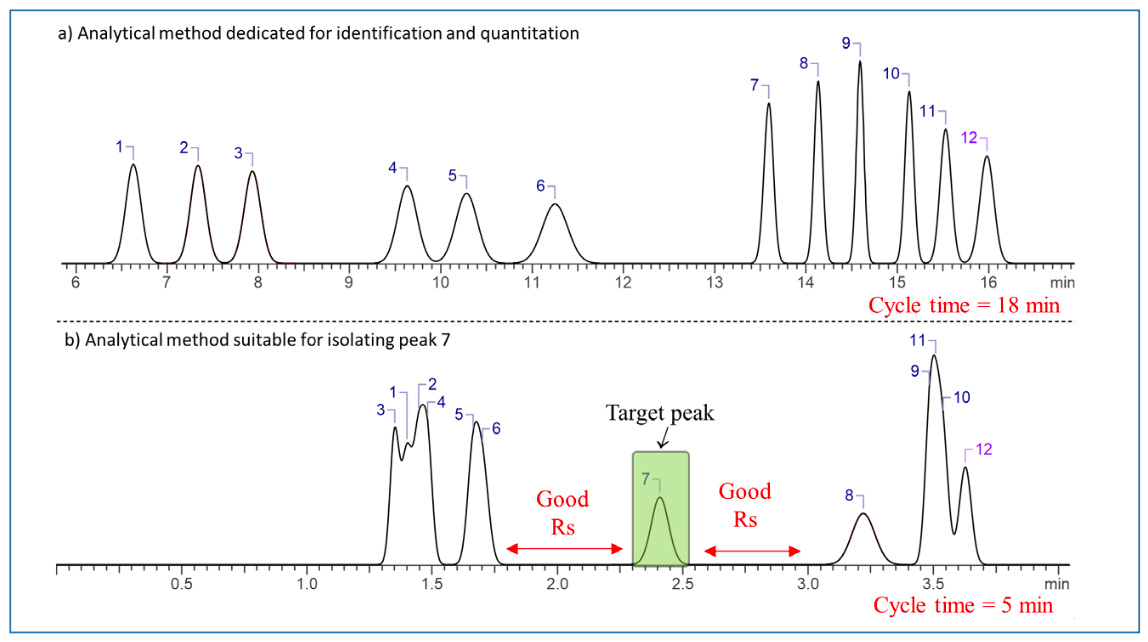
Chromatographic methods can also be developed for isolating target components from a complex mixture at the analytical scale (that is, µg–mg amounts). During method optimization in this case, the emphasis is on maximizing the resolution in the vicinity of the peak of interest while also reducing the method cycle time to maximize productivity. An example of this is shown in Figure 1b for the same sample as in Figure 1a. Here, resolution of compounds 1–6 and 9–12 is sacrificed in the interest of very cleanly isolating compound 7. Maximizing resolution in the vicinity of the target compound increases the loading capacity for crude sample material, and maximizes purity and recovery. When developing an isolation method, our choices of stationary and mobile phases’ chemistries are also more limited, because we need to anticipate the possibility of scaling the method up (for example, larger diameter columns and higher flow rates) and the need to remove large volumes of solvent from the collected isolate fraction(s). The use of volatile buffers and stationary phases that are commercially available in large diameter formats facilitates scaling up the method while generating highly pure isolates.
Sample Stability During Isolation
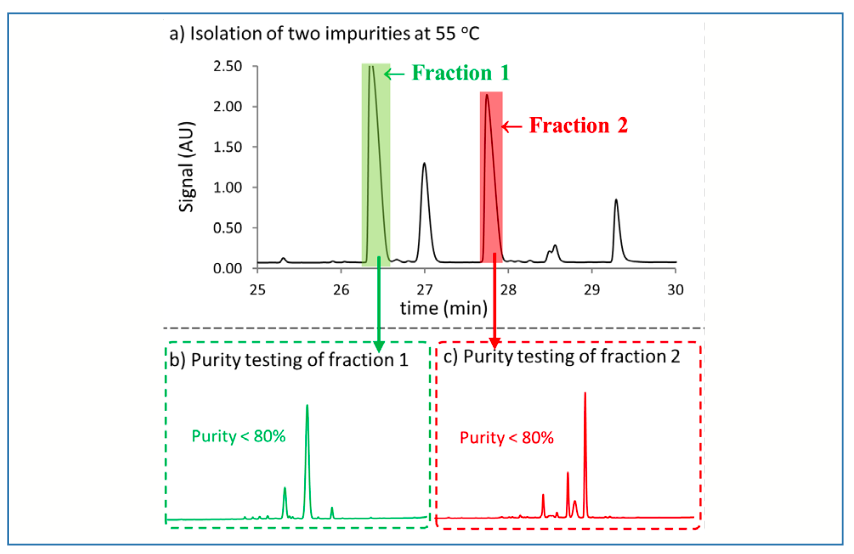
Drying isolates collected following preparative separations can pose challenges because of several factors including instability of isolated compounds, large volumes of collected materials, the presence of salts or nonvolatile buffering agents, and compound reactivity. Some situations involve more than one of these factors, severely complicating the drying process and the isolation of pure target materials (2–4). In the work discussed here, the isolation of two compounds at the milligram scale was required to establish their structures. Given the high concentrations of both compounds in the crude sample and the low amounts needed for further characterization work, the isolation was performed at the analytical scale. An analytical method was developed using Ascentis Express C18 using 0.05% trifluoracetic acid in water and acetonitrile at 55 °C, as shown in Figure 2a, with the peaks of interest shaded in green and red. The isolated fractions were assessed for purity before drying as shown in Figures 2b and 2c, and the purity was clearly less than 98% (a desired purity level at this stage). Several peaks were observed in analyses of the isolated fractions indicating significant degradation of the target impurities during the collection step.

FIGURE 2: Isolation of two peaks of interest at 55 oC. (a) Separation of crude sample with two fractions collected as indicated by the shaded regions. Chromatographic conditions: Sample–66.7 mg/mL in 17% water (H2O)/83% acetonitrile (ACN); Column–Ascentis Express C18; Detection–UV absorbance at 210 nm; Flow rate–0.6 mL/min; Mobile phase–0.05% trifluoroacetic acid in H2O (A) and 0.05% trifluoroacetic acid in ACN; (b) Gradient conditions–5 %B (2.4 min), 5–65 %B (36.6 min), 65–95%B (0.1 min), 95 %B (5min), 95%–5 %B (0.1 min), 5 %B (6 min); (b) Purity of fraction 1; (c) Purity of fraction 2. Chromatographic conditions: Column–Waters Acquity UPLC BEH C18, 150 mm x 2.1 mm i.d., 1.7 μm; Detection–UV 210 nm; Flow rate–0.5 mL/min.; Mobile phase–0.05% methanesulfonic acid in 98:2 (v/v) H2O:IPA (A) and 98:2 (v/v) ACN:IPA (B). Gradient conditions–5 %B (0.5 min), 5–65 %B (7.5min), 65–95%B (0.1 min), 95 %B (1 min), 95–5%B (0.01 min), 5 %B (1 min).
To assess the possibility that degradation of the target impurities was promoted by the 55 °C temperature, the temperatures of the autosampler, column compartment, and fraction collector were dropped from 55 °C to 20 °C. The chromatogram obtained following these changes is shown in Figure 3a. It is clear that fewer peaks are observed, and in lower abundance, in Figure 3a compared to Figure 2a, which suggests that degradation of the target impurity was occurring during the chromatographic separation itself. Figures 3b and 3c show chromatograms for the fractions collected from the separation at 20 °C, where it is evident that the purity is significantly higher (> 90%) than for the fractions collected from the separation at 55 °C. However, the obtained purity is still less than the target level of 98%, which is required for establishing molecular structure and further characterization using other techniques. To further troubleshoot this issue, the temperature was further dropped to 10 °C, and the obtained chromatogram is shown in Figure 4a. The peak broadening observed here is due to operating the column at low temperature (5); however, the purity of the isolated peaks is higher than 99% (Figures 4b and 4c), confirming again that the degradation of the target impurities observed in the previous isolations at 55 and 20 °C occurs primarily during the fraction collection process itself.

FIGURE 3: Isolation of two peaks of interest at 20 oC. (a) Separation of crude sample with two fractions collected as indicated by the shaded regions. Chromatographic conditions: Sample–66.7 mg/mL in 17% water/83% ACN; Column–Ascentis Express C18; Detection–UV absorbance at 210 nm; Flow rate–0.6 mL/min.; Mobile phase–0.05 % trifluoroacetic acid in H2O (A) and 0.05 % trifluoroacetic acid in ACN (B); Gradient conditions–29 %B (3 min), 29-38.5 %B (18 min), 38.5-95%B (0.01 min), 95 %B (6min), 95%-29 %B (0.01 min), 29 %B (6 min); (b) Purity of fraction 1; (c) purity of fraction 2. For chromatographic conditions of b and c, please see Figure 2.
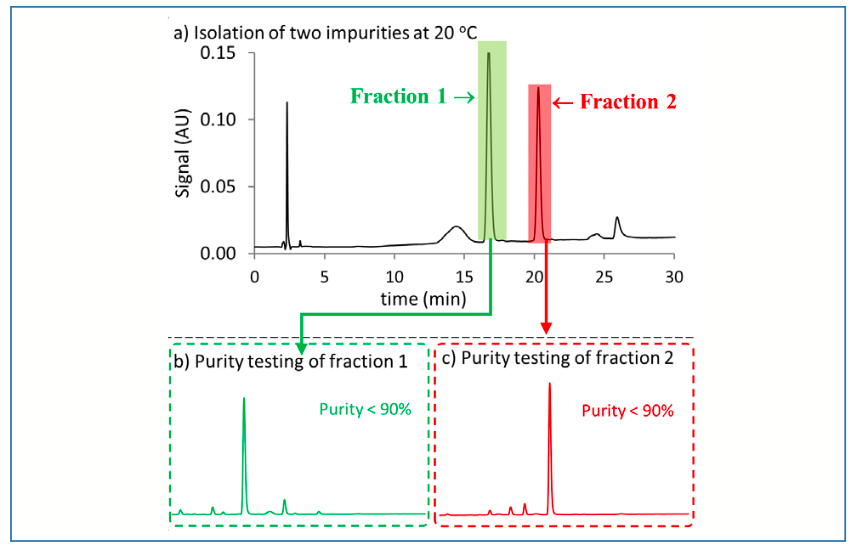

FIGURE 4: Isolation of two peaks of interest at 10 oC. (a) Separation of crude sample with two fractions collected as indicated by the shaded regions. Chromatographic conditions: Sample–66.7 mg/mL in 17% water/ACN; Column–Ascentis Express C18; Detection – UV absorbance at 210 nm; Flow rate–0.6 mL/min.; Mobile phase–0.05 % trifluoroacetic acid in H2O (A) and 0.05 % trifluoroacetic acid in ACN (B); Gradient conditions–29 %B (3 min), 29–38.5 %B (18 min), 38.5–95%B (0.01 min), 95 %B (3 min), 95%–29 %B (0.01 min), 29 %B (4 min); (b) Purity of fraction 1; (c) Purity of fraction 2. For chromatographic conditions of b and c, see Figure 2.
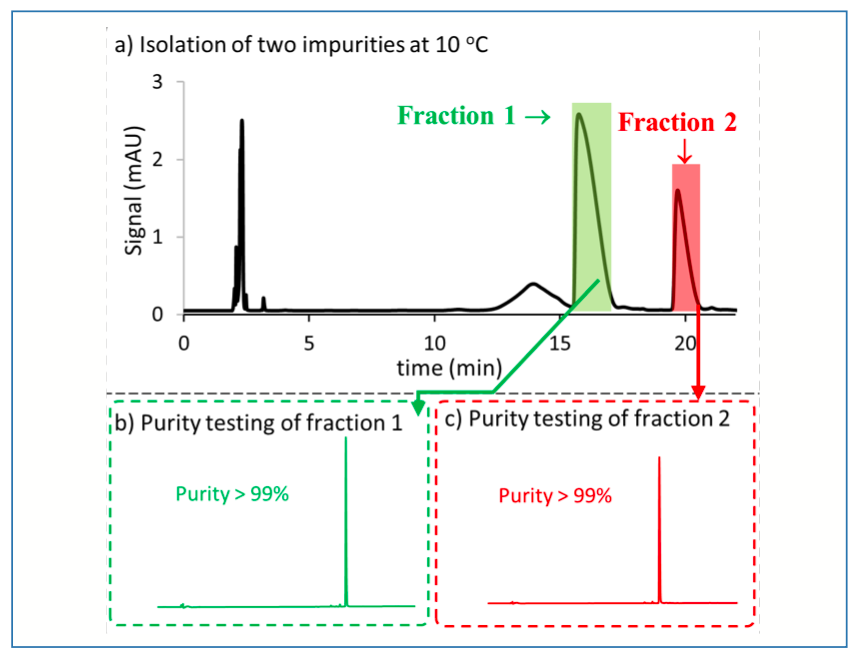
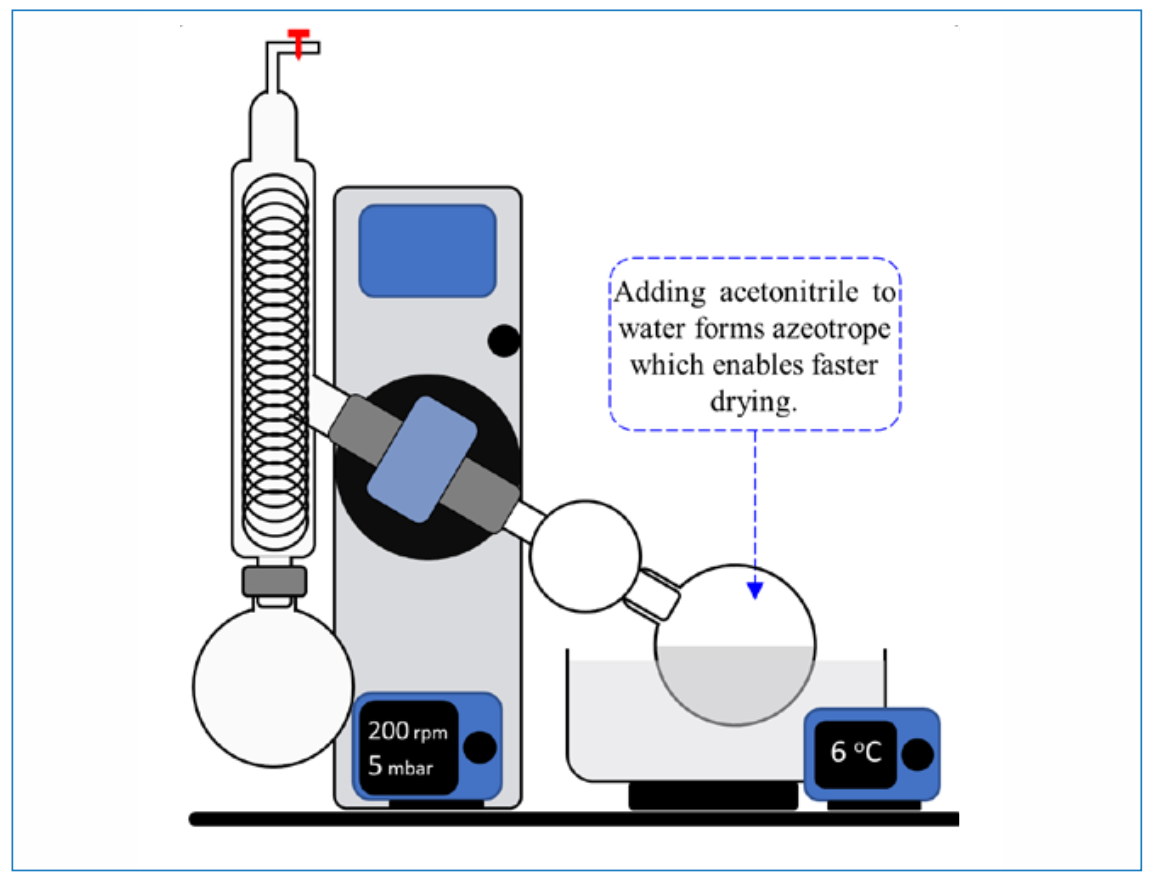
The materials isolated at 10 °C meet the target purity level before drying, as shown in Figures 4b and 4c. It is critical to keep the samples at a temperature as close as possible to freezing to minimize degradation. Given that the collected fractions contain a lot of water, this poses a challenge of finding a suitable procedure for drying. Lyophilization was used in a first attempt to dry the material; however, this was not successful. Next, a rotary evaporator was used at low pressure (5 mbar), while maintaining the temperature of the water bath at 6 °C after using dry ice to cool the bath initially (see Figure 5). To facilitate the removal of the last amounts of water from the material, small amounts of acetonitrile were added to establish an azeotrope. The final dried material produced using these conditions met the purity requirement and was successfully used for further characterization of the impurity compounds.

FIGURE 5: Water can be removed from collected fractions using a rotary evaporator at low temperature by reducing the pressure (5 mbar) and addition of acetonitrile to establish an azeotrope
Summary
In this installment of “LC Troubleshooting,” we have discussed work aimed at analytical scale milligram-level isolation of two impurities present in a crude reaction mixture. The chromatographic method chosen for isolation at low temperature (10 oC) shows inferior chromatographic performance compared to the original method developed at 55 °C. However, sacrificing performance as measured by traditional chromatographic metrics was critical to avoid degradation of the target compounds during the isolation process. In the final step, the collected fractions were dried by rotary evaporator at low temperature and pressure, with the addition of acetonitrile to the highly aqueous fractions, thereby establishing an azeotrope to facilitate faster drying.
This work is also a helpful reminder that we must always consider the possibility of material degradation during the analysis when developing analytical methods. We usually look for conditions (for example, mobile phase, column, and temperature) that provide the best selectivity and maximum number of observed peaks. However, it is important to keep in mind that some of the observed peaks could be generated in situ because of the influence of buffer or temperature on compound instability.
References
(1) Bennett, R.; Ahmad, I. A. H.; DaSilva, J.; Figus, M.; Hullen, K.; Tsay, F. R.; Makarov, A.; Mann, B.; Regalado, E. L. Mapping the Separation Landscape of Pharmaceuticals: Rapid and Efficient Scale-Up of Preparative Purifications Enabled by Computer-Assisted Chromatographic Method Development. Org. Process Res. Dev. 2019, 23 (12), 2678–2684. DOI: 10.1021/acs.oprd.9b00351
(2) Kaufmann, M. Unstable Proteins: How to Subject Them to Chromatographic Separations for Purification Procedures. J. Chromatogr. B: Biomed. Sci. Appl. 1997, 699 (1–2), 347–369. DOI: 10.1016/S0378-4347(96)00512-9
(3) Sun, D.; Dauh-Rurng, W.; Peng, L.; Henry, Y.; Arvind, M. Reverse-Phase HPLC Purification for an Extremely Unstable Glucuronide Metabolite. J. Pharm. Biomed. Anal. 2021, 192, 113651. DOI: 10.1016/j.jpba.2020.113651
(4) Ahmad, I. A. H.; Losacco, G. L.; Shchurik, V.; et al. Trapping‐Enrichment Multi‐Dimensional Liquid Chromatography with On‐Line Deuterated Solvent Exchange for Streamlined Structure Elucidation at the Microgram Scale. Angew. Chem. Int. Ed. Engl. 2022,134 (21), e202117655. DOI: 10.1002/anie.202117655
(5) Guillarme, D.; Heinisch, S.; Rocca, J. L. Effect of Temperature in Reversed Phase Liquid Chromatography. J. Chromatogr. A 2004, 1052 (1–2), 39–51. DOI: 10.1016/j.chroma.2004.08.052
About the Column Editor

Dwight R. Stoll is the editor of “LC Troubleshooting.” Stoll is a professor and the co-chair of chemistry at Gustavus Adolphus College in St. Peter, Minnesota. His primary research focus is on the development of 2D–LC for both targeted and untargeted analyses. He has authored or coauthored more than 99 peer-reviewed publications and four book chapters in separation science and more than 150 conference presentations. He is also a member of LCGC’s editorial advisory board.

About the Authors

Fuh-Rong Tsay is a Senior Scientist in the Multiscale Separation team within the Enabling Capabilities department at Merck & Co. Inc. Fuh-Rong has a strong background in organic chemistry along with extensive experience in impurity isolation for small and large biomolecules. Besides, Fuh-Rong focuses her work on developing and optimizing analytical methods for purity testing.


Derek Henderson is a scientist in the Multiscale Separation team within the Enabling Capabilities department at Merck & Co. Inc. Derek is specialized in chromatography and large-scale purifications. Derek’s experience includes method development and preparative chromatography for small molecules as well as large biomolecules.


Fatima Naser Aldine is a Ph.D. Candidate in the Department of Chemistry and Center of Photochemical Sciences at BGSU. Fatima pursued a 12-week internship in the AR&D-department of Small Molecules at Merck & Co., Rahway, New Jersey.


Imad A. Haidar Ahmad is a Research Director within the Discovery Chemistry and Externalization department at Amgen, leading the Synthetics Separations team. His expertise is focused on method development, in-silico modeling, advanced analytical techniques, and purification.


New Method Explored for the Detection of CECs in Crops Irrigated with Contaminated Water
April 30th 2025This new study presents a validated QuEChERS–LC-MS/MS method for detecting eight persistent, mobile, and toxic substances in escarole, tomatoes, and tomato leaves irrigated with contaminated water.

University of Tasmania Researchers Explore Haloacetic Acid Determiniation in Water with capLC–MS
April 29th 2025Haloacetic acid detection has become important when analyzing drinking and swimming pool water. University of Tasmania researchers have begun applying capillary liquid chromatography as a means of detecting these substances.

Prioritizing Non-Target Screening in LC–HRMS Environmental Sample Analysis
April 28th 2025When analyzing samples using liquid chromatography–high-resolution mass spectrometry, there are various ways the processes can be improved. Researchers created new methods for prioritizing these strategies.


