Development of a Standardized Protocol for the Classification of Column Sets in Comprehensive Two-Dimensional Gas Chromatography
One-dimensional gas chromatography (1D-GC) stationary phases are generally classified according to their relative polarity into non-polar, semi-polar, and polar columns. In comprehensive two-dimensional gas chromatography (GC×GC), it is the polarity difference between the two tandem-assembled stationary phases that determines the selectivity of the column ensemble. This polarity difference is called orthogonality, and GC×GC column sets can be broadly categorized into four groups based on the direction of the serial coupling between the primary and secondary columns. A significant portion of the GC×GC column sets in use today are operated in forward-orthogonality mode, which means that the secondary column is more polar than the primary column. A growing number of reported GC×GC applications operate in reversed-orthogonality configurations, where the secondary column is less polar than the primary column. Very few examples exist of non-orthogonal column sets because of the fact that there is limited additional selectivity that the secondary column can offer over the separation that has already been achieved in the primary column when the two phases are either identical or close in polarity. The fourth group of GC×GC column sets, called hybrid orthogonality, involves the coupling of stationary phases with peculiar selectivity differences that manifest themselves in the bi-dimensional separation plots. In this work, we are presenting a normalized approach to GC×GC column set characterization that is based on the use of a reference mixture of standards called the Century Mix. The Century Mix contains 100 chemical probes of different functionalities that span a reasonable range of volatilities and polarities to capture the selectivity profile of any GC×GC column set. The Century Mix also contains important chemical probes that are used for 1D-GC column characterization (such as the Grob mix and the Rohrschneider/McReynolds compounds) to make some connections between the 1D-GC building block columns and the GC×GC column sets. We finally also outline some other important metrics of comparison that should be taken into consideration to assess the overall performance of a GC×GC system.
The goal of any chromatographic method is the full separation of all analytes of interest in the shortest period of time possible, with good peak shape attributes. Therefore, column selection is a very important decision in the method development workflow, and the classification of stationary phases is helpful in this process. In one-dimensional gas chromatography (1D-GC), the selectivity and performance characteristics of a stationary phase are provided through commonly used mixtures, such as the Rohrschneider/McReynolds compounds or the Grob test compounds (1,2). These mixtures contain chemical probes that provide information on the relative polarity of a stationary phase, where polarity is defined as the combined effect of a variety of specific interactions (electrostatic dipole, hydrogen bonding, electron donor-acceptor, and ionic or covalent bond formation) that are taking place between the solute and the stationary phase.
Selectivity in comprehensive two-dimensional gas chromatography (GC×GC) offers the advantage of increased separation power through the combined association of the properties of two coupled stationary phases. In addition, GC×GC separations are structured, and the two-dimensional (2D) contour plot chromatograms can be thought of as maps in which two principal gradients are displayed—the primary dimension is the volatility gradient axis, and the secondary dimension is the polarity gradient axis. This is why GC×GC chromatograms often feature discernible patterns of compounds with similar functional groups, which can be very useful in non-targeted analysis for the putative identification of unknown compounds before they can be confirmed with an analytical standard (3).
The exhaustive classification of all possible GC×GC column sets is not a practical undertaking because of the sheer number of possible combinations that exist. However, GC×GC column sets can be categorized into groups according to the relative polarities of the stationary phases that are being coupled, as shown in Figure 1a. A survey of 140 peer-reviewed publications from 2023 (using the keywords “comprehensive two dimensional gas chromatography” in SciFinder Scholar) shows that a significant portion of GC×GC (55%) projects are operated in “forward” (or “normal”) orthogonality mode, where the primary column is less polar than the secondary column. These column combinations include the non-polar/semi-polar (39%), non-polar/polar (16%), and the semi-polar/polar (0%) sections in Figure 1a. However, a significant increase in the number of “reversed” orthogonality configurations (semi-polar/non-polar, polar/non-polar, and polar/semi-polar) is noted (44%), which is more than triple the output from the last review by Focant and Stefanuto where this type of survey had been reported (4). This is a positive trend to observe because it means that GC×GC method developers are starting to use more of the possible selectivity that is available. Figure 1b shows a pie chart of application areas from the same survey data. Food and flavor methods seem to be on the rise (40% of the reported work), with a healthy balance between petrochemical, environmental, and bioanalytical applications. It should also be noted that forward and reversed orthogonality column sets are used in all these application areas, and the choice of the column set in GC×GC is more dependent on the nature and the diversity (in terms of functional groups) of the analytes to be separated than on the application area.

 Column-set classification; (b) Application area classification.")
FIGURE 1: 2023 GC×GC peer-reviewed publication survey results: (a) Column-set classification; (b) Application area classification.
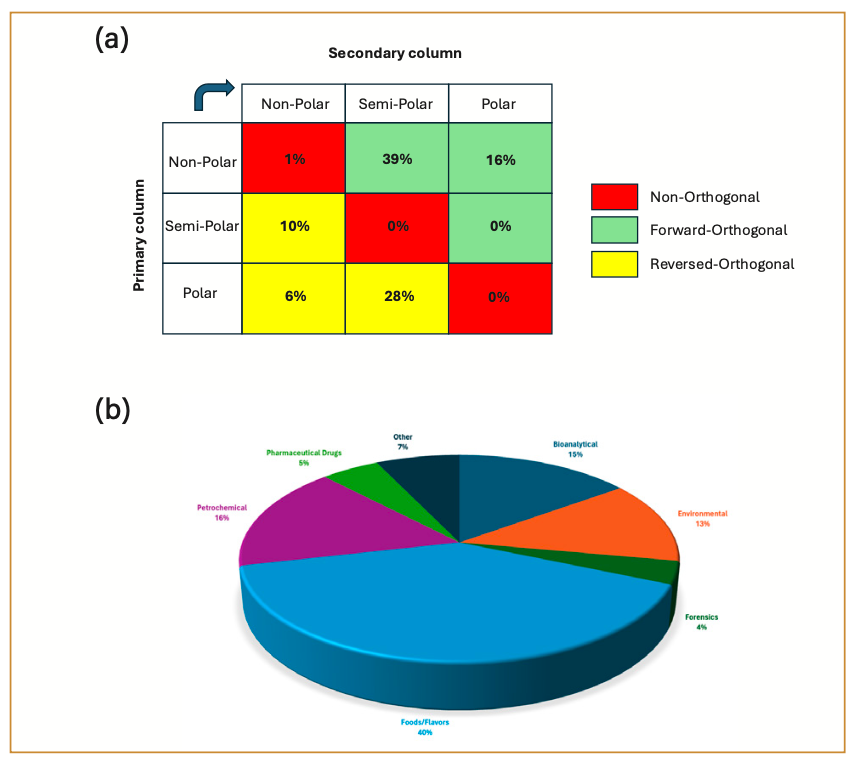
It has been generally accepted that the quality of a separation in GC×GC is dependent on the polarity difference (termed orthogonality) between the primary and secondary columns, and it is not surprising that the column sets that are classified as non-orthogonal (non-polar/non-polar, semi-polar/semi-polar, and polar/polar in Figure 1a) are not as highly used as the other combinations. However, demonstrations of non-orthogonal GC×GC systems do exist, and seem warranted when an on-column conversion of target analytes (because of a thermal or chemical process) into a related species is part of the analytical strategy for the method. Marriott and associates have recently reported the use of an Rxi-1 MS/DB-5 column combination for the monitoring of pyrethrin isomers in thermal isomerization reactions (5). At the other end of the polarity scale, Delmonte and associates demonstrated in 2013 the use of an SLB-111/SLB-111 column set for the separation of fatty acid methyl esters through the use of on-column hydrogenation in the modulator (6). It should also be noted that when columns with very different polarities are connected, the peak shapes of the analytes on one stationary phase can be affected on the other stationary phase, thus reducing the effective separation as well as the detectability limits. For these reasons, it is important to recontextualize our understanding of the orthogonality and selectivity concepts in GC×GC. It is our firm belief that there are more relevant column combinations to explore, and the goal of this work is the development of a standard mixture of compounds to help better categorize the grid of possible GC×GC column combinations.
The Century Mix
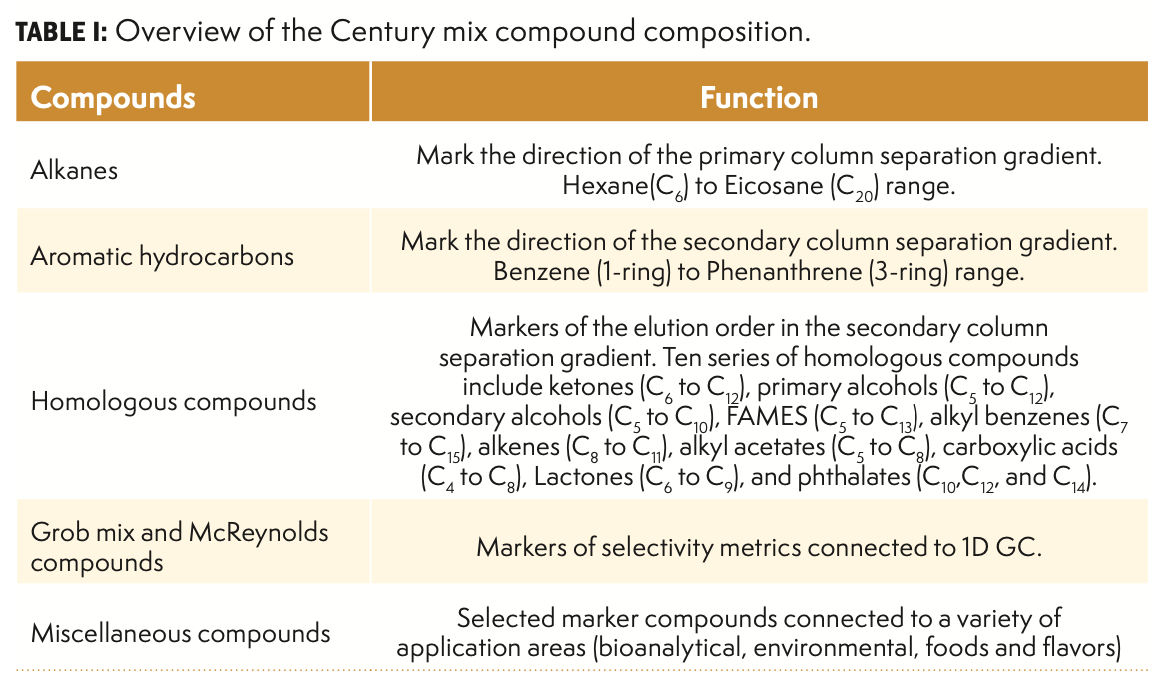
Even though petroleum-based samples (such as gasoline, diesel, or jet fuel) have been used for years to characterize GC×GC systems, it would be much more desirable to have a more standardized mixture for more effective comparisons. In 2003, an 80-compound mixture was developed for this purpose that was an extension of the Grob mix to better cover the 2D chemical space (7). This mixture, which was called the Phillips mix in honor of the late Prof. John B. Phillips (the inventor of GC×GC), has been progressively amended over the years for a variety of reasons, such as the removal of compounds that may reduce the stability of the overall mixture or the addition of compounds to capture a more reasonable portion of the 2D chemical space. The currently proposed mixture contains 100 compounds, and it is called the Century mix (see Table I for an outline of the compounds in the mixture in terms of their functions). Even though this mixture is not currently commercially available, an interagency collaboration effort supported by the U.S. Food and Drug Administration (FDA) and the National Institute of Standards and Technology (NIST) is underway for the development of this mixture to standardize instrument performance metrics in light of the many different variations of GC×GC instruments that now exist on the market today.

An important component of the use of this standard mixture is the normalization of operating conditions. At the current stage in the development, thermally modulated instruments are being used, and the parameters reported here are for these systems. The mixture is intended for use on all GC×GC systems, and an interlaboratory study is being planned for this evaluation. Helium was used as the carrier gas at a flow rate of 1.0 mL/min. Injections were performed on a split/splitless system (using a 100:1 split), and the injection volume was 1 µL. The primary column dimensions were 30 m in length, with a 250 μm i.d. and a 0.25 µm film thickness. The secondary column dimensions were two meters in length, with a 250 µm i.d. and a 0.25 µm film thickness. The primary column temperature program started at an initial temperature of 40 °C for 2 min, then ramped up at a rate of 5 °C/min to 230 °C where it was held for 10 min. The analysis run time was 50 min, and the secondary column oven was programmed at a rate 5 °C higher than the primary column oven. The modulator temperature offset was 15 °C higher than the primary oven, with a hot pulse time of 0.6 s. The modulation period was adjusted based on the elution time of the most retained analytes to avoid any wraparound peaks. The transfer line temperature into the time-of-flight mass spectrometer (TOF-MS) was 280 °C, and spectra were collected at a rate of 100 spectra/sec over a range between 35 and 500 amu. The ion source temperature was 225 °C, and the electron ionization energy was 70 eV.
Figure 2a shows a contour plot chromatogram of the Century mix on a forward orthogonality column set in which the primary column is an Rxi-5Sil MS primary column (30 m, 250 µm i.d., 0.25 µm film) connected to an Rxi-17Sil MS (2m. 250 µm i.d., 0.25 µm film) secondary column. The primary column separation range is marked by the alkanes (eluting at the bottom of the chromatogram) between C6 (hexane) and C20 (eicosane). The direction of the secondary column gradient is marked by the aromatic hydrocarbons (benzene, naphthalene, and phenanthrene), which are eluted in increasing second dimension time, which indicate that secondary column polarity is higher than the first dimension polarity. The selectivity of the column set can be described by the elution order of the homologous series of compounds. In this case, the elution order goes as follows: alkanes < alkenes < secondary alcohols < primary alcohols < FAMES < carboxylic acids < ketones < alkylbenzenes < lactones < phthalates. The peak shapes of all the compounds in the mixture seem to be reasonably symmetrical, which indicates an acceptable separation. In addition to these basic comparison parameters, the other probes in the Century mix are used to establish connections to the 1D-GC metrics as well as other performance metrics (such as peak shape and efficient use of the two-dimensional chemical space), but these will not be discussed in detail in this paper.

FIGURE 2: GC×GC contour plot chromatograms of two forward-orthogonality column sets, with accompanying peak-apex plots in which some of the homologous series are identified (for the aromatic hydrocarbon compounds, B is benzene, N is naphthalene, and P is phenanthrene). Retention times for the primary and secondary axes are in seconds. (a) Rxi-5Sil MS/Rxi-17Sil MS column combination; (b) ZB-5 MS/VF-200 column combination.
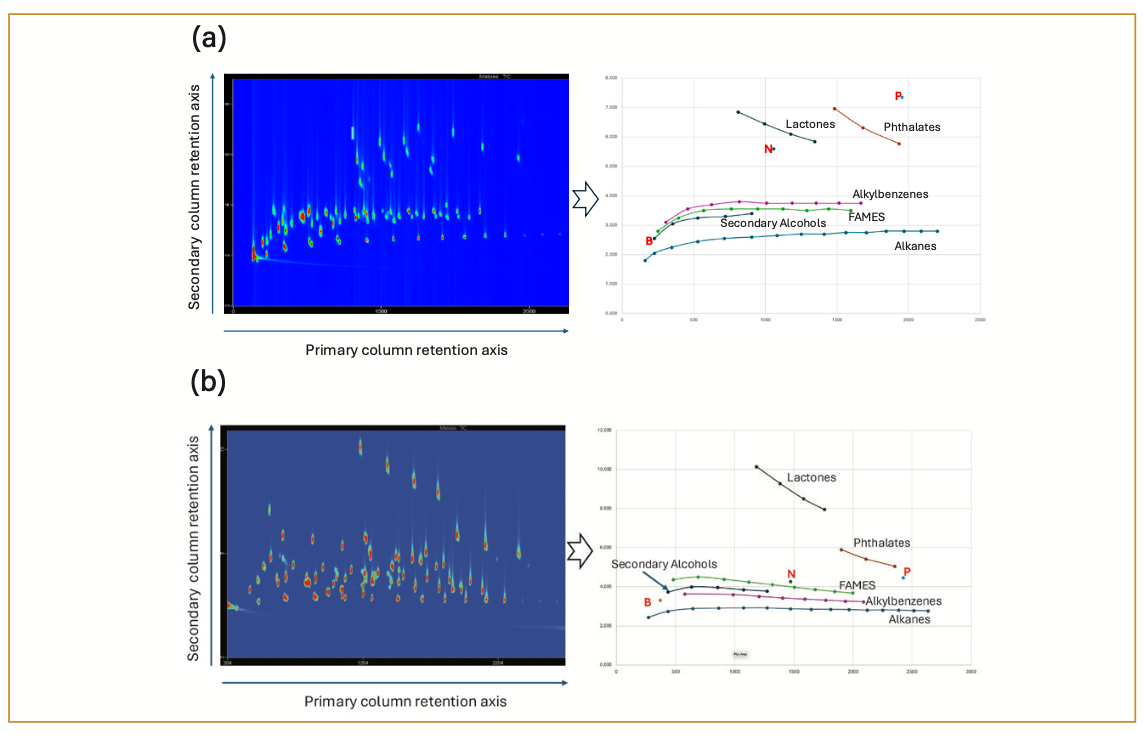
Figure 2b shows the contour plot chromatogram of the Century mix on a different forward orthogonality column set than the one shown in Figure 2a. The primary column in this case is a ZB-5MS column (30 m, 250 µm i.d., 0.25 µm film) that is connected to a VF-200 (2 m, 250 µm i.d., 0.25 µm film) secondary column. Even though both columns belong to the “non-polar/semi-polar” category, the 2D separation gradient that is produced in Figure 2b is not identical to the one in Figure 2a, meaning that the selectivity of the second column set is slightly different than the first column set. One noticeable indicator of the selectivity difference is the elution order of the homologous series, which is as follows: alkanes < alkenes < alkylbenzenes < primary alcohols < secondary alcohols < carboxylic acids < FAMES < ketones < phthalates < lactones. It is interesting to note this elution order change for columns in the same classification category because it indicates that selectivity in GC×GC is not locked into a given general class of stationary phases, and that these gradients should be investigated in a little more detail. It will also be interesting to investigate the additional changes to the selectivity that can be produced with different operating parameters now that we can monitor the differences between chromatograms of all target analytes in the Century mix.
Predictive GC×GC Chromatograms
Several groups have worked on predictive modeling in GC×GC over the past few years (8–12). In this paper, we would like to describe a very simple method to generate predictive GC×GC plots that might be helpful in looking at combinations of columns that may not have been attempted yet, but that may present some interesting selectivity options. The only requirement for this method is the generation of two chromatograms on the stationary phases of interest at the operating conditions described in Section 2 of this paper. These chromatograms will be obtained for a given set of target analytes of interest, and a set of alkanes to calculate retention index values for each compound, as shown in Table II. The predictive chromatogram is a representation of the temperature-programmed retention index of the first column and the specific index (ΔI) in the second dimension, which is obtained by subtracting the retention index of the first column from the retention index of the second column. The predictive GC×GC plots are representations of relative positions in the 2D plane (not exact retention times), and they can be helpful in determining which column combinations may offer some interesting selectivities. These plots can also provide a valuable visual estimation of the occupation of the chemical space for a set of target analytes when comparing different column sets. The value of these predictive plots is significant for individuals evaluating the potential utility of GC×GC in laboratories that do not have access to an instrument.

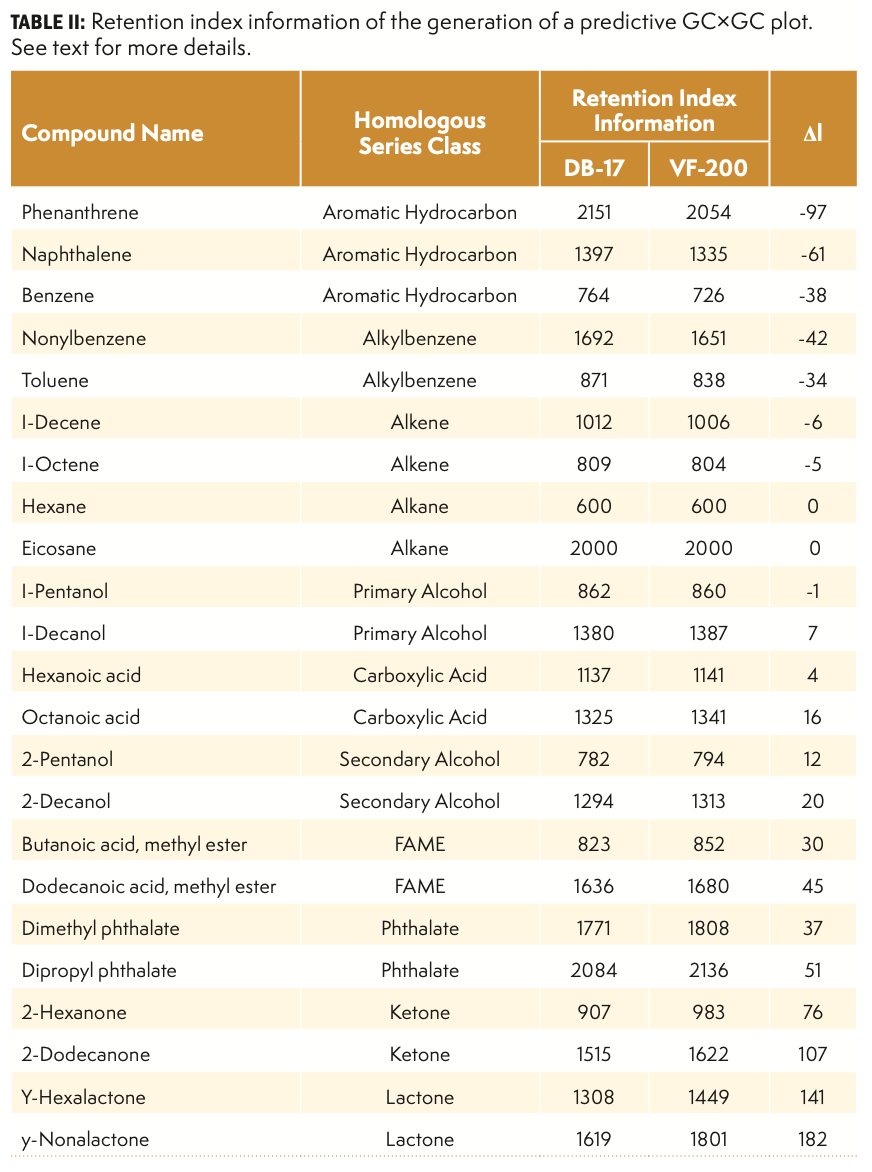
Figure 3a shows a predictive plot for a “hybrid” orthogonality column set, which was obtained with an Rtx-17 first dimension column and a VF-200 second dimension column (this plot uses the data that was generated in Table II for the full set of Century Mix compounds). Both of these columns are considered semi-polar, and traditionally would not be thought of as “orthogonal” enough to be useful in GC×GC. From the ΔI data in Table II, it is noteworthy that there are values above and below the alkanes, which is not commonly observed in GC×GC chromatograms. Forward orthogonality systems typically have the alkanes at the bottom of the chromatogram (least retained), whereas reversed orthogonality systems have the alkanes at the top end of the chromatogram (most retained). However, in 2012, Seeley and associates demonstrated an example of a separation using two semi-polar stationary phases (DB-210/HP-50 combination) that was able to separate fatty acid methyl ester (FAME) impurities from petroleum samples (13). The FAME compounds were selectively distanced from the rest of the petroleum sample at the bottom of the chromatogram, which was a very unusual result. Using the Century mix compounds, we observe a similar result, except in this case it is the homologous series of alkylbenzenes and alkenes that elute below the alkanes. The FAME compounds actually elute above the alkanes because of the fact that the trifluoropropyl stationary phase is the secondary column and gives reversed selectivity to the Seeley column set, in which the trifluoropropyl stationary phase was used as the primary column.

FIGURE 3: GC×GC Century mix analysis on a reversed-hybrid orthogonality column set. (a) Predictive plot in which some of the homologous series are identified (for aromatic hydro- carbon compounds, B is benzene, N is naphthalene, and P is phenanthrene); (b) Peak-apex plot in which some of the homologous series are identified. Retention times for the primary and secondary axes are in seconds; (c) Contour plot chromatogram. Retention times for the primary and secondary axes are in seconds.
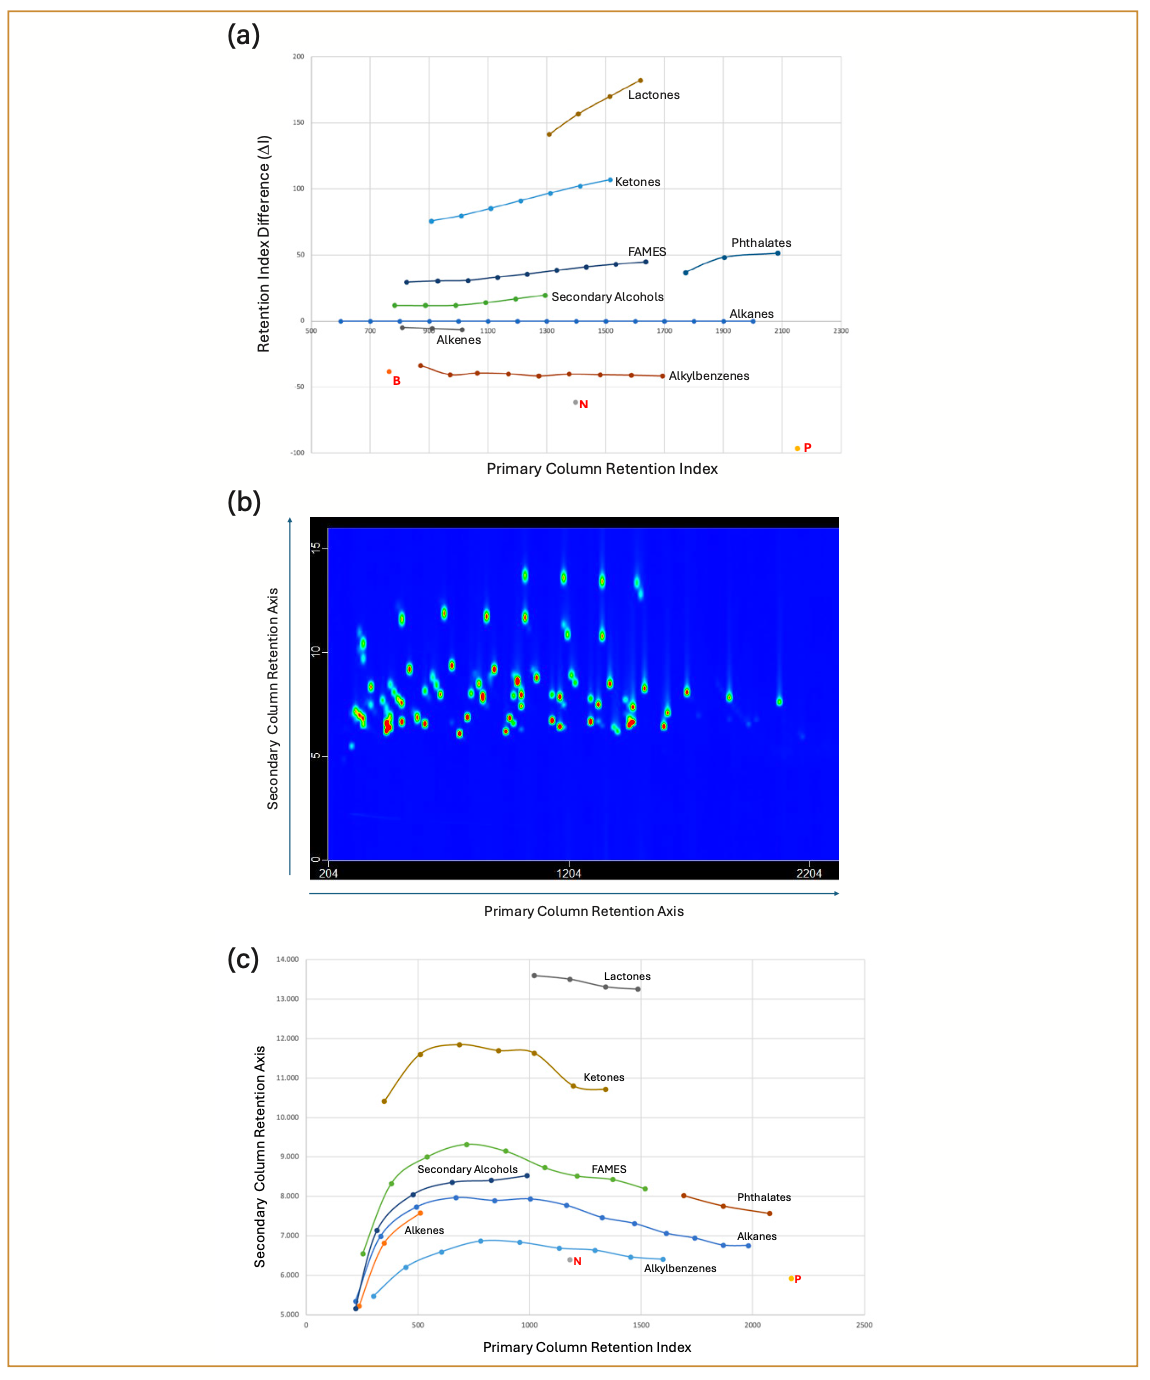
The elution order of the rest of the homologous compound series is also correctly predicted in the plot (shown in Figure 3b). An actual contour plot of the GC×GC chromatogram is shown in Figure 3c, although the identity of the target analytes is harder to discern, because of the presence of many of the other compounds besides the homologous series of compounds. In anticipation of the unusual retention patterns that are to be expected in previously untried column combinations, we have prepared a set of confirmation mixtures that can be run separately in order to isolate specific functionalities when necessary. These subsets of the full mixture will also be important when using single channel detectors (such as flame ionization detectors [FIDs]) that do not provide the additional information on peak identity that a mass spectrometer (MS) is capable of generating. An internal standard (Quinoline) is also an available compound that can be added to the Century mix to generate signal ratio information that can be helpful when comparing the signal intensities from different detectors. This type of information is valuable when evaluating the potential of newly synthesized stationary phases, such as the polymeric ionic liquid phases recently reported by Ryoo, Anderson, and associates (14).
Conclusion
A better understanding of the separation gradients at play in the second dimension of the GC×GC chemical space is necessary to improve our analytical strategies for method development. We hope that the development of this standardized mixture will be helpful in advancing our knowledge of column selectivity, and we plan to investigate more column sets to gain further insight into the relationship between orthogonality and separation efficiency in GC×GC. We also firmly believe that a database of retention index information obtained at standard operating conditions needs to be developed on a variety of stationary phases in order to help with the task of column selection. Information on metrics such as peak asymmetry and peak width at a nominal concentration should also be available in this database to help with the development of the next generation of predictive modeling for GC×GC.
References
(1) McReynolds, W. O. Characterization of Some Liquid Phases. J. Chrom. Sci.1970, 8, 685–691. DOI: 10.1093/chromsci/8.12.685
(2) Grob, Jr., K..; Grob, G.; Grob, K. Comprehensive, Standardized Quality Test for Glass Capillary Columns. J. Chrom. A 1978, 156 (1), 1–20. DOI: 10.1016/S0021-9673(00)83120-9
(3) Duangkumpha, K.; Jariyasopit, N.; Wanichthanarak, K.; Dhakal, E.; Wisanpitayakorn, P.; Thotsiri, S.; Sirivatanauksorn, Y.; Kitiyakara, C.; Sathirapongsasuti, N.; Khoomrung, S. GC×GC-TOFMS Metabolomics Analysis Identifies Elevated Levels of Plasma Sugars and Sugar Alcohols in Diabetic Mellitus Patients with Kidney Failure. J. Biol. Chem. 2022, 298 (10), 102445. DOI: 10.1016/j.jbc.2022.102445
(4) Stefanuto, P.-H.; Focant, J.-F. Columns and Column Configurations. Sep. Sci. Tech. 2020, 12, 69–88. DOI: 10.1016/B978-0-12-813745-1.00003-9
(5) Byrnes, N. A.; Wu, Y.; Nolvachai, Y.; Marriott, P. J. Exploring Thermal Isomerisation in Gas Chromatography Analyses using Natural Pyrethrins: Comparison of Comprehensive Two-Dimensional and One-Dimensional Gas Chromatography. J. Chrom. A. 2023, 1708, 464369. DOI: 10.1016/j.chroma.2023.464369
(6) Delmonte, P.; Fardin-Kia, A. R.; Rader, J. I. Separation of Fatty Acid Methyl Esters by GC-Online Hydrogenation × GC. Anal. Chem. 2013, 85, 1517–1524. DOI: 10.1021/ac302707z
(7) Dimandja, J.-M. D.; Clouden, G. C.; Colón, I.; Focant, J.-F.; Cabey, W. V.; Parry, R. C. Standardized Test Mixture for the Characterization of Comprehensive Two-Dimensional Gas Chromatography Columns: the Phillips Mix. J. Chrom. A 2003, 1019, 261–272. DOI: 10.1016/j.chroma.2003.09.027
(8) Dorman, F. L.; Schettler, P. D.; Vogt, L. A.; Cochran, J. W. Using Computer Modeling to Predict and Optimize Separations for Comprehensive Two-Dimensional Gas Chromatography. J. Chrom. A. 2008, 1186, 196–201. DOI: 10.1016/j.chroma.2007.12.039
(9) Burel, A.; Vaccaro, M.; Cartigny, Y.; Tisse, S.; Coquerel, G.; Cardinael, P. Retention Modeling and Retention Time Prediction in Gas Chromatography and Flow-Modulation Comprehensive Two-Dimensional Gas Chromatography: The Contribution of Pressure on Solute Partition. J. Chrom A. 2017, 1485, 101–119. DOI: 10.1016/j.chroma.2017.01.011
(10) Arey, J. S.; Aparicio, A. M.; Vaiopoulou, E.; Forbes, S.; Lyon, D. Modeling theGC×GC Elution Patterns of a Hydrocarbon Structure Library to Innovate Environmental Risk Assessments of Petroleum Substances. Environ. Sci. Technol. 2022, 56, 17913–17923. DOI: 10.1021/acs.est.2c06922
(11) Gaida, M.; Franchina, F. A.; Stefanuto, P.-H.; Focant, J.-F. Top-Down Approach to Retention Time Prediction in Comprehensive Two-Dimensional Gas Chromatography-Mass Spectrometry. Anal. Chem. 2022, 94, 17081–17089. DOI: 10.1016/j.chroma.2008.07.060
(12) Seeley, J. V.; Libby, E. M.; Hill Edwards, K. A.; Seeley, S. K. Solvation Parameter Model of Comprehensive Two-Dimensional Gas Chromatography Separations. J. Chrom. A. 2009, 1216, 1650–1657. DOI: 10.1016/j.chroma.2008.07.060
(13) Seeley, J. V.; Bates, C. T.; McCurry, J. D.; Seeley, S. K. Stationary Phase Selection and Comprehensive Two-Dimensional Gas Chromatographic Analysis of Trace Biodiesel in Petroleum-Based Fuel. J. Chrom. A. 2012, 1226, 103–109. DOI: 10.1016/j.chroma.2011.07.075
(14) Ryoo, D.; Eor, P.; Bara, J.; Anderson, J. L. Comparison of Olefin/Paraffin Separation by Ionic Liquid and Polymeric Ionic Liquid Stationary Phases Containing Silver (I) Ion using One-Dimensional and Multidimensional Gas Chromatography. J. Chrom. A. 2023, 1698, 463996. DOI: 10.1016/j.chroma.2023.463996
About the Authors
Jean-Marie Dimandja, Jeffrey Archer, John Casanova, and Eric Posenecker are with the US Food and Drug Administration’s Office of Regulatory Affairs. Pierre-Hugues (PH) Stefanuto and Jean-François Focant are with the Department of Chemistry at the University of Liege in Liege, Belgium. Daniel Struk and Peter Hesketh are with the School of Mechanical Engineering at the Georgia Institute of Technology in Atlanta, Georgia. Christopher Heist is with the Intelligent Sustainable Technologies Division of the Georgia Tech Research Institute in Atlanta, Georgia. Catherine Rimmer is with the Organic Chemical Metrology Group at the National Institute for Standards and Technology (NIST) in Gaithersburg, Maryland. Direct correspondence to: Jean-Marie.Dimandja@fda.hhs.gov.


.")


Analysis of Pesticides in Foods Using GC–MS/MS: An Interview with José Fernando Huertas-Pérez
December 16th 2024In this LCGC International interview with José Fernando Huertas-Pérez who is a specialist in chemical contaminants analytics and mitigation at the Nestlé Institute for Food Safety and Analytical Sciences at Nestlé Research in Switzerland, In this interview we discuss his recent research work published in Food Chemistry on the subject of a method for quantifying multi-residue pesticides in food matrices using gas chromatography–tandem mass spectrometry (GC–MS/MS) (1).

The Use of SPME and GC×GC in Food Analysis: An Interview with Giorgia Purcaro
December 16th 2024LCGC International sat down with Giorgia Purcaro of the University of Liege to discuss the impact that solid-phase microextraction (SPME) and comprehensive multidimensional gas chromatography (GC×GC) is having on food analysis.

