Certificate of Analysis (CoA) and Calculations for Small-Molecule Drugs
The Certificate of Analysis (CoA) is a crucial Good Manufacturing Practice (GMP) document for a batch of drug substances or products in development or production. It contains essential quality information and a summary of specifications and testing results. This article describes the contents and associated calculations of CoAs for small-molecule drugs. It explains how these documents help to ensure drug quality in the supply chain.
This installment is the seventh article in the white paper series on “The Pharmaceutical Industry for the Analytical Chemist,” focusing on separation science in drug development, pharmaceutical analysis, regulatory compliance, and method development. The first six papers, published in 2022–2023, were overviews of the pharmaceutical industry, drug discovery and development processes, regulations, public standards, and internal compliance processes (1–6). Papers #7 and #8 will be on Certificates of Analysis (CoAs) and how to generate a well-written analytical procedure for regulated testing, respectively.
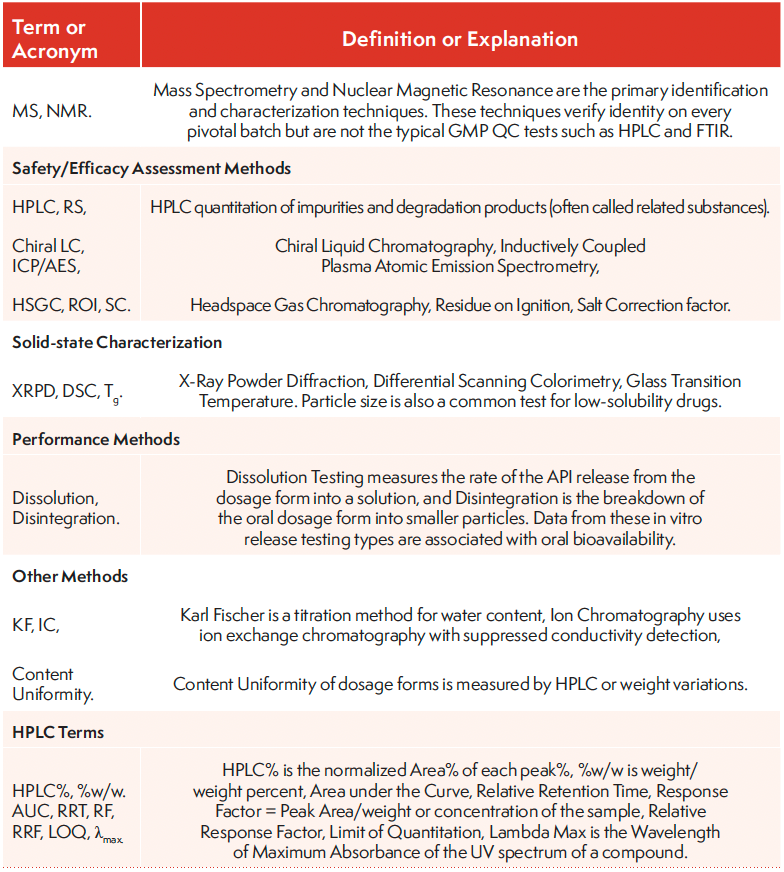
A CoA is a drug quality document for excipients, drug substances (DS), drug products (DP), and packaging components used in drug development and production. A CoA contains critical information on identity, origin, production/expiry date, specifications, storage conditions, and testing methods or results. The CoA of a drug is likened to the passport of a traveler in that it certifies that the batch is of sufficient quality to allow its shipment in the supply chain of clinical trial materials (CTM) or final products. This article describes the content of COAs and associated calculations for DS and DP. It explains the intent of CoAs for Good Manufacturing Practice (GMP) compliance (7) to ensure the safety and efficacy of the final drug products. Table I is a list of common acronyms used in the text (all tables are accessible through the QR code at the end of the article). Test method terms are categorized as those for identification, safety and efficacy assessments, solid-state characterization, performance, and others. The testing methods and their use are further elaborated in the text.
Table I: Glossary of terms and abbreviations
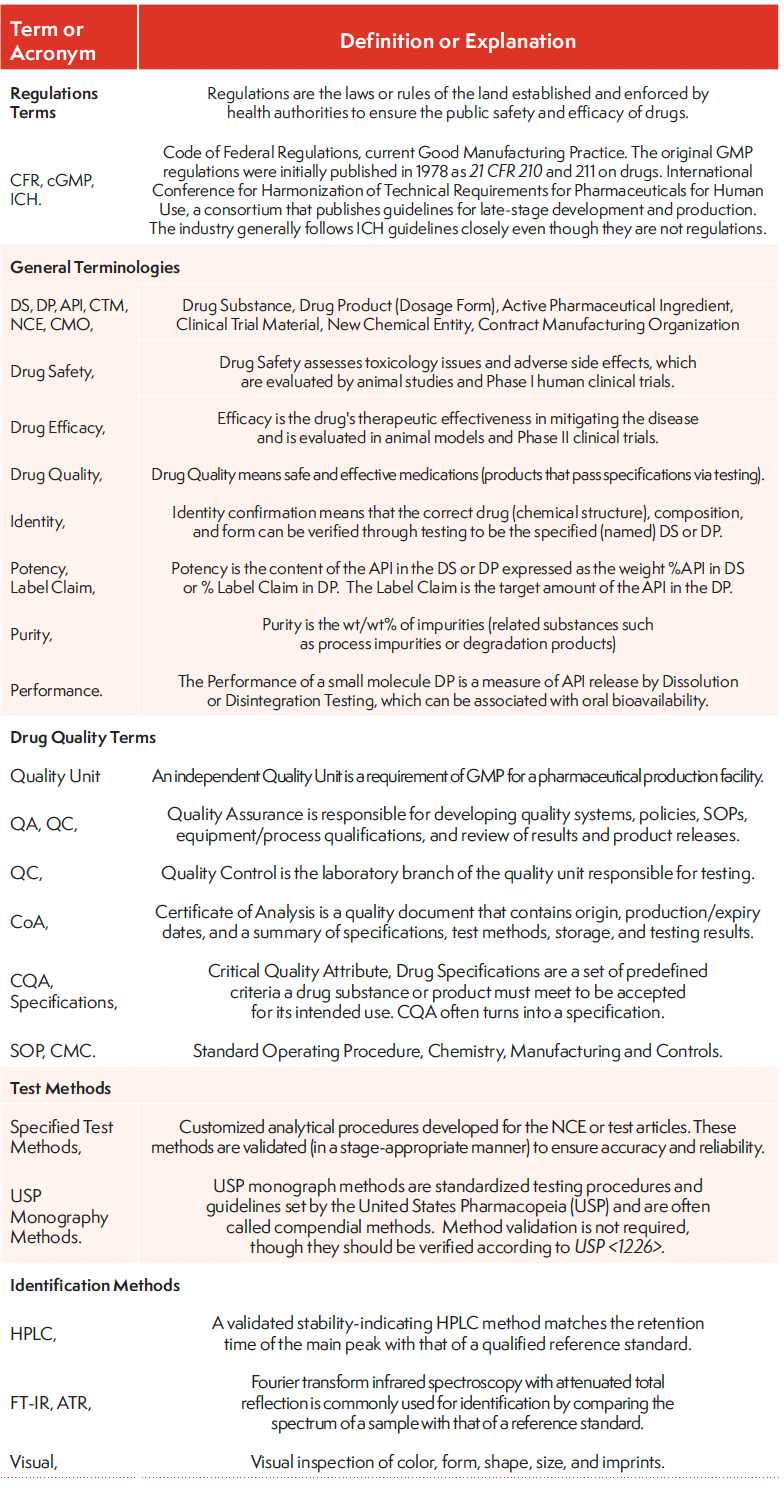
Table I, Continued: Glossary of terms and abbreviations
Case Studies from an Early-Phase Small-Molecule Development Project: Background Information
A case study from my experience as a chemistry, manufacturing, and controls (CMC) analytical team lead supporting an early-phase small-molecule oncology drug development project was used to illustrate how CoAs expedite quality documentation of testing methods and results. The new chemical entity (NCE) is a multichiral molecule with a complex synthetic scheme to ensure chiral purity, requiring the rapid development of more than forty high-performance liquid chromatography (HPLC) achiral and chiral methods to support process chemistry development (3, 8–10). The NCE is a hygroscopic basic compound (10) developed as a monochloride salt with partial crystallinity. The Phase I CTM DP was the Powder in a Capsule (PIC) dosage form. Refrigeration and storage with a desiccant were required for DS and DP to eliminate moisture absorption of the hygroscopic active pharmaceutical ingredient (API).
CoA of a Reference Standard of an NCE
During early development (Phase 0), a highly purified reference standard of an NCE is prepared (for example, ~50 g for the first process scale-up API batch) to serve as a calibration reference standard for identity and potency assays of subsequent batches (8,9). The reference standard undergoes substantial characterization and laboratory testing to establish the compound’s identity unequivocally and a purity factor (such as, for example, on an anhydrous free-base basis). This reference standard batch is stored under specified conditions with appropriate packaging, and is requalified periodically. Table II shows an example of the CoA of a reference standard, which includes batch information, test methods, test results, and a calculated purity factor using a mass balance approach. The content of the CoA and explanations of the methodologies and calculations are in the commentary section.
Table II: CoA of a DS Batch in Early Development
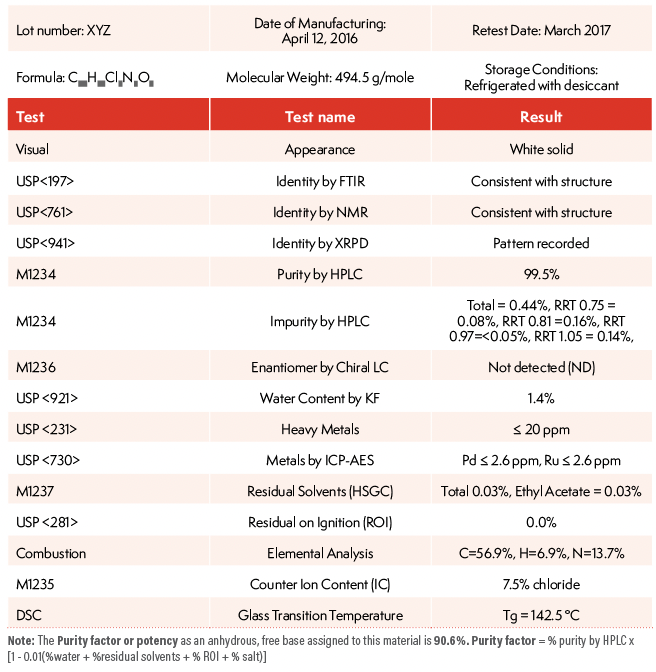
The purity factor or potency as an anhydrous, free base assigned to this material is 90.6%. Purity factor = % purity by HPLC x [1 - 0.01(%water + %residual solvents + %residue on ignition [ROI] + % salt)].
The Content of Reference Standard CoA
The CoA of a reference standard contains batch information and test results of several categories of methods, typically found in a CoA of a DS batch. Note that the testing included in CoAs may vary based on the relevance of the materials.
- Batch Information: Batch number, date of manufacturing, retest date, manufacturing location, storage, and packaging requirement.s
- Compound Information: Chemical formula and molecular weight of the NCE.
- Identity: Visual, Fourier transform infrared spectroscopy (FT-IR) (attenuated total reflection/reflectance [ATR]), nuclear magnetic resonance (NMR), mass spectrometry (MS).
- Safety: Purity (by HPLC and chiral liquid chromatography [LC]), heavy metals (limit test), heavy metals (catalysts) (inductively coupled plasma atomic emission spectroscopy [ICP-AES]), residual solvents (headspace gas chromatography [HSGC]), ROI.
- Solid State Characterization: X-ray powder defraction (XRPD) and glass transition temperature (Tg) (differential scanning colorimetry, [DSC]).
- Others: Water (Karl Fischer [KF]), counter ion (for salts by ion chromatography [IC]).
- Elemental Analysis: A traditional combustion test serves as a cross-check.
Commentaries
- Batch Information: The manufacturing location is not included here, as the batch is synthesized internally. Other information, such as material name, company item number, CoA number, contract manufacturing organization (CMO) name and number, and safety precautions, can be included.
- Compound Information: The purported chemical formula and molecular weight must be confirmed and verified by high-resolution accurate mass MS and NMR (characterization test).
- Identity: FT-IR (ATR) is a QC test for DS, while 2D-NMR for protons and C-13 is used by a subject matter expert (SME) who assigns every H and C atom in the molecule. The strcuture elucidation SME typically signs off on the identity report of every pivotal batch of DS, which may or may not be included in the CoA or regulatory filings.
- Safety: Potency, Purity, and Impurities (by HPLC): Both potency and impurity content data typically come from a single stability-indicating method: reversed-phase liquid chromatography (RPLC) with UV detection that separates all impurities from the API (8). HPLC Area% rather than %w/w data is considered sufficient for early-phase methods.
- Enantiomer Content by Chiral LC: The % of the enantiomer of the API is determined by a chiral LC method, while the diastereomer contents for multi-chiral NCE are determined by the primary RPLC-UV (RPC/UV) stability-indicating RPLC-UV method. Heavy metals (limit test): Heavy metals are determined by USP <231>, a wet chemistry limit test (11). USP <231> is currently replaced by a modernized USP <232> and <233>.
- Metals Used as Catalysts (ICP-AES): Metals used in the synthesis process are safety concerns and must be controlled below 20 ppm levels. Today, ICP-MS is generally preferred for this test.
- Residual Solvents (HSGC): Residual solvents used in the synthesis and final crystallization step are safety concerned and must be kept <0.5% for most common solvents using headspace GC. Loss on drying (LOD) can be used for class 3 solvents below 0.5%.
- ROI: Residue on Ignition is a wet chemistry gravimetric test for the general determination of inorganics is an organic compound sample. Any levels >1.0% may require further investigation on its origin.
- Solid-State Characterization: The XRPD pattern is used to characterize the material’s crystalline structure and the degree of crystallinity or amorphous content. Tg can be a useful guide for selecting stability storage conditions to prevent solid form transitions.
- Others: Water content (by KF titration using coulometric detection) is required; Counter ion determinations are also needed for any API, which is a salt typically performed by IC (or microtitration for halides).
Approval and review signatories are redacted in this CoA. Note that a salt correction factor (SC) is used for purity factor calculations. For instance, the theoretical % of counter ion in a 100% monohydrochloride salt of the API = (wt of Cl ion/formula weight of the monochloride salt) x 100% = 35.5 / 494.5 x 100 % = 7.2% w/w. However, the measured values of the chloride counter ion could be higher or lower. The SC of the monochloride salt is, therefore, [1 - 0.01(%w/w of the counter ion)] or [1 - 0.01(7.2%)] or 0.93 to convert monochloride to free base. Alternately, the SC can be 1.08 for conversion in the reversed direction.
How to Calculate the Purity Factor
The purity factor or potency of the reference standard is determined as an anhydrous free base basis using the formula shown below via a mass balance approach to eliminate the contributions to the weight of the compound from water, residual solvents, ROI, and counter ion content (all non-efficacious content). The assigned purity factor to this reference standard is 90.6%.
Purity factor calculation = % purity by HPLC x [1 - 0.01(% water + % residual solvents +% ROI + % salt)
Purity factor = 99.5% x (1 - 0.01(1.4% + 0.03% + 0% + 7.5%) = 90.6%
CoA of a DS Batch in Early Development
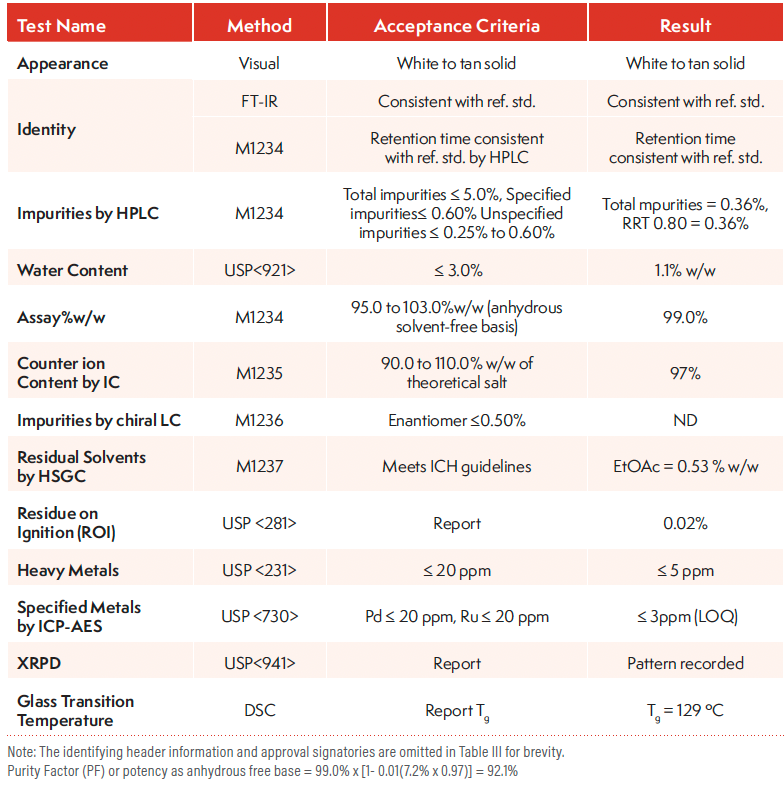
The CoA content of a DS batch shown in Table III is similar to that of a reference standard in Table II. Here, a comparative HPLC method using the reference standard as a calibrant is used to identify and determine API (potency) and impurities (8). Acceptance criteria (specifications) are listed and must be met for the batch to be acceptable for the intended use (for example, as a CTM). Specifications for early development are less stringent than those from the International Conference for Harmonization of Technical Requirements for Pharmaceuticals for Human Use (ICH) guidelines (12), and recommendations from the IQ Consortium or the US FDA can offer sound guidance in setting realistic specifications for early-phase CTM (9, 13–15). Many quality attributes can have acceptance criteria, such as “report,” to ensure initial data collection for early batches, which allows appropriate specifications to be set later.
Table III: CoA of a DS Batch in Early Development
Calculations of Assay and Impurities in DS
The equation for DS Assay w/w value (as is) as a monochloride salt is shown below.

The salt correction factor is required because the purity factor of the reference standard in the assay is expressed on an anhydrous free base basis. At the same time, the samples are weighed out “as is,” containing the monochloride form with water and other impurities.
The reported assay% w/w (anhydrous solvent-free) in the CoA required another correction step to eliminate the contributions of water, residual solvents, and ROI from the DS batch as the monochloride salt of the API.

Nevertheless, this DS batch’s purity factor on an anhydrous free-base basis (often required for formulation development) required an additional salt correction factor.
Purity factor as an anhydrous free base = Assay% w/w (anhydrous solvent free) x salt correction factor = [1 - 0.01(theoretical wt% of Cl in the compound x relative% of counter ion found as decimal)]
Purity factor or potency as anhydrous free base = 99.0% x [1 - 0.01(7.2% x 0.97)] = 92.1%
Alternatively, one can use the absolute mass balance approach shown in Table I to calculate the purity factor.
Purity factor calculation as anhydrous free base = % purity by HPLC x [1 - 0.01(%water + %residual solvents +%ROI + %counter ion)]
Calculation and Reporting of Impurities in the DS Batch
Calculating impurities in the DS batch is straightforward using HPLC area % are under the curve (AUC) in early-phase development. According to ICH Q3A (R2)(13), the reporting threshold is 0.05% in DS, which should be the minimum achievable limit of quantitation (LOQ) of the HPLC/UV stability-indicating method. The assumption here is that the impurities or degradation products of the API (related substances) should have a similar UV response or a relative response factor (RRF) near 1.0 (8). This is not a flawed supposition since, in most cases, the chromophore of the related substance is preserved in most degradative pathways (the λmax of the API is typically the monitoring wavelength). For Phase 2 methods, where synthetic reference standards of key impurities are available, the analyst can measure the RRF of the impurities vs API for more accurately determining some impurities with different chromophoric properties (e.g., conversion of an alcohol into a ketone). It is also customary to name the unidentified impurity as its relative retention time (RRT), indexed to the API (for example, RRTAPI = 1.00) (8).
CoA Sign-Off Process
While the laboratory analyst performs the testing under a GMP environment, and the results are checked and signed off by the quality control (QC) manager, most CoA are prepared and signed by quality assurance (QA). The level of GMP compliance oversight is stage-appropriate, meaning scrutiny and cross-checking increase in late-stage development.
Example of CoA of a DP in Early Development
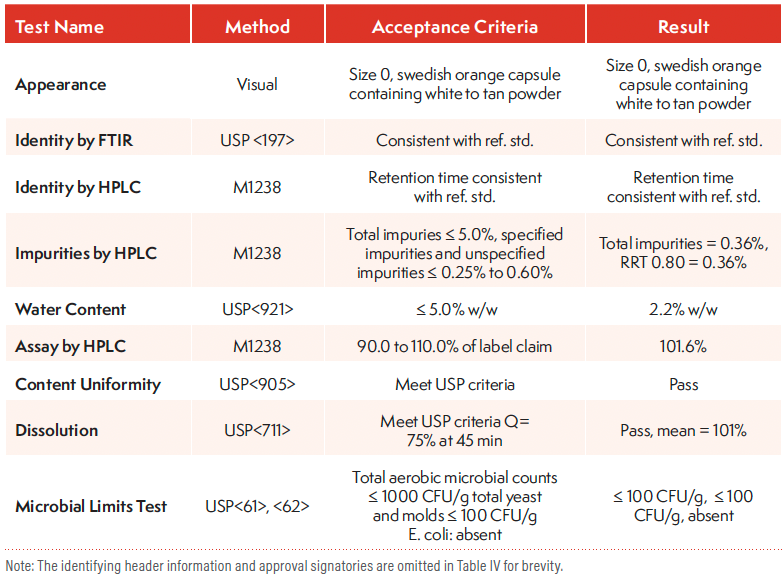
Table IV shows the CoA of a DP (100-mg capsule) in early development. In addition to identity, potency, and impurities testing, additional tests include dissolution (performance), content uniformity, and microbial limit tests. Typical safety tests, such as heavy metals or residual solvent or solid-state characterization tests, such as XRPD and DSC, are unnecessary, since the DP is manufactured from released DS batches in which these attributes have been controlled or within specifications.
Table IV: CoA of 100-mg Capsule DP in Early Development
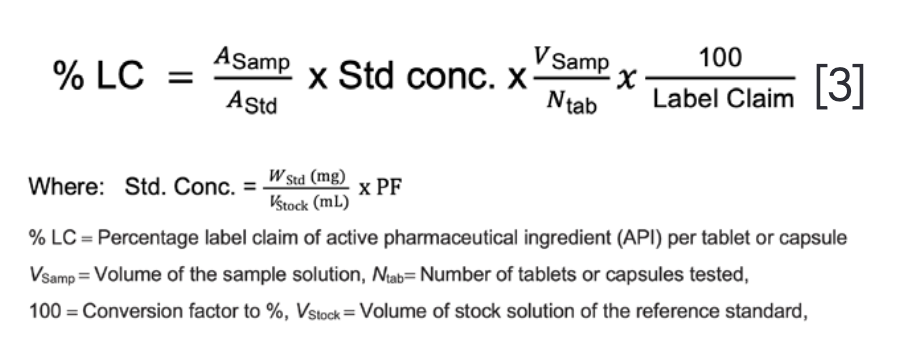
Calculations of Potency as a Percentage of Label Claim
A composite assay of 10–20 units is typically used to minimize unit-to-unit variation for oral dosage forms such as tablets or capsules. Alternately, a portion of the composite ground powder equal to the average tablet weight (ATW) may be extracted and assayed. Quantitative extraction of the API from the solid formulations is critical.
Equations for potency calculations as % label claim (LC) for DP are shown below.
Disclaimer
The case study and examples of CoAs came from an early-phase development candidate to illustrate the methodologies and results. They also reflect the critical quality attributes of that particular NCE, which may be less or not applicable to other small-molecule drugs.
Conclusions and Summary
This installment describes the Certificate of Analysis (CoA), one of the most common and critical quality documents in the quality control of pharmaceuticals; examples are provided to illustrate the contents, test methods, specifications, storage conditions, and test results of a reference standard, drug substance, and drug product batch.
Acknowledgments
The authors thank the reviewers for providing timely technical and editorial inputs to this article: Saicharan Aitha of Nurix Therapeutics, Leon Doneski and Kirby Wong-Moon of Arcutis Biotherapeutics, Chengli Zu of Corteva, Alice Krumenaker of Hovione, David VanMeter of Proteome Science, He Meng of Sanofi, and Mike Shifflet of Kenvue.
References
(1) Dong, M. W. The Pharmaceutical Industry and the Separation Scientist: Perspective, Trends, and Career Opportunities, LCGC N. Am. 2022, 40 (6), 252–257. DOI: 10.56530/lcgc.na.mv5986l8
(2) Dong, M. W. Small Molecule Drug Discovery (SMDD): Processes, Perspectives, Candidate Selection, and Career Opportunities for Analytical Chemists, LCGC N. Am. 2022, 40 (8), 344–350. DOI: 10.56530/lcgc.na.dd8277z9
(3) Dong, M. W. Drug Development Process: Nonclinical Development of Small Molecule Drugs. LCGC N. Am. 2022, 40 (10), 484–492. DOI: 10.56530/lcgc.na.lz5690w8
(4) Doneski, L.; Dong, M. W. Pharmaceutical Regulations: An Overview for the Analytical Chemist. LCGC N. Am. 2023, 41 (6), 211–215. DOI: 10.56530/lcgc.na.ua3181v7
(5) Doneski, L.; Roos, D.; Dong, M. W. Good Laboratory Practice (GLP): An Overview for the Analytical Chemist. LCGC N. Am. 2023, 41 (9), 381–385. DOI: 10.56530/lcgc.na.un1878g5
(6) Doneski, L.; Dong, M. W. Good Manufacture Practice (cGMP): An Overview for the Analytical Chemist. LCGC N. Am. 2023, 41 (10), 416–421. DOI: 10.56530/lcgc.na.qh7467g7
(7) CFR Title 21, Part 211, Good Manufacturing Practice for Finished Pharmaceuticals, Government Publishing Office.
(8) Dong, M. W. HPLC and UHPLC for Practicing Scientists, 2nd Ed.; Wiley, 2019. Chap. 9 and 11.
(9) Kou, D.; Wigman, L.; Yehl, P.; Dong, M. W. Separation Science in Drug Development, Part 4: Quality Control. LCGC N. Am. 2015, 33 (12), 900–909.
(10) Remarchuk, T.; Dong, M.; Askin, D., et al., Synthesis of Akt Inhibitor GDC-0068 (Ipatasertib). Part II. Total Synthesis and First Kilogram Scale-up. Organic Process Research and Development 2014, 18 (12), 1652–1666. DOI: 10.1021/op500270z
(11) United States Pharmacopeia (USP). https://www.usp.org (accessed 2024-05-06)
(12) International Conference on Harmonization. https://www.ich.or/page/quality-guidelines (accessed 2024-05-06)
(13) IQ Consortium. https://iqconsortium.org (accessed 2024-05-06)
(14) Coutant, M.; Ge, Z.; McElvain, J. S. et al. Early Development GMPs for Small-Molecule Specifications: An Industry Perspective (Part V). Pharm. Technol. 2012, 36 (10), 86–94. https://www.pharmtech.com/view/early-development-gmps-small-molecule-specifications-industry-perspective-part-v
(15) cGMP for Phase 1 investigational Drugs. U.S. Food and Drug Administration 2008. https://www.fda.gov/media/70975/download (accessed 2024-05-06)
About the Column Editor
Michael W. Dong is a principal of MWD Consulting, which provides training and consulting services in HPLC/UHPLC, CMC, method development, pharmaceutical analysis, and drug quality. He was formerly a Senior Scientist at Genentech, a Research Fellow at Purdue Pharma, and a Senior Staff Scientist at Applied Biosystems/PerkinElmer. Michael holds a Ph.D. in Analytical Chemistry from the Graduate Center of the City University of New York. He has over 130 publications and two best-seller books in HPLC from Wiley. He is an advisory board member of LCGC International and the Chinese American Chromatography Association. Direct correspondence to: chroncich@mjhlifesciences.com

Altering Capillary Gas Chromatography Systems Using Silicon Pneumatic Microvalves
May 5th 2025Many multi-column gas chromatography systems use two-position multi-port switching valves, which can suffer from delays in valve switching. Shimadzu researchers aimed to create a new sampling and switching module for these systems.
Characterizing Polyamides Using Reversed-Phase Liquid Chromatography
May 5th 2025Polyamides can be difficult to characterize, despite their use in various aspects of everyday life. Vrije Universiteit Amsterdam researchers hoped to address this using a reversed-phase liquid chromatography (RPLC)-based approach.
New Method Explored for the Detection of CECs in Crops Irrigated with Contaminated Water
April 30th 2025This new study presents a validated QuEChERS–LC-MS/MS method for detecting eight persistent, mobile, and toxic substances in escarole, tomatoes, and tomato leaves irrigated with contaminated water.
University of Tasmania Researchers Explore Haloacetic Acid Determiniation in Water with capLC–MS
April 29th 2025Haloacetic acid detection has become important when analyzing drinking and swimming pool water. University of Tasmania researchers have begun applying capillary liquid chromatography as a means of detecting these substances.

.png&w=3840&q=75)

.png&w=3840&q=75)


.png&w=3840&q=75)


.png&w=3840&q=75)


