Analysis of Therapeutic Monoclonal Antibodies Using a Platform Size Exclusion-HPLC Method
In biotherapeutics manufacturing, controlling size variants of therapeutic monoclonal antibodies (mAbs) is critical for ensuring product quality. Size-exclusion chromatography (SEC) is a leading method for analyzing size variants by separating high molecular weight and low molecular weight species from the monomer based on their hydrodynamic radius. We present a platform size exclusion-HPLC (SE–HPLC) method for analyzing a wide range of mAbs of different subclasses, demonstrating its feasibility through rigorous validation and evaluation. Our study highlights the method’s reproducibility, robustness, and ability to distinguish differences in size variants.
In biotherapeutics manufacturing, size variants are considered critical
quality attributes (CQAs); therefore, acceptance criteria should be established for batch release. Therapeutic monoclonal antibodies (mAbs) may form size variants depending on production and storage conditions. These variants include high and low molecular weight species (HMWS and LMWS). HMWS are typically dimers, trimers, and aggregates of antibodies, while LMWS are often hinge region fragments, Fc-Fab (~100 kDa) and Fab (~47 kDa) species (1–3).
Size-exclusion chromatography (SEC) is a primary method used under native conditions for monitoring size variants of mAbs during development and for routine quality control analysis (4). SEC is a non-adsorptive chromatographic method where proteins are separated based on hydrodynamic radius on a column consisting of spherical porous particles with a carefully controlled pore size using an aqueous mobile phase (5,6). HMWS cannot permeate all the pores in the chromatographic media and are partially excluded, thus are eluted earlier than the monomeric species. On the other hand, LMWS can permeate more pores and are eluted later. In size-exclusion-high performance liquid chromatography (SE-HPLC) analysis of mAbs, the main peak represents monomeric species, with HMWS eluted before and LMWS eluted after the main peak. The abundance of size variants may vary among different mAbs. The relative peak area of the main peak is reported as percent purity.
A platform analytical method streamlines analysis, making it efficient and economical. In this study, we demonstrate that a platform SEC method can be used for size variant analysis of a wide range of mAbs. First, we developed and optimized the method using an in-house IgG1 mAb and assessed its performance through repeatability, linearity, and robustness studies. Next, we used the method to analyze multiple lots of trastuzumab from US and EU (14 US and 21 EU lots) regions to understand lot-to-lot variability in the commercial product. Then, we analyzed 12 different mAbs belonging to subclasses IgG1, IgG2, IgG2/4, and IgG4. These mAbs cover a wide pI range and have different glycosylation patterns ranging from very simple (bevacizumab) to highly complex (cetuximab). Our results demonstrate the effectiveness of the platform SEC method for a variety of mAbs.
Materials and Methods
The US- and EU-Herceptin (trastuzumab) lots, along with 12 other approved therapeutic mAbs, were obtained from third-party vendors. These 12 mAbs include adalimumab (Humira), bevacizumab (Avastin), cetuximab (Erbitux), ipilimumab (Yervoy), omalizumab (Xolair), pertuzumab (Perjeta), rituximab (Rituxan), tocilizumab (Actemra), denosumab (Prolia), nivolumab (Opdivo), pembrolizumab (Keytruda), and eculizumab (Soliris). The Herceptin lots had expiration dates ranging from November 2019 to September 2023, while the expiration dates for the other 12 mAbs are provided in Table V. The lyophilized mAbs (Herceptin and Xolair) were reconstituted in water for injection with gentle swirling to help solubilization as directed by the manufacturer’s product insert information. These samples were aliquoted and stored at -70 °C before their expiration date. The mAbs in solution form were aliquoted and stored at -70 °C before their expiration date, except rituximab and cetuximab. The expired but unused lots of rituximab and cetuximab solutions were stored at 2–8 °C. All Herceptin lots were analyzed by SE-HPLC in February 2021, while other mAbs were analyzed in February 2024.
For SE-HPLC analysis, the Tosoh column TSKgel G3000SWxl, 7.8 mm x 30 cm (P/N 08541) and Thermo Scientific U3000 HPLC system were used. The mobile phase consisted of 0.2 M potassium chloride in 0.25 mM phosphate buffer, pH 7.0. The flow rate was 0.5 mL/min, and the column temperature was maintained at 30 °C. A UV detector wavelength of 280 nm was used for data acquisition. All samples were injected neat at a total of 50 micrograms.
Data acquisition and analysis were performed using Thermo Scientific Chromeleon Chromatography Data System software, version 7.2 SR4. All peaks detected at 280 nm wavelength were integrated using a fixed baseline with a perpendicular delimiter drop. For in-house IgG1 mAb and all Herceptin lots, the integration window ranged from 5 to 21 min. The total peak area represents the sum of area of all the peaks within the specified elution window of a chromatogram. The % main peak, % HMWS, and % LMWS were determined using the formulas given below:


SE-HPLC-MALS analysis was conducted using microDawn multi-angle light scattering and Optilab dRI detectors from Waters. The MALS, UV, and dRI data were collected and analyzed using ASTRA software version 8.2.1.
Results and Discussion
Method Development
The platform SE-HPLC method was developed using an in-house IgG1 mAb. Figure 1a shows the UV chromatographic separation profile of the mAb, while Figure 1b shows a zoomed-in view. The SEC column, with a particle size of 5 μm and a pore size of 25 nm, provided resolution of the HMWS from the monomer. Secondary interactions, which depend on the physicochemical properties of the mAbs, may result in peak tailing. However, an asymmetry value of 1.12 for the main peak suggests minimal non-specific interaction with the column.

Figure 1: SEC UV chromatogram of in-house IgG1 mAb; (a) full view, and (b) zoomed-in view.

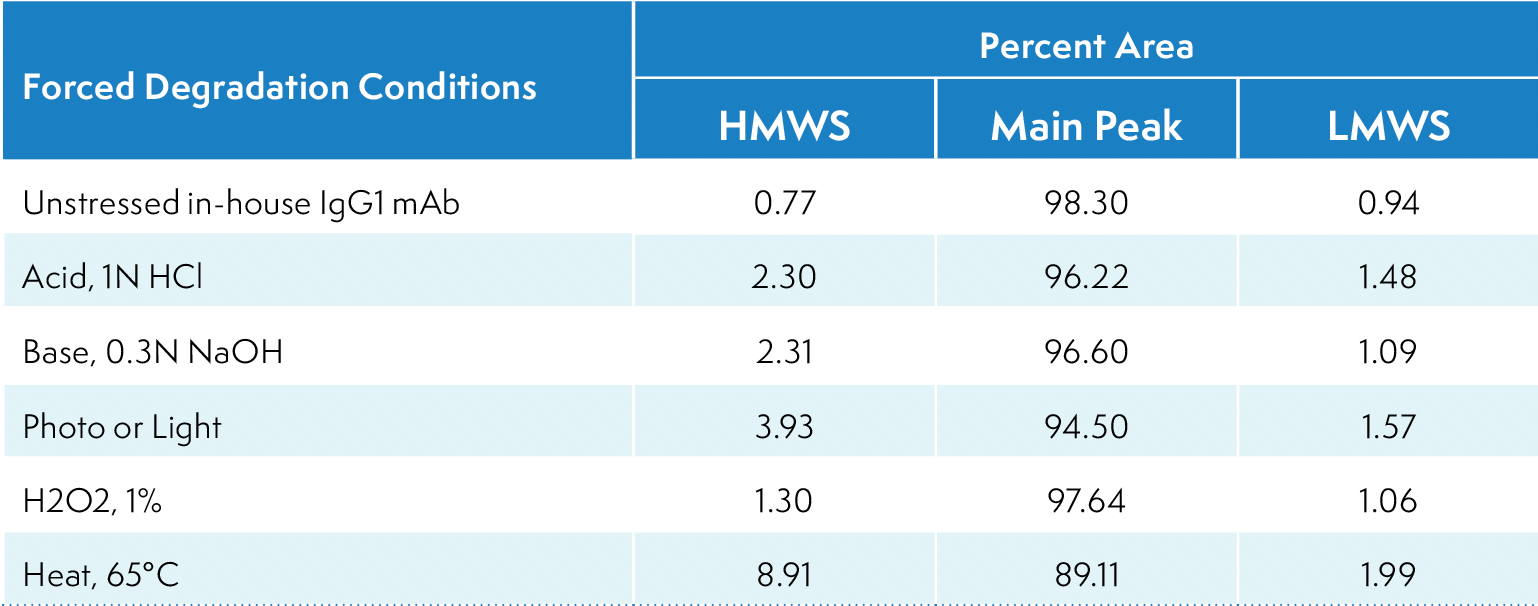
The method’s suitability for analyzing size variants of different abundances was further assessed using forced-degraded IgG1 mAb. The forced degradative conditions included acid (1N HCl), base (0.3N NaOH), photo or light (ICH condition), H2O2 (1%), and heat (65 °C). Figure 2 shows overlaid zoomed-in profiles of the mAb with various levels of HMWS and LMWS under unstressed and different forceddegradation conditions, while Table I shows their percentages. Exposure to light led to an increased abundance of dimer species, while exposure to heat resulted in the formation of higher-level aggregates. Each forced degraded sample shows a distinct chromatographic profile compared to the unstressed sample, thus confirming the stability indicating capability of the method.

Figure 2: SEC UV chromatograms of in-house mAb under various forced degradation conditions.
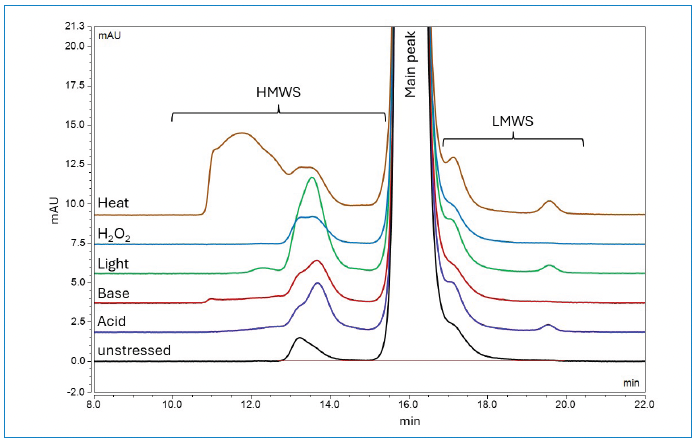

Table I: Relative abundance of size variants in forced-degraded samples
Method Validation
The performance characteristics of the platform SE-HPLC method were evaluated, and met the criteria for its intended purpose.
Repeatability
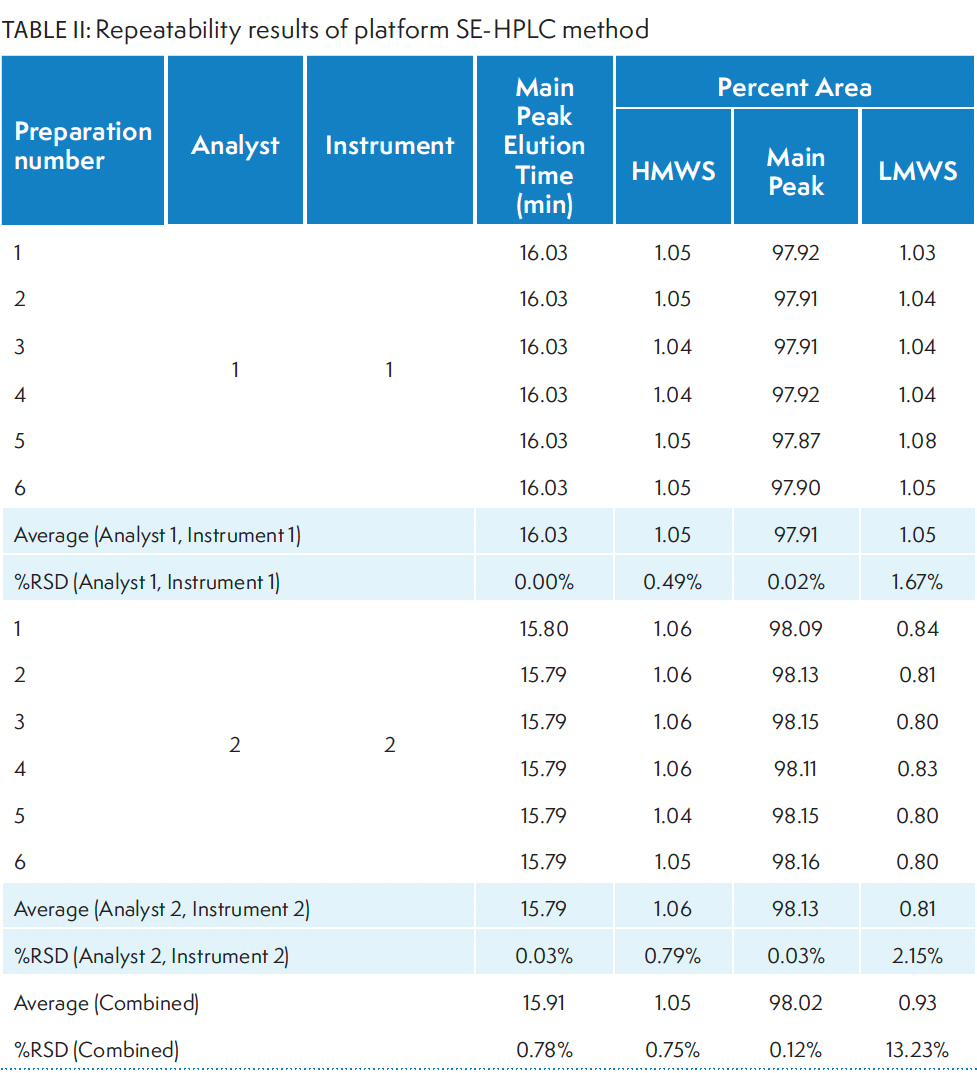
Repeatability analysis was performed to assess the ability of the method to generate reproducible results. Two analysts analyzed six preparations of the in-house IgG1 mAb at a nominal (100%) loading amount. Each analyst used two separate HPLC systems, both same model and from the same vendor. However, the HPLCs were equipped with two different pumps (ternary vs. quaternary). Table II displays the main peak elution time and percent area for the main, HMWS, and LMWS. The slight differences in percent area of LMWS observed in the data between the two analysts are due to the auto peak splitting feature of the software during data integration. The overall low %RSD in the repeatability analysis indicates high reproducibility of the method.

Table II: Repeatability results of platform SE-HPLC method
Linearity
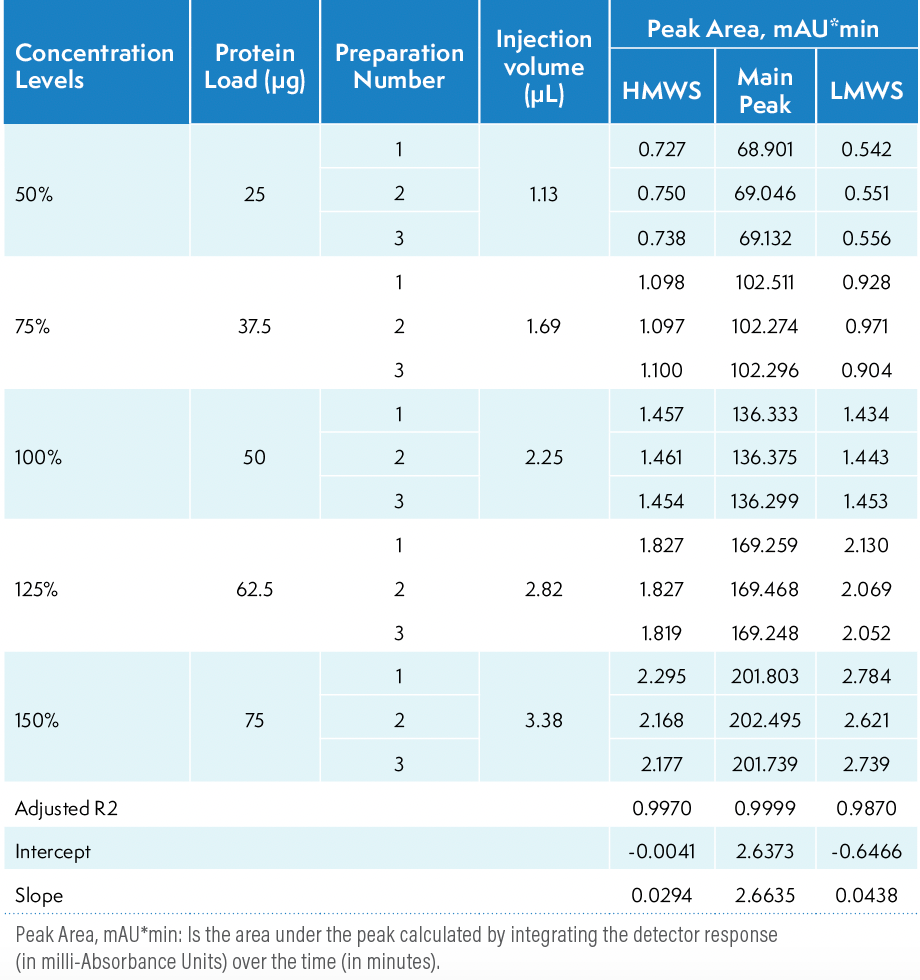
The linearity analysis of a method determines its ability to obtain results that are directly proportional to the sample concentration or amount over a given range. The linearity of the SE-HPLC method was assessed at five concentration levels: 50%, 75%, 100%, 125%, and 150% of the nominal protein load, which corresponds to on-column protein load of 25, 37.5, 50, 62.5, and 75 micrograms, respectively. Three preparations of the samples were injected once for each of the five target load levels with varied injection volumes. Table III provides a summary of the results obtained from the linearity study. Regression analysis was performed on the peak area of HMWS, the main peak, and LMWS against the protein load amount. The R2, intercept, and slope of the regression are presented in Table III. The coefficient of linear correlation, R2, was greater than 0.99 for the main peak, HMWS, and LMWS, indicating the linearity of the method between 50% to 150% of the protein load amount.

Table III: Linearity analysis of platform SE-HPLC method
Robustness
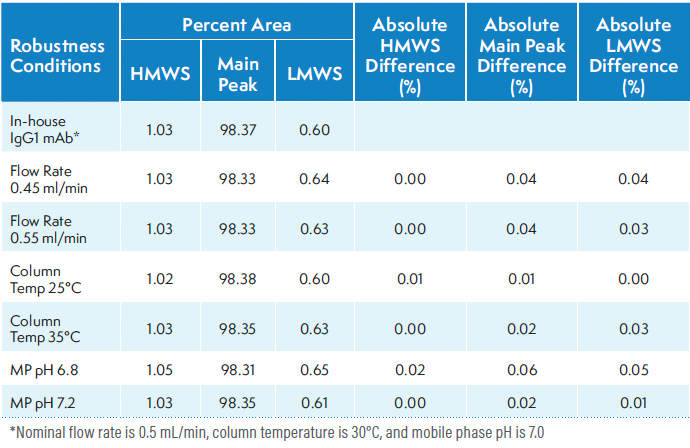
The robustness of an analytical procedure measures its ability to remain unaffected by small, deliberate variations in method parameters, providing an indication of its reliability during normal usage. The robustness of the method was evaluated by varying the flow rate (±0.05 of the nominal 0.5 mL/ min), column temperature (±5°C of the nominal 30 °C), and mobile phase pH (±0.2 of the nominal 7.0). The percentages of main, HMWS, and LMWS in IgG1 mAb under varied conditions were compared with those obtained at the nominal condition. Table IV presents a summary of the results from the robustness study. The low percent difference demonstrates that the method is robust and reliable.

Table IV: Robustness evaluation of platform SE-HPLC method
Evaluation of Size Variants of Multiple Lots of Trastuzumab from US and EU Regions with the Platform SE-HPLC Method
The platform SE-HPLC method was used to assess lot-to-lot variability of size variants in 14 lots of trastuzumab from the United States and 21 lots from the EU region. Figure 3a shows the overlay of UV chromatographic profiles of U.S. and EU lots, while Figure 3b shows a zoomed-in view of HMWS and LMWS. The lot numbers of trastuzumab are indicated next to the corresponding chromatographic traces in Figure 3. The chromatographic profiles are visually similar with no missing or new peaks observed.

Figure 3: Overlaid SEC chromatographic profiles of trastuzumab lots from US (green trace) and EU (blue trace) regions; (a) full view, and (b) zoomed-in view showing HMWS and LMWS.

For all trastuzumab lots, a distinct dimer peak is well resolved from the monomer, with a resolution greater than 2.6. The method is usually considered acceptable if the resolution is 1.5 and above, ensuring a baseline resolution of the two species (7). The resolution between the monomer and Fc-Fab fragment can be achieved by increasing the column length (8). The % peak area for the main species ranged from 99.0 to 99.4%, while the HMWS ranged from 0.3 to 0.7%.
Evaluation of Size Variants in 12 Therapeutic Monoclonal Antibodies with the Platform SE-HPLC Method
The method was used to assess size variants in single lots of 12 approved therapeutic mAbs. Table V presents the details of these mAbs, including their lot number and expiration date. The UV chromatographic profiles of each mAb are shown in Figure 4a. The peak asymmetry values of the monomeric peak ranged from 0.99 (ipilimumab) to 1.20 (cetuximab). All mAbs had relatively similar main peak elution times, ranging from 15.8 to 16.4 minutes, except for ipilimumab, which was eluted at 18.1 min.

Figure 4: UV chromatograms of 12 mAbs analyzed by platform SE HPLC method; (a) full view, and (b) zoomed-in view showing HMWS and LMWS.
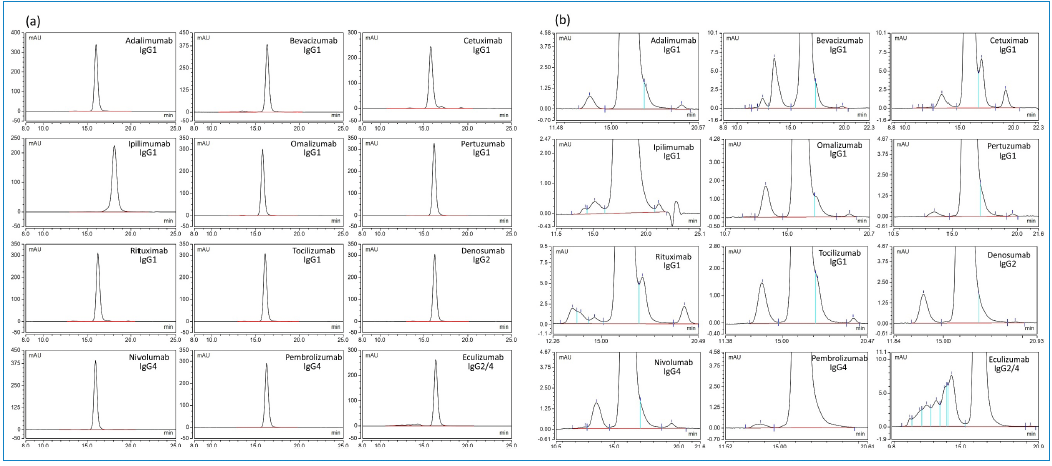

Table V: SE-HPLC and SEC-MALS analysies of therapeutic mAbs
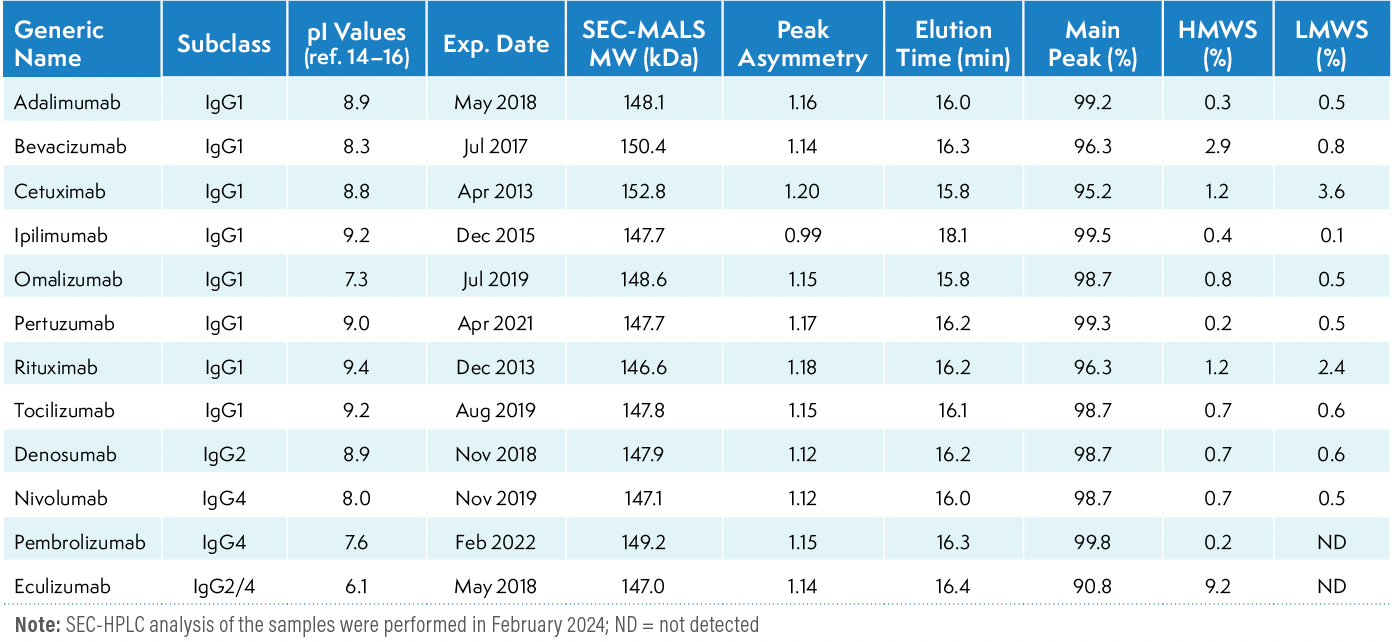
The close elution time of the mAbs indicates their similar molecular weight, which ranges between 146–149 kDa. The slightly earlier elution time (15.8 min) of cetuximab aligns with its slightly higher molecular weight of 152 kDa (9) compared to other antibodies. Omalizumab also showed an elution time of 15.8 min; however, its molecular of 149 kDa (10) suggests that the difference in elution time compared to mAbs of similar molecular weight could be due to differences in hydrodynamic radius. The delayed elution of ipilimumab does not align with its molecular weight of 148 kDa (11), but could be attributed to the hydrodynamic radius or hydrophobic effects (12).
As seen in Figure 4b, each mAb exhibits a different pattern and levels of HMWS and LMWS. The method provided resolution of the aggregates from the main peak for all mAbs, with IgG1 bevacizumab and IgG2/4 eculizumab exhibiting a higher level of aggregation. LMW species were also detected at various abundance levels. Cetuximab and rituximab showed a high percentage of LMWS, which may be due to fragmentation since the samples were analyzed almost 10 years after expiration. Unlike other mAbs, the unused expired lots of both cetuximab and rituximab were in solution form stored at 2–8 °C and were opened before analysis.
The relative percentages of main peak, HMWS, and LMWS in each mAb are presented in Table V. Each sample was analyzed in three replicates injections, and an average is reported.
We performed SEC-MALS analysis to determine the molecular weight of monomeric species. SEC-MALS combines multi-angle light scattering with size-exclusion chromatography. The MALS signals, along with UV absorbance and differential refractive index (dRI) signals, are analyzed to determine the molar mass of the protein. SEC-MALS is an absolute technique that does not depend on molecular shape or conformation and is not impacted by non-ideal column interactions (13). As shown in Table V, the observed molecular weight of the monomeric peaks of the mAbs with SEC–MALS are very close to one another.
In summary, our study shows that the platform SE–HPLC method with mobile phase containing 0.2 M potassium chloride in 0.25 mM phosphate buffer, pH 7.0 can separate mAbs of different subclasses. The method yields symmetrical monomeric peak shape, and provides high resolution of an mAb monomer from dimer and higher order aggregates.
Conclusion
In this study, we demonstrate that an SE-HPLC method developed and validated for an in-house IgG1 mAb serves as a platform method for monitoring size variants in different IgG subclasses. The validated SE-HPLC method was used to evaluate the variability of size variants in various trastuzumab lots obtained from US and EU regions. The method effectively separates the HMWS and LMWS from the main monomeric peak and provides quantitative information regarding them. Subsequently, the method was applied to analyze size variants of various approved therapeutic mAbs. Our results indicate that the platform SE-HPLC method is applicable to a wide range of mAbs, and possesses high-resolving power for the separation of monomers and dimers, facilitating easy quantitative analysis of size variants in the samples.
Acknowledgments
The authors thank Chengfeng Zhou for assistance with the method validation activities and Doris Ye for providing forced degraded IgG1 mAb samples.
References
(1) Plath, F.; Ringler, P.; Graff-Meyer, A. et al. Characterization
of MAb Dimers Reveals Predominant Dimer Forms Common
in Therapeutic MAbs. MAbs 2016, 8 (5), 928–940. DOI:
10.1080/19420862.2016.1168960
(2) Li, W.; Prabakaran, P.; Chen, W.; Zhu, Z.; Feng, Y.; Dimitrov,
D. S. Antibody Aggregation: Insights from Sequence
and Structure. Antibodies 2016, 5 (3), 19. DOI: 10.3390/antib5030019
(3) Vlasak, J.; Ionescu, R. Fragmentation of Monoclonal
Antibodies. MAbs 2011, 3 (3), 253–263. DOI: 10.4161/mabs.3.3.15608
(4) Yang, R.; Tang, Y.; Zhang, B.; Lu, X.; Liu, A.; Zhang, Y. T. High Resolution Separation of Recombinant Monoclonal Antibodies by Size-Exclusion Ultra-High Performance Liquid Chromatography (SE-UHPLC). J. Pharm. Biomed. Anal. 2015, 109, 52–61. DOI: 10.1016/j.jpba.2015.02.032
(5) Fekete, S.; Beck, A.; Veuthey, J. L.; Guillarme, D. Theory and
Practice of Size Exclusion Chromatography for the Analysis
of Protein Aggregates. J. Pharm. Biomed. Anal. 2014, 101, 161–173. DOI: 10.1016/j.jpba.2014.04.011
(6) Knihtila, R.; Song, Y.; Chemmalil, L.; Ding, J.; Mussa, N.; Li,
Z. J. Systematic Development of a Size Exclusion Chromatography Method for a Monoclonal Antibody with High Surface Aggregation Propensity (SAP) Index. J. Pharm. Sci. 2021, 110 (7), 2651–2660. DOI: 10.1016/j.xphs.2021.03.023
(7) Chakrabarti, A. Separation of Monoclonal Antibodies by Analytical Size Exclusion Chromatography. Antibody Engineering
2018. DOI: 10.5772/intechopen.73321
(8) Gritti, F.; Meyyapan, S. Physical Origin of the Peak Tailing of Monoclonal Antibodies in Size-Exclusion Chromatography Using Bio-Compatible Systems and Columns. Anal. Bioanal. Chem. 2024, 416 (5), 1281–1291. DOI: 10.1007/s00216-023-05119-2
(9) Ayoub, D.; Jabs, W.; Resemann, A. et al. Correct Primary Structure Assessment and Extensive Glyco-Profiling of Cetuximab by a Combination of Intact, Middle-up, Middle-down and Bottom-up ESI and MALDI Mass Spectrometry Techniques. MAbs 2013, 5 (5), 699–710. DOI: 10.4161/mabs.25423
(10) U.S. Food and Drug Administration https://www.accessdata.fda.gov/drugsatfda_docs/label/2003/omalgen062003LB.pdf (accessed 2024-03-04)
(11) U.S. Food and Drug Administration. https://www.accessdata.fda.gov/drugsatfda_docs/label/2015/125377s074lbl.pdf (accessed 2024-03-04)
(12) Hong, P.; Koza, S.; Bouvier, E. S. P. Size-Exclusion Chromatography for the Analysis of Protein Biotherapeutics and Their Aggregates. J. Liq. Chromatogr. Relat. Technol. 2012, 35 (20), 2923–2950. DOI: 10.1080/10826076.2012.743724
(13) Some, D.; Amartely, H.; Tsadok, A.; Lebendiker, M. Characterization of Proteins by Size-Exclusion Chromatography Coupled to Multi-Angle Light Scattering (SEC-MALS). J. Vis. Exp. 2019, 148, e59615. DOI: 10.3791/59615
(14) Miao, S.; Fan, L.; Zhao, L. et al. Physicochemical and Biological Characterization of the Proposed Biosimilar Tocilizumab. Biomed. Res. Int. 2017, 2017 (7), 1–13. DOI: 10.1155/2017/4926168
(15) Wang, Y.; Xheng, C.; Zhuang, C. et al. Characterization and Pre-Clinical Assessment of a Proposed Biosimilar to its Originator Omalizumab. Eur. J. Pharm. Sci. 2022, 178 (11), 106292. DOI: 10.1016/j.ejps.2022.106292
(16) Goyon, A.; Excoffier, M.; Janin-Bussat, M. C. et al. Determination of Isoelectric Points and Relative Charge Variants of 23 Therapeutic Monoclonal Antibodies. J. Chromatogr. B. Analyt. Technol. Biomed. Life Sci. 2017, 1065–1066 (2), 119–128. DOI: 10.1016/j.jchromb.2017.09.033


.Close up image | Image Credit: © Prajakkit - stock.adobe.com")


New Method Explored for the Detection of CECs in Crops Irrigated with Contaminated Water
April 30th 2025This new study presents a validated QuEChERS–LC-MS/MS method for detecting eight persistent, mobile, and toxic substances in escarole, tomatoes, and tomato leaves irrigated with contaminated water.
, also known as an immunoglobulin (Ig). 3d vector © sakurra - stock.adobe.com")
Accelerating Monoclonal Antibody Quality Control: The Role of LC–MS in Upstream Bioprocessing
This study highlights the promising potential of LC–MS as a powerful tool for mAb quality control within the context of upstream processing.

University of Tasmania Researchers Explore Haloacetic Acid Determiniation in Water with capLC–MS
April 29th 2025Haloacetic acid detection has become important when analyzing drinking and swimming pool water. University of Tasmania researchers have begun applying capillary liquid chromatography as a means of detecting these substances.

